Production and Distribution of 44Ti and 56Ni in a Three-dimensional Supernova Model Resembling Cassiopeia A
Abstract
The spatial and velocity distributions of nuclear species synthesized in the innermost regions of core-collapse supernovae (SNe) can yield important clues about explosion asymmetries and the operation of the still disputed explosion mechanism. Recent observations of radioactive 44Ti with high-energy satellite telescopes (NuSTAR, INTEGRAL) have measured gamma-ray line details, which provide direct evidence of large-scale explosion asymmetries in Supernova 1987A, and in Cassiopeia A (Cas A) even by mapping of the spatial brightness distribution (NuSTAR). Here, we discuss a three-dimensional (3D) simulation of a neutrino-driven explosion, using a parametrized neutrino engine, whose 44Ti distribution is mostly concentrated in one hemisphere pointing opposite to the neutron-star (NS) kick velocity. Both exhibit intriguing resemblance to the observed morphology of the Cas A remnant, although neither progenitor nor explosion were fine-tuned for a perfect match. Our results demonstrate that the asymmetries observed in this remnant can, in principle, be accounted for by a neutrino-driven explosion, and that the high 44Ti abundance in Cas A may be explained without invoking rapid rotation or a jet-driven explosion, because neutrino-driven explosions genericly eject large amounts of high-entropy matter. The recoil acceleration of the NS is connected to mass-ejection asymmetries and is opposite to the direction of the stronger explosion, fully compatible with the gravitational tug-boat mechanism. Our results also imply that Cas A and SN 1987A could possess similarly “one-sided” Ti and Fe asymmetries, with the difference that Cas A is viewed from a direction with large inclination angle to the NS motion, whereas the NS in SN 1987A should have a dominant velocity component pointing toward us.
1 Introduction
Radioactive nuclei such as 56,57Ni, 55,60Co, and 44Ti, which are freshly synthesized during the explosion, power the electromagnetic emission of supernovae (SNe) over months and years by their decay to stable 56,57Fe, 55Mn, 60Ni, and 44Ca, respectively. Moreover, their production in the innermost regions of the exploding star qualifies such nuclei as sensitive probes of the conditions near the blast-wave origin and possibly even of the explosion mechanism and the shock-wave dynamics during the earliest phases of SN outbursts. These aspects are strong motivation for observational efforts and theoretical studies of the nucleosynthesis of radioactive species with the goal to connect explosion models to observations and to deduce important constraints for the underlying processes.
Because of its diagnostic potential for the explosion dynamics and its long half life of about 60 years111Nuclear decay information is available from the National Nuclear Data Center at http://www.nndc.bnl.gov/., 44Ti is of particular interest and can potentially be detected directly or indirectly also in SNe and in young SN remnants (SNRs). This has indeed been achieved for SN 1987A and Cassiopeia A (Cas A) (for reviews, see Vink, 2005, 2012; Diehl, 2013). Besides spectroscopic analysis and light-curve fitting of SNe, e.g. in the case of SN 1987A (see, for example, the recent works by Jerkstrand et al. 2011 and Seitenzahl et al. 2014), X-ray and gamma-ray observations of SN 1987A (e.g. Grebenev et al., 2012; Boggs et al., 2015) and Cas A (e.g. Iyudin et al., 1994; Vink et al., 2001; Renaud et al., 2006; Grefenstette et al., 2014; Siegert et al., 2015) allow to obtain estimates of the 44Ti yield and to deduce information on the velocity and spatial distributions of this nucleus.
Particularly interesting in this respect are recent, long-exposure measurements of the 44Ti emission from SN 1987A and Cas A with the space-based INTErnational Gamma-Ray Astrophysics Laboratory (INTEGRAL; e.g. Renaud et al., 2006; Siegert et al., 2015; Wang & Li, 2016) and the Nuclear Spectroscopic Telescope Array (NuSTAR) focusing high-energy X-ray telescope (Boggs et al., 2015; Grefenstette et al., 2014). These measurements provide clear evidence of the presence of such inner, radioactive ejecta, and, moreover, reveal large asymmetries of the 44Ti ejection closely connected to the inner “engine” of the explosion. The imaging of the 44Ti distribution of Cas A is an exciting additional piece in a growing wealth of observational data that reveal the three-dimensional morphology of this young SNR in fascinating detail, including nebular emission lines of N, O, Ne, Si, S, Ar, Ca, and constraints on the neutron-star (NS) kick (e.g. Hughes et al., 2000; Fesen, 2001; Fesen et al., 2001; Gotthelf et al., 2001; Hwang & Laming, 2003; Laming & Hwang, 2003; Hwang et al., 2004; Fesen et al., 2006a; Smith et al., 2009; DeLaney et al., 2010; Isensee et al., 2010; Fesen et al., 2011; Hwang & Laming, 2012; Isensee et al., 2012; Milisavljevic & Fesen, 2013, 2015). The NuSTAR map of the Cas A 44Ti distribution (Grefenstette et al., 2014) in combination with the determined direction of the NS motion (Thorstensen et al., 2001; Fesen et al., 2006b) provides extremely valuable hints to the explosion dynamics that manifests itself in the recoil acceleration of the compact remnant and the anisotropic expulsion of nucleosynthetic products originating from the innermost SN ejecta. The inferred 44Ti yield of by NuSTAR (Grefenstette et al., 2014, 2017) and INTEGRAL (Siegert et al., 2015; Wang & Li, 2016) also provides a clue of the nucleosynthesis-relevant conditions, which allow for a 44Ti production that is about three times greater than recent theoretical estimates invoking spherically symmetric explosions (e.g., Perego et al., 2015). The need of asymmetric explosions to explain the large yields of 44Ti in SN 1987A and Cas A was pointed out first by Nagataki et al. (1997, 1998).
Here we present results from three-dimensional (3D) hydrodynamical SN simulations that exhibit morphological properties with intriguing similarity to those of the Cas A SNR. Our results demonstrate that the neutrino-driven mechanism with associated hydrodynamic instabilities is able to explain the NS kick and the spatial asymmetries of the 44Ti knots observed in a core-collapse SN like Cas A. We also post-process our 3D hydrodynamic calculations for the production of 44Ti and 56Ni using tracer particles and a large reaction network of 6300 nuclear species. The discussed SN simulations are based on one model drawn from a larger pool of 3D simulations of neutrino-powered explosions published in a series of papers by Wongwathanarat et al. (2010b, 2013, 2015). The considered model is case W15-2, whose onset of the explosion and first seconds were computed by Wongwathanarat et al. (2010b, 2013), and whose continued evolution to shock breakout from the stellar surface was subsequently followed as model W15-2-cw by Wongwathanarat et al. (2015). The original progenitor of this explosion model was a red supergiant star (RSG) of 15 with a 4.4 helium core of slightly more than cm in radius, whereas Cas A goes back to a Type-IIb SN and therefore a star that had stripped most of its hydrogen (Krause et al., 2008; Rest et al., 2011). In order to avoid the dynamical consequences of the extended hydrogen envelope we repeated our previous simulations for the same stellar model but after having removed the H-envelope except its innermost 0.3 .
For our demonstration of the possibility in principle to reproduce the observed explosion asymmetries, it is not necessary that the employed model of the progenitor optimally matches the estimated properties of the Cas A progenitor (as discussed, e.g., in Orlando et al., 2016). It is also not mandatory to strive for a perfect agreement of the fundamental parameters of the explosion model with those determined for the Cas A SN. Hence, instead of performing a tedious and computing-intense fine tuning of explosion parameters, we can focus on the existing W15-2 model with its peculiar explosion geometry, even though this simulation falls somewhat short of producing the explosion energy and iron yield inferred from detailed analyses of the Cas A SNR. In view of the stochastic nature of the hydrodynamic instabilities, i.e. convective overturn and standing accretion shock instability (SASI; Blondin et al., 2003), which are responsible for the growth of initial seed perturbations to the observable ejecta asymmetries, we can expect that cases with morphologies similar to that of W15-2 will also be found in sufficiently large sets of models with slightly different explosion energies and iron yields.
Our paper is structured as follows. In Sect. 2 we will describe our numerical methods, initial models, input physics, and post-processing for the nucleosynthesis, in Sect. 3 our results for the 44Ti and 56Ni nucleosynthesis and the spatial and velocity distributions of these nuclei in comparison to the NuSTAR observations of Cas A, and in Sect. 4 we will finish with a summary and conclusions, also with an eye on possible aspects in common with SN 1987A.
2 Numerical setup
2.1 Numerical method
Our simulation of a SN IIb-like case, starting at 1400 s after core bounce, is performed with the finite-volume Eulerian multifluid hydrodynamics code Prometheus (Fryxell et al., 1991; Müller et al., 1991b, a). The multidimensional Euler equations are integrated using the dimensional splitting technique of Strang (1968). The code utilizes the piecewise parabolic method (PPM; Colella & Woodward, 1984), and employs a Riemann solver for real gases (Colella & Glaz, 1985). To prevent numerical artifacts created by the odd-even decoupling (Quirk, 1994) the AUSM+ Riemann solver of Liou (1996) is applied inside grid cells with strong grid-aligned shocks.
For spatial discretization we utilize the Yin-Yang overlapping grid technique in spherical geometry (Kageyama & Sato, 2004) implemented in the Prometheus code to alleviate the restrictive Courant-Friedrich-Lewy (CFL) time-step condition in polar regions (Wongwathanarat et al., 2010a). In our simulation an angular resolution of 2∘ is used. The radial grid is logarithmically spaced, spanning from km to km with a relative grid resolution of 0.5% and 1% inside and outside of the progenitor star, respectively. The total number of (static) Eulerian grid zones is initially. The innermost radial grid zones are successively discarded as the SN shock propagates to larger radii to relax the CFL condition. The radius of the inner grid boundary, which is treated with an outflow condition, is thus time-dependent, and is placed at approximately of the minimum SN shock radius. At the end of the simulation the number of radial grid zones has decreased to 466 cells.
2.2 Initial model
Our SN simulation is based on a 15 red supergiant progenitor, model s15s7b2 of Woosley & Weaver (1995), which was denoted as pre-collapse model W15 in Wongwathanarat et al. (2015). The first seconds of the neutrino-driven explosion of this model were simulated in 3D by Wongwathanarat et al. (2010b, 2013), using the Prometheus-Hotb code with the Yin-Yang grid. The code contains an approximate, gray treatment of neutrino transport (Scheck et al., 2006) connected with a boundary condition for the luminosities of all neutrino species imposed at a contracting Lagrangian radius placed at 1.1 considerably inside the neutrinosphere. By prescribing (time-dependent) neutrino luminosities at this inner grid boundary it is possible to regulate the strength of the neutrino heating and thus to tune the energy of the neutrino-driven explosion to a desired value.
The particular model considered here is W15-2, which explodes with an energy of about B (1.13 B after 1.4 s and 1.47 B finally; Wongwathanarat et al., 2010b, 2013, 2015). The evolution until shock breakout from the red supergiant was tracked as model W15-2-cw by Wongwathanarat et al. (2015).
We stress that the asymmetries of the 3D explosion model developed stochastically mainly by convective overturn in the neutrino-heating layer. Convection, which is the dominant hydrodynamic instability in the postshock region under the conditions of this model, is seeded by initial random perturbations with an amplitude of 0.1% of the radial velocity, imposed as cell-by-cell random pattern at the beginning of the simulation on a spherically symmetric (1D) post-collapse model about 10 ms after bounce. The large-scale asymmetries that characterize the final distribution of iron-group elements, silicon, and oxygen (see Wongwathanarat et al., 2015) were neither imposed by hand nor did they grow from pre-existing large-scale perturbations, e.g. in the oxygen-burning shell of the progenitor star (for such possible asymmetries, which are not considered here, see Arnett & Meakin, 2011; Couch et al., 2015; Müller et al., 2016b).
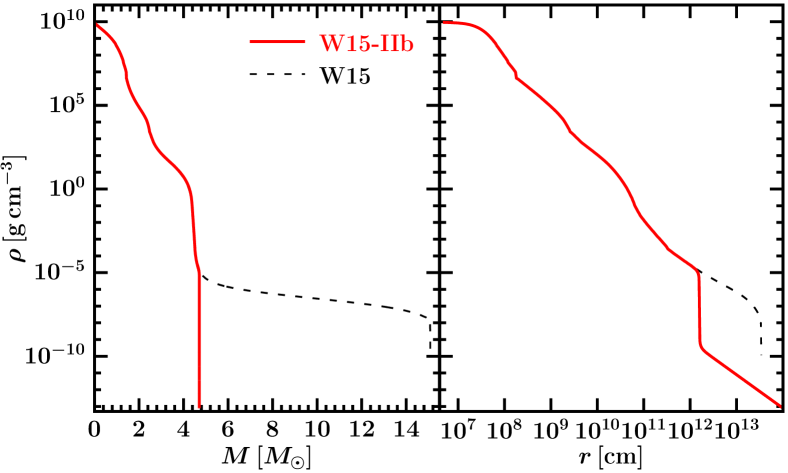
Since Cas A was diagnosed to be a Type IIb SN (Krause et al., 2008; Rest et al., 2011), we repeat the 3D long-time simulation in the present work with the W15 progenitor model after having removed the hydrogen envelope down to a rest of 0.3 , see model W15-IIb in Figure 1, which shows the density profile versus enclosed mass and radius of the modified progenitor model in comparison to the original W15 model. The stellar radius of W15-IIb becomes km. Outside of this radius we adopt the treatment by Wongwathanarat et al. (2015) and assume the presence of circumstellar matter with density and temperature profiles following an decline. Since the onset and early phases of the explosion are not affected by our modification of the hydrogen envelope, we map initial data from model W15-2-cw at a post-bounce time of s when the SN shock has nearly reached . We then follow the subsequent evolution of the SN ejecta until approximately 1.25 days after core bounce. This new explosion simulation is termed W15-2-cw-IIb.
By artificially removing most of the hydrogen we destroy the self-consistent, hydrostatic structure of the near-surface layers and the remaining hydrogen envelope becomes unrealistic in its radial profile. This is likely to corrupt the shock propagation through the hydrogen shell and the shock breakout from the stellar surface. However, this manipulation has no effect on the large-scale asymmetries imposed by the explosion mechanism on the innermost SN ejecta such as the 56Ni and 44Ti yields. Moreover, our modified model is also good enough to permit the demonstration of consequences associated with the absence of the massive hydrogen envelope, in particular for the maximum expansion velocities that can be retained by the mentioned nucleosynthesis products. As shown by Wongwathanarat et al. (2015), the detailed composition-shell structure of the SN progenitor, especially the density profile in the He- and H-layers, has a strong influence on the propagation of the SN shock, on the development of secondary mixing instabilities and reverse shocks at the composition-shell interfaces, and on the interaction of these instabilities and reverse shocks with the initial ejecta asymmetries imposed by the central explosion mechanism itself. In the case of the lack of a massive hydrogen envelope, for example, the reverse shock forming at the He/H interface after the passage of the SN shock is absent and the corresponding deceleration of fast-moving inner ejecta, especially also of nickel and titanium, does not take place. We will discuss these effects in Sect. 3.2.
Starting with a neutrino-driven explosion with highly aspherical mass ejection from the beginning, we are unable to quantitatively assess a possible reduction of the strength of Rayleigh-Taylor (RT) instabilities in material of intermediate mass numbers due to the lack of a strong reverse shock from the He/H interface. Such a reduction is suggested by the works of Ellinger et al. (2012, 2013), where a strong reverse shock had a substantial influence on the RT growth at the C-O/He composition interface. In contrast to our explosion modeling, Ellinger et al. (2012, 2013) launched their explosions in 1D and followed the propagation of a spherical blast wave from the C-O core into the He layer. However, the initial asymmetries created by the neutrino-driven mechanism in collaboration with hydrodynamic instabilities during the very first second of the explosion affect the iron and titanium nucleosynthesis and imprint large-scale asphericities on the innermost ejecta, the outgoing SN shock, and the SN explosion as a whole. They are therefore crucial in seeding the secondary mixing instabilities that grow at the C-O/He and He/H shell interfaces of the progenitor, and the presence of pronounced initial explosion asymmetries causes the radial mixing to be much more efficient and to penetrate deeper (well down into the region of Fe formation) than in the case of explosions initiated in spherical symmetry (see, e.g., Kifonidis et al., 2003, 2006; Wongwathanarat et al., 2015). Since the RT growth factor at the C-O/He-core interface in our model is huge after the passage of the SN shock (see figure 5 in Wongwathanarat et al., 2015), the development of RT instability at this interface depends primarily on the initial perturbations in the metal-rich ejecta (including the layers containing 56Ni and 44Ti) and not on the lack or presence of the reverse shock from the He/H interface. As a consequence, we observe the same highly deformed ejecta geometry on the largest scales for model W15-2-cw-IIb and for the RSG explosion W15-2-cw, before in the latter case the reverse shock from the He/H interface decelerates the core of intermediate-mass elements and RT instability at the base of the hydrogen shell triggers the fragmentation of the inner ejecta to smaller-scale structures (compare figure 7, top row, of Wongwathanarat et al., 2015, with the results reported in Sect. 3.3 below).
2.3 Input physics
In our simulation of model W15-2-cw-IIb, gravity is taken into account in the hydrodynamics equations. We use the spherical harmonics expansion technique of Müller & Steinmetz (1995) to solve the Poisson equation with source terms for the Newtonian self-gravity of the SN ejecta and the gravitational contribution of a point mass that is placed at the coordinate origin and accounts for the central compact remnant and additional material that starts as ejecta gas but gets absorbed through the inner grid boundary in course of the evolution by fallback and the successive outward relocation of the inner grid boundary.
The tabulated equation of state (EoS) of Timmes & Swesty (2000) is employed for describing the stellar plasma as a mix of arbitrarily degenerate and relativistic electrons and positrons, blackbody radiation, and ideal Boltzmann gases of a defined set of fully ionized nuclei, taking into account corrections for Coulomb effects. We consider 11 nuclear species, namely protons, nine -nuclei from 4He to 56Ni (excluding 32S, 36Ar, 48Cr, and 52Fe from the chain), and a “tracer nucleus” X that (schematically) represents iron-group species synthesized in neutrino-heated ejecta under conditions of neutron excess. The advection of nuclear species with plasma motions is treated with the consistent multifluid advection scheme of Plewa & Müller (1999).
In the discussed simulation of model W15-2-cw-IIb nuclear burning plays no role, because nuclear reactions become unimportant in the expanding SN ejecta during the late stages and on the time scales considered. The simulation is therefore devoted to studying the long-time evolution of the spatial and velocity distribution of the nucleosynthesis products obtained in the earlier phases, i.e., in models W15-2 and W15-2-cw, from which we adopt the initial data for the 3D evolution of model W15-2-cw-IIb. Nuclear fusion processes were taken into account in the computations of models W15-2 and W15-2-cw through a small -reactions network, connecting the 11 nuclear species mentioned above, details of which were given by Wongwathanarat et al. (2013, 2015). The small network is able to provide rough information about the assembling of heavy nuclei in the SN outflows, but it is unable to give accurate results for the yields of individual nuclear species. The production of 44Ti, for example, is massively overestimated by the small network (see Table 3 of Wongwathanarat et al., 2013). For a more accurate assessment of the nucleosythesis of 56Ni and 44Ti we therefore perform a post-processing analysis with a large network, employing tracer-particle information that we extract from our 3D simulations of models W15-2, W15-2-cw, and W15-2-cw-IIb as described in the next section.
2.4 Post-processing of the nucleosynthesis
The post-processing for nucleosynthetic yields is performed with a nuclear reaction network of 6300 nuclear species between the proton-drip line and the neutron-drip line, reaching up to the = 110 isotopes, as described in Wanajo (2006). The latest reaction library of REACLIB V2.0 (Cyburt et al., 2010) is employed, in which experimentally evaluated values are adopted whenever available. We also test a possible uncertainty of the most influential reaction for 44Ti production, 44Ti(, )47V, by dividing the forward and inverse rates in REACLIB V2.0 by a factor of two, according to the new experimental evaluation in Margerin et al. (2014). Using the hydrodynamical trajectories described below, nucleosynthesis calculations are started when the temperature decreases to K, assuming initially free protons and neutrons with mass fractions and , respectively. Nuclear statistical equilibrium is immediately established at such high temperature, and the detailed initial composition is unimportant. For the tracer-particle trajectories with maximum temperatures below K, the calculations are started from the beginning of the hydrodynamic simulation (i.e., shortly after core bounce) with the composition of the pre-SN model.
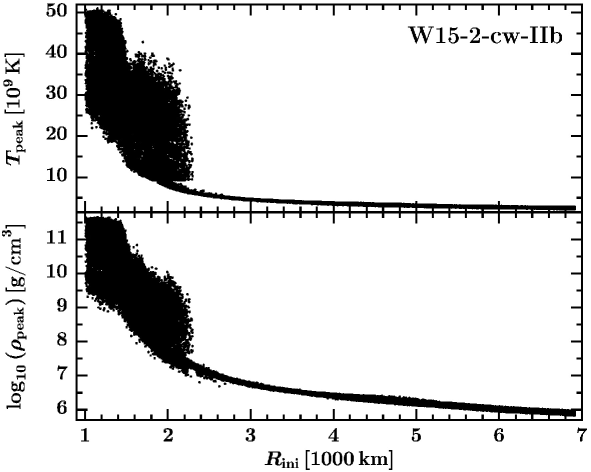
A total number of 131,072 tracer particles is initially (i.e., some 15 milliseconds after core bounce) placed between 1000 km and 6900 km, covering the entire Si-layer and the inner shells of the O-layer, corresponding to a mass resolution of M⊙. This setting is suitable to probe the whole volume where 56Ni (iron-group material) and 44Ti are nucleosynthesized during the explosion (the corresponding peak temperatures and peak densities are shown in Fig. 2). It is important to note that we do not co-evolve the tracer particles with the hydrodynamic simulation but use the data files stored from the 3D hydrodynamics run to construct the tracer histories only after the simulation. This is achieved by a 4th order Runge-Kutta time integrator for the particle trajectories. Linear interpolation of the velocity field is used to obtain velocities at the spatial positions of the particles. The data of our simulation are stored every 100 hydrodynamics time steps. These time intervals between hydrodynamics outputs are further divided into 10 substeps, and the velocity field at the intermediate steps is obtained by linear interpolation in time.
Despite the higher-order time integration, the resolution limitations associated with the discrete time sampling by the data outputs (which is much coarser than the small time steps applied in the simulation) can lead to integration errors of the particle evolution. This problem should be kept in mind and will be a matter of discussion in Sect. 3.2.
The majority of our initial particles, namely 107,910, are ejected, while 23,162 particles fall through the inner grid boundary and are removed from further analysis. We discriminate between two types of nucleosynthesis-relevant ejecta and the corresponding particles. On the one hand, there are shock-heated ejecta, which are immediately accelerated outward by the expanding SN shock. On the other hand, there are neutrino-processed ejecta, which fall inward below 250 km to be affected by electron capture and/or neutrino interactions, which can change the electron fraction, , and the entropy of the plasma. While the shock-heated matter retains the from the pre-collapse conditions, the electron fraction of the neutrino-processed material is reset by the neutrino reactions computed with our gray transport approximation. This implies considerable uncertainties not only because our neutrino transport treatment is approximative, but also, more generally, because the final neutron-to-proton ratio is very sensitive to many details of the neutrino physics, some of which (such as collective neutrino-flavor oscillations and the lepton-emission self-sustained asymmetry, LESA, recently found by Tamborra et al. 2014; for a review, see e.g., Mirizzi et al., 2016) are not yet fully understood.
A subset of 75,862 of the expelled particles can be considered as shock-heated ejecta, and another 27,222 particles represent neutrino-processed ejecta. This corresponds to 0.265 and for the shock-heated and neutrino-processed ejecta, respectively. (A small number of 4826 remaining particles did not produce 44Ti and 56Ni at any significant amounts and therefore is irrelevant for the investigations of this paper.) Because, for the reasons mentioned above, is uncertain in the neutrino-processed ejecta, we will consider two cases for the nucleosynthetic post-processing of the corresponding particles in order to test the sensitivity of the nucleosynthesis to : 1) We adopt as obtained in our 3D simulations with the approximative neutrino treatment at a temperature of K in outflowing material. The 3D long-time simulation with the corresponding post-processing results for nucleosynthesis will be denoted as W15-2-cw-IIb-Yesim. 2) Alternatively, we assume that all of the SN ejecta, also the neutrino-heated ones, inherit their values directly from the progenitor, i.e., we take the data from the progenitor profile, where for pre-collapse radii of 1160 km and enclosed masses larger than 1.287 , while the more neutron-rich deeper layers are accreted into the newly formed neutron star (NS). (The final mass cut is close to 1.35 .)
Typical entropies in the neutrino-heated ejecta at GK range from 10 per nucleon to 30 per nucleon, while the shock-heated material has entropies between 7 and 12 per nucleon during the relevant time of 44Ti and 56Ni nucleosynthesis.
As we will see in Sect. 3.1, the nucleosynthetic yields of 56Ni and, in particular, of 44Ti differ considerably between the two investigated cases. Because of a better match with the Cas A remnant, we will mainly focus on the second case as our preferred and more interesting model, which we term W15-2-cw-IIb.
We have tested the convergence of our post-processing analysis by comparing the yields for our full set of tracer particles with yields estimated on grounds of randomly selected subsets of these particles. We found that typically less than 10% of all particles are sufficient to obtain the produced 44Ti and 56Ni masses with accuracies of better than a few percent. Of course, good representations of the 44Ti and 56Ni distributions in 3D space require the use of significantly more than a few 1000 tracer particles.
| Model | M(44Ti) [M⊙] | M(56Ni) [M⊙] |
|---|---|---|
| W15-2-cw-IIb | ||
| W15-2-cw-IIb-shock | ||
| W15-2-cw-IIb-proc | ||
| W15-2-cw-IIb-Ye | ||
| W15-2-cw-IIb-shock | ||
| W15-2-cw-IIb-proc-Ye |
3 Results
Radioactive nuclei such as 44Ti and 56Ni, which are assembled in the innermost regions of SN explosions, are of great relevance for the diagnostics of the explosion mechanism. Comparisons of 3D model predictions with the NuSTAR map of the spatial 44Ti distribution are particularly interesting, because they allow one to identify morphological peculiarities that are connected to asymmetries of the blast wave during the earliest moments of its outward propagation. The 44Ti distribution can therefore provide extremely valuable information on the working of the central engine that initiates and powers the SN explosion. It is also important to investigate whether our model could, at least in principle, produce a 44Ti yield compatible with the large mass of this nucleus inferred from NuSTAR and INTEGRAL in the case of Cas A.
Once again we emphasize that our 3D explosion model was selected as one case from the model set of Wongwathanarat et al. (2013, 2015) but was not fine tuned to match the progenitor and explosion properties of Cas A. It is also important to repeat that the explosion geometry did not emerge from predefined or artificially imposed asymmetries but developed purely stochastically by the growth of hydrodynamic instabilities from small, random initial perturbations in the neutrino-heating layer (see Sect. 2.2).
3.1 Production of 44Ti and 56Ni
Figure 2 shows the peak temperature and peak density versus “initial” (post-bounce) radius, , of all particles that contribute to the production of 44Ti and 56Ni. Shock-heated and neutrino-processed ejecta can be well distinguished. The shock-heated particles reach GK and g cm-3 and align in rather narrow stripes of temperature and density values as functions of initial radius, because the shock front is only moderately aspherical. The neutrino-processed ejecta form clusters of higher and at post-bounce radii of less than 2200 km. While most of these particles are neutrino-heated to temperatures up to about 40 GK in the convective flows within the postshock layer (peak densities g cm-3), some of this matter (starting from smaller km and reaching to even more extreme peak values of density and temperature) is accreted onto the nascent neutron star before being blown out again in the neutrino-driven wind.
The electron fraction in the neutrino-processed ejecta, which is set by the competition of and absorption and emission processes, sensitively determines the efficiency of producing 44Ti and 56Ni. For this reason the yields of both nuclei differ strongly between the two considered cases, namely model W15-2-cw-IIb, where, for a sensitivity test, we adopt the electron fraction, , from the progenitor conditions, compared to model W15-2-cw-IIb-Yesim, where we take from our 3D simulations with approximative neutrino transport. In the latter case, is shifted slightly to the neutron-rich side (values at K lie in the range between 0.456 and 0.498), which strongly suppresses the creation of both 44Ti and 56Ni as discussed by Magkotsios et al. (2010), where the theoretical framework of the production of these radioactive isotopes was depicted in great detail. As the 44Ti yield becomes maximal at with other conditions fixed (Wanajo et al., 2013), our two investigated cases roughly bracket the upper and lower limits of the 44Ti production in our model.
Table 1 lists the total yields of models W15-2-cw-IIb and W15-2-cw-IIb-Yesim as well as the individual contributions from shock-heated and neutrino-processed material in both cases, all obtained by the nucleosynthetic post-processing of our tracer particles. In model W15-2-cw-IIb-Yesim the shock-heated ejecta component (indicated by the model-name extension “shock”) dominates the expelled mass of 56Ni by far, whereas both ejecta components contribute roughly equally to the making of 44Ti. In model W15-2-cw-IIb roughly 95% of the 44Ti and about 56% of the 56Ni are assembled in the neutrino-processed ejecta (model-name extension “proc”), where is essentially 0.5. Effectively, this means that model W15-2-cw-IIb produces more than twice as much 56Ni as W15-2-cw-IIb-Yesim (0.096 compared to 0.043 ) and 10 times more 44Ti ( compared to ).
We note in passing that the calculations with the small -network that we employ during the hydrodynamic simulations, massively overestimate the yield of 44Ti, whereas they produce 56Ni in the same ballpark as the tracer-particle based post-processing with the large nuclear network reported above. Table 3 of Wongwathanarat et al. (2013) lists nearly of 44Ti and 0.055–0.139 of 56Ni, depending on the undetermined contribution of this nucleus in the neutrino-processed ejecta, for model W15-2.
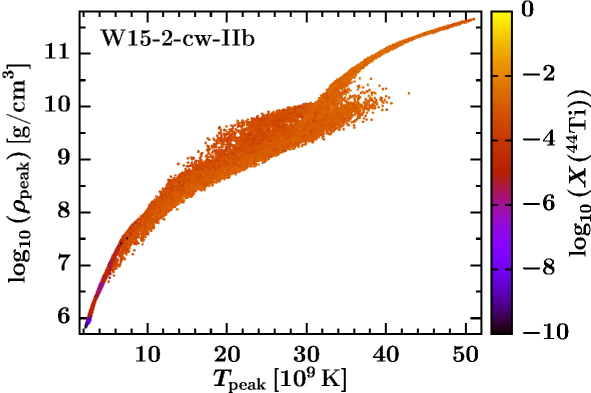
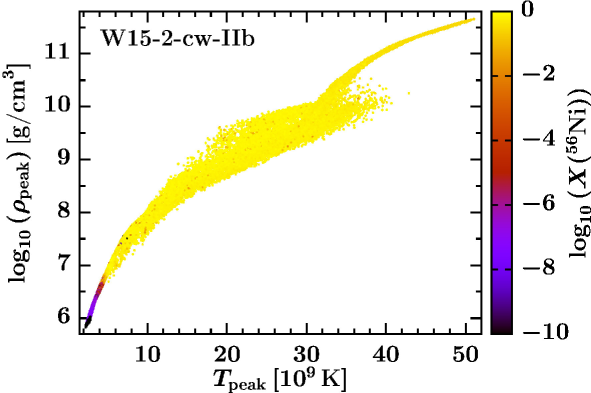
By far most of the 44Ti and 56Ni are assembled under -rich freeze-out conditions, which are experienced by most of the relevant shock-heated and neutrino-heated ejecta, and where the mass fractions of these nuclei reach their highest values. Only subdominant contributions originate from regions of incomplete Si burning (in line with conclusions drawn by Woosley & Hoffman (1991) and Magkotsios et al. (2010). This can be concluded from the plots of Fig. 3, which show color coded mass fractions of 44Ti (left) and 56Ni (right) for all tracer particles of model W15-2-cw-IIb in the peak temperature-peak density plane. The two images should be viewed in relation to figure 4 of Magkotsios et al. (2010). All of the expelled matter with K crosses the -particle-rich freeze-out region when it expands and cools during ejection, and only a small amount of 44Ti and 56Ni is produced by incomplete Si-burning in matter with K. The banana-shaped cluster of particles between peak densities of about g cm-3 and g cm-3 corresponds to neutrino-heated matter in the convective layer between gain radius and SN shock, while the antenna-like narrow extension toward higher densities and temperatures is matter that has transiently been accreted into the outer layers of the proto-neutron star before it was blown out in the neutrino-driven wind later. The mass ratio of 44Ca/56Fe as stable daughter nuclei of 44Ti and 56Ni in our model W15-2-cw-IIb is and thus compatible with the solar ratio of these elements ( Lodders, 2003), while our less favorable case, model W15-2-cw-IIb-Yesim, accounts for a production of only about 1/3 of the solar 44Ca/56Fe value.
All tracer particles that contribute to the creation of significant amounts of 44Ti and 56Ni are ejected (i.e., accelerated outwards) during the first second of the explosion. In our 3D neutrino-driven explosion model the far dominant part of the ejected 44Ti originates from the neutrino-heated, high-entropy postshock layer, whose mass depends on the multi-dimensional processes that drive nonradial flows in this region. More plasma is channeled through the region of neutrino-matter interactions by such flows than typically experiencing neutrino-heating in corresponding 1D explosion models. Moreover, the nucleosynthesis of 44Ti is extremely sensitive to the neutron-to-proton ratio and entropy in the -processed matter. Spherically symmetric models of neutrino-powered explosions are certainly not able to capture the dynamics of this layer reliably. For example, in our attempts to perform quantitative comparisons of 1D and 3D simulations by varying the parameters that determine the strength of the explosion-driving neutrino source, we found that it is hardly possible to reproduce the shock acceleration and the growth of the explosion energy of our 3D model simultaneously by 1D explosions. The yield of 44Ti hinges critically on all characteristic properties (i.e., mass, , entropy, and expansion velocity) of the ejecta that emerge from the region where the mass cut between compact remnant and SN outflow develops. For this reason 1D models are not qualified to adequately address the problem of 44Ti production in SNe. This, in particular, also applies to SN calculations invoking pistons or thermal bombs for initiating the explosions. Both methods are unable to accurately describe the dynamics, thermodynamics, and electron fraction of matter expelled from the vicinity of the mass cut.
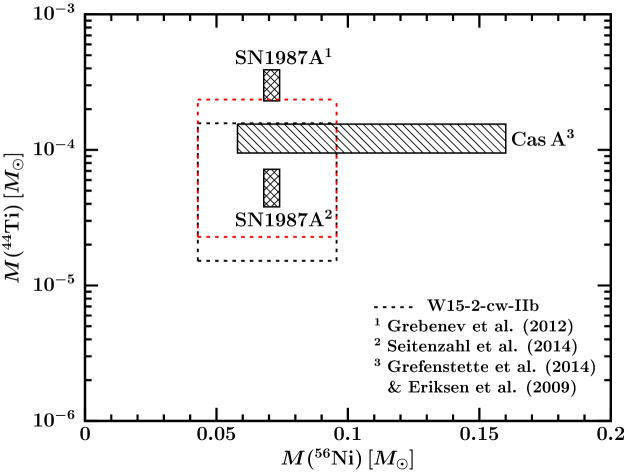
It is therefore not astonishing that 3D neutrino-driven explosions can potentially produce much more 44Ti than prediced by piston-initiated explosions (as already surmised by Woosley & Hoffman, 1991), where this isotope is only made in the shock-heated ejecta, which contribute to our 44Ti yield only on the 10% level. Our results also demonstrate that large global asymmetries, e.g. by rapid rotation or even jet-driven (magnetohydrodynamic) explosions (Nagataki et al., 1998), are not needed to explain the 44Ti masses observed in Cas A and SN 1987A. The yield of our model W15-3D-cw-IIb is compatible with both observations (see Fig. 4),222Results for observational estimates of the ejected 44Ti masses in the same ballpark as those plotted in Fig. 4 were reported for SN 1987A by Jerkstrand et al. (2011) () and Boggs et al. (2015) () and for Cas A by Siegert et al. (2015) (), Wang & Li (2016) (), and Grefenstette et al. (2017) (). in particular if we account for uncertainties in the important nuclear reaction rate of the 44TiV process. Reducing this rate by a factor of two according to the new experimental value of Margerin et al. (2014) boosts the 44Ti production by a factor of 1.5 compared to the values listed in Table 1. We did not attempt to regulate the explosion energy of our 3D model for a precise match of the observations. Its value of nearly 1.5 B is close to the one estimated for SN 1987A (around 1.5 B; Utrobin, 2005) and only slightly smaller than that of Cas A (roughly 2.3 B; Laming & Hwang, 2003; Orlando et al., 2016, and references therein). Despite this energy difference both SNe seem to have produced 44Ti yields in the same ballpark (Fig. 4), although the SN 1987A value is not determined very accurately and there is considerable tension between the results obtained from X-ray emission-line measurements (Grebenev et al., 2012; Boggs et al., 2015), late-time spectral analysis (Jerkstrand et al., 2011), and late-time light-curve fitting (Seitenzahl et al., 2014).
Neutrino-driven explosions genericly eject large amounts of matter with sufficiently high entropies (between 10 and 30 per nucleon) to enable an effective production of 44Ti, and therefore they can potentially produce considerable yields of this nucleus. The reason is that the explosion energy is carried by matter that must be heated to the point of marginal gravitational binding in the strong field of the new-born NS before outward acceleration of the SN shock and of the postshock plasma can set in (for a detailed discussion, see, e.g. Janka, 2001; Scheck et al., 2006). The net energy available to the explosion is then basically provided by the recombination energy of initially free nucleons in the neutrino-heated gas to -particles and heavy nuclei. This releases at most 9 MeV per nucleon, of which under typical conditions 5–7 MeV per nucleon or (5–7) erg g-1 are available to power the SN blast. For the explosion energy one therefore estimates, very roughly,
| (1) |
where is the mass of neutrino-heated material, and the negative gravitational binding energy of the overlying stellar layers exterior to the SN shock as well as positive energy contributions by explosive nuclear burning of shock-heated ejecta are not taken into account. This expression means that for a net explosion energy of 1 erg, at least 0.1 of neutrino-heated matter must be expelled.
Our results for models W15-2-cw-IIb and W15-2-2cw-IIb-Yesim, however, demonstrate that the actual mass of 44Ti produced in the explosion can vary strongly, depending on the exact value of in the neutrino-processed ejecta. A reliable determination of the neutron excess requires a more sophisticated treatment of the neutrino transport than applied in our 3D simulations and, moreover, is sensitive to aspects that are uncertain or hard to control with high accuracy. Therefore, since predictions of with a precision of a few percent are extremely difficult, we do not want to put overly much weight on the elemental yields but, instead, focus on the distributions of 44Ti and 56Ni as functions of enclosed mass, radial velocity and spatial coordinates in the following.
3.2 Distribution in radial velocity space
Hydrodynamic instabilities during the neutrino-heating phase determine the overall asphericity of the explosion and the directional asymmetries of the nucleosynthetic ejecta. The initial structures begin to freeze out at the time when the outward acceleration of the SN shock marks the onset of the explosion. The final morphology of the SN blast and the velocity distributions of the chemical elements, however, depend strongly not only on this initial explosion asymmetry but also on the structure of the progenitor star. The latter has an important influence because the outgoing shock accelerates or decelerates when travelling through the different composition shells, depending on whether the density profile is steeper or flatter than . Deceleration after the shock has passed a composition-shell interface leads to compression of the postshock matter into a dense shell and the formation of a reverse shock that moves backward into the SN ejecta and slows down the expanding flow. Moreover, in regions of crossing pressure and density gradients the growth of RT and Richtmyer-Meshkov instabilities is seeded by the shock asphericity, preexisting perturbations in the progenitor, and, most importantly, by the primary explosion asymmetries in the innermost SN ejecta. The secondary instabilities thus enhance the mixing between layers of different chemical composition and cause a fragmentation of the initially large, metal-rich plumes and clumps to smaller, more filamentary structures as discussed in detail for 3D SN simulations of different red and blue supergiant progenitors including W15-2 by Wongwathanarat et al. (2015).
The size of such effects, in particular the efficiency of the metal penetration into the hydrogen envelope and the corresponding fragmentation of the mixed layer, depend on the shock velocity after the shock has crossed the C-O core, the shock deceleration in the He-layer, and the density gradient at the He/H interface. In red supergiants the shock accelerates strongly at a steep density decline between the He- and H-shells and experiences a similarly dramatic subsequent deceleration when travelling through the extended hydrogen envelope. This leads to large growth rates of the RT instability at the shell interface and therefore efficient metal and helium mixing into the hydrogen envelope. In blue supergiants the density gradient at the He/H boundary is less pronounced, the shock acceleration at this location is therefore far more moderate, and the shock deceleration in the more compact H-envelope less extreme. Because the RT growth rates at the He/H transition are smaller, the intrusion of metals into the hydrogen envelope is impeded, unless the fastest metal plumes stay in close touch with the outgoing shock and thus can enter the hydrogen envelope before they experience significant deceleration by interaction with the reverse shock and with a dense “helium wall” that builds up from decelerated helium. If such a situation holds, extended metal-enriched fingers can reach with high velocities deep into the surrounding hydrogen also in the case of blue supergiants (see Wongwathanarat et al., 2015).
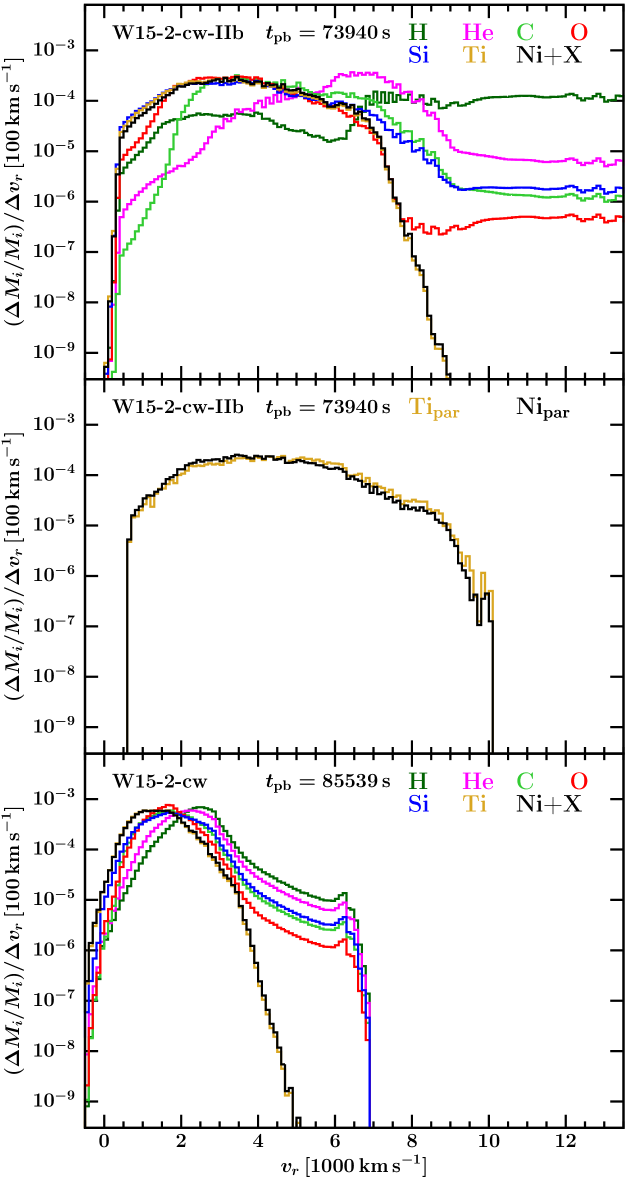
These results demonstrate that the presence of the hydrogen envelope in Type-IIP supernovae has important consequences for the final velocities and the mixing and fragmentation of the distribution of metal-containing ejecta. In Fig. 5 we present the mass distributions as functions of the radial velocity for a set of nucleosynthesis components for model W15-2-cw at the time of shock breakout (bottom panel; data from figure 12 of Wongwathanarat et al., 2015) compared to results of our present simulation of model W15-2-cw-IIb, i.e., after having removed the hydrogen envelope except for a relic mass of 0.3 .
In model W15-2-cw the mass distributions of 56Ni and 44Ti reach up to about 5000 km s-1 for a small faction of this radioactive material, which indicates the extent of mixing in velocity space. The overall shapes of the distributions of all elements (iron-group, intermediate-mass, and light elements) resemble each other, with the bulk ejecta velocities ranging from 1000 km s-1 to 3000 km s-1, and the maxima as well as the positive slopes below the maxima exhibiting the order expected from homologous expansion () of spherically symmetric explosions, where lighter elements reside at larger radii with higher velocities. The tails of the fastest ejecta above the distribution maxima stretch out to roughly 7000 km s-1 and contain, besides hydrogen and helium, also intermediate and light elements (silicon to carbon) corresponding to the chemical composition of the progenitor envelope.
For a given explosion energy , the average velocity of the ejecta (mass ) is approximately given by , and also the maximum ejecta velocity (ignoring a small amount of mass accelerated off the stellar surface at shock breakout) follows roughly the scaling with the ratio . Our red supergiant model W15-2-cw (B, ) yields B/, corresponding to km s-1. Without the decelerating influence of the massive hydrogen envelope, model W15-2-cw-IIb possesses a higher value of B/, for which reason one expects about twice the ejecta velocities of the red supergiant model.
Indeed, the main ejecta mass (helium for W15-2-cw-IIb) exhibits velocities around 6000–8000 km s-1, and small amounts of material expand with more than 10,000 km s-1 (Fig. 5, top panel). The mass distributions of different elements are much more dissimilar in model W15-2-cw-IIb than in model W15-2-cw. This suggests considerably less mixing, fully in line with the absence of a reverse shock and RT unstable conditions at the He/H interface. Hydrogen and helium naturally show the tendency of having the highest velocities for the bulk of their mass, followed by carbon and silicon, whereas the dominant masses of oxygen, titanium, and nickel are distributed in a broad maximum below 7000 km s-1. Only minor fractions of the radioactive elements (of order 1% of the total 44Ti and 56Ni mass) are contained in high-velocity tails that extend from 7000 km s-1 up to 9000 km s-1.
The highest velocities of significant amounts of 44Ti (around 7000 km s-1) in our simulations are in good agreement with the upper bound on the fastest such material determined by Cas A observations ( km s-1, Grefenstette et al. 2014; km s-1, Grefenstette et al. 2017).333Knot 20b, the fastest and brightest (biggest) structure in the 3D 44Ti distribution analysed by Grefenstette et al. (2017), seems to be blueshifted with a (line-of-sight) velocity of even km s-1, but this component is not indisputably identified as an individual coherent feature, and it is associated only with a single broadened 44Ti line in the NuSTAR bandpass. Besides the question how much dilute, high-velocity 44Ti might be present above this velocity range, but hard to detect observationally, our model results need to be considered with some caution, too. First, we remind the reader once again of the fact that we did not attempt to fine tune our simulations for optimal comparison with the observations. Detailed analysis of Cas A suggests an explosion energy of 2.3 B for an ejecta mass of 4 (Vink, 2004; Orlando et al., 2016), which implies a value of B/. Therefore an optimal Cas A model might possess bulk and maximum velocities of 44Ti that are even 10–15% higher than in our model W15-2-cw-IIb. However, our simulations currently track the evolution of the SN explosion only for the first day. Although the ejecta are already close to homology at this time, our models ignore important future effects such as the heating associated with radioactive decays and the deceleration of the fastest 44Ti by the reverse shock that originates from the interaction of the ejecta with the circumstellar environment decades later. The long-time evolution from the first day to the remnant stage as observed at the present epoch will be the subject of future studies, for which reason we postpone a more detailed quantitative comparison of the velocity information with Cas A observations to a later stage.
The middle panel of Fig. 5 displays the mass distributions in velocity space for 44Ti and 56Ni as obtained by our post-processing of tracer particles with a large nucleosynthesis network (as described in Sect. 2.4), in contrast to the top and bottom panels of this Figure, where results from hydrodynamic simulations with the small nucleosynthesis network are presented. While the distributions for model W15-2-cw-IIb in the top and middle panels look roughly similar for the bulk of the radioactive material, they nevertheless exhibit an important difference: the tracer particle distributions possess a considerably more populated high-velocity tail, which also reaches up to higher velocities. While the hydrodynamic simulation of model W15-2-cw-IIb with the small network yields 1% of the ejected 44Ti and 56Ni with velocities of more than 7000 km s-1, the tracer particle analysis predicts such a small fraction of the radioactive nuclei to be faster than 8500 km s-1, a tiny amount to be ejected with velocities up to 9700 km s-1 instead of 9000 km s-1 for the hydrodynamic run, and some 5 (8) percent of the 56Ni (44Ti) to be expelled with over 7000 km s-1.
Tests showed that this discrepancy is a consequence of numerical inaccuracies in our calculation of the tracer-particle histories. As mentioned in Sect. 2.4, we do not evolve the tracer particles online with the hydrodynamic model but reconstruct the particle velocities and positions by higher-order time integration based on a finite number of output files from the hydrodynamic run. Since these output files are dense in the early phase (the first seconds of the explosion), we do not consider this approach as problematic during the time interval when the nucleosynthesis takes place. Indeed, inspecting the mass distributions versus radial velocity at 10 s, the results of the calculations with small network (during the hydro run) and large network (based on particle post-processing) exhibit much closer similarities with respect to their shape and spread in velocity space, apart from effects that are expected as consequences of nucleosynthesis differences between the approximative -network treatment and the more detailed calculation (for example a shift of the 44Ti production in the latter case to less strongly heated, higher-velocity material instead of a distinctly synchronous production with 56Ni by the small -network). Integrating the particle histories to late times, however, numerical errors accumulate, in particular since data files for the later stages are stored only with larger time intervals.
In spite of this obvious caveat, we will further analyse the nucleosynthesis-related aspects of our results on the basis of the particle information, because only the big-network calculation provides reliable quantitative information on the production of 44Ti and 56Ni for their mutual comparison (though the treatment of the latter is less problematic with the small network, see Sect. 3.1). Yet, we should keep in mind that this implies an overestimation of the abundances of these nuclei in the highest-velocity tails of their late-time distributions. However, since the problem concerns only a small amount of matter (some percent of the total ejected 44Ti and 56Ni masses), it is not of great relevance for our discussion of the spatial asymmetries in Sect. 3.3.
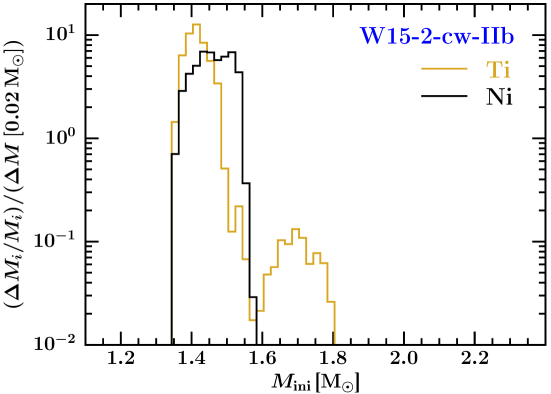
Figure 6 shows the initial and final distributions of the bulk of 44Ti and 56Ni in mass space. The mass coordinate of a tracer particle is defined by the stellar mass contained in a sphere whose radius is given by the particle’s radial position. All of the nickel and the far dominant part of the titanium originate from a mass range between 1.35 and 1.6 in the progenitor star, which encompasses neutrino-processed as well as shock-heated ejecta (left panel of Fig. 6). A small fraction (of order one percent) of the 44Ti is made in matter associated with an initial mass interval from 1.6 to 1.8 , where the outgoing shock raises the peak temperatures to 4– K and allows some 44Ti to be produced during incomplete silicon burning. The dip between the two maxima is connected to a depletion region called the “chasm” by Magkotsios et al. (2010).
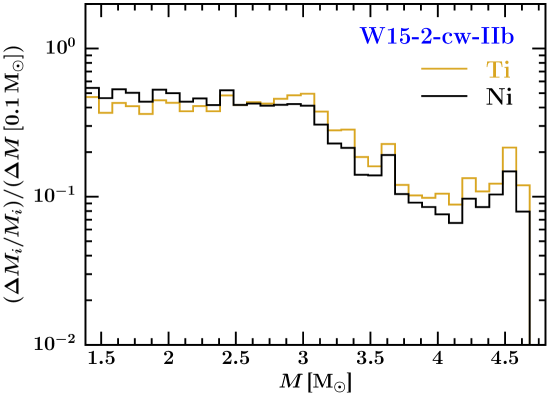
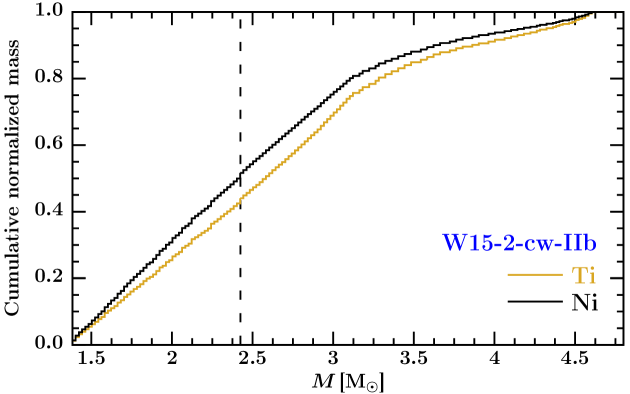
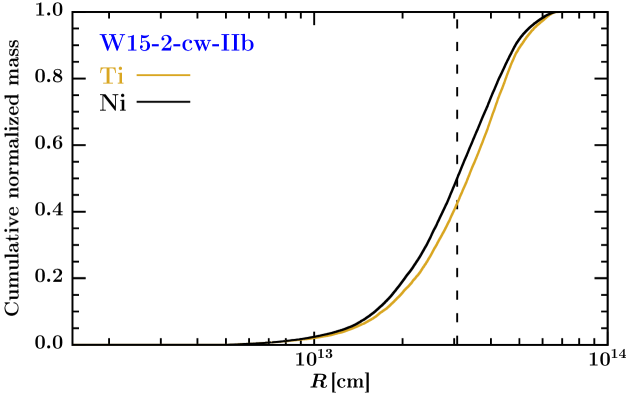
At nearly a day the distributions of 44Ti and 56Ni are smeared over the whole range of ejecta masses, indicating efficient radial transport of the innermost SN ejecta into the carbon-oxygen and helium-layers of the exploding star (right panel of Fig. 6; corresponding cumulative distributions versus radius and enclosed mass are displayed in Fig. 7). While the main formation of nickel and titanium takes place in the same mass region, but with considerable variation of the relative production (left panel), the close similarity of the normalized mass distributions of both radioactive nuclei after one day does not imply that both species are well mixed to equal composition in all regions. As we will see from our analysis of the spatial distributions in Sect. 3.3, there are regions that survive with 44Ti being enhanced relative to 56Ni and vice versa, compared to the average production ratio of the two species.
Finally, we again allude to the fact that the tracer particles with the highest velocities are not very reliable because of integration errors in the particle histories. For the mass distributions in the right panel of Fig. 6, this concerns a subdominant mass of 44Ti and 56Ni accumulating in a local maximum between 4.2 and 4.7 . This feature is absent in our results from the small -network calculation. The peak contains a small fraction (a few percent) of the material that originates from the initial mass interval of 1.35–1.55 . In the case of nickel, both shock-heated and neutrino-heated matter contributes, whereas in the case of titanium the peak is supplied only by tracer particles carrying yields from the far dominant neutrino-processed ejecta component.
3.3 Spatial distributions
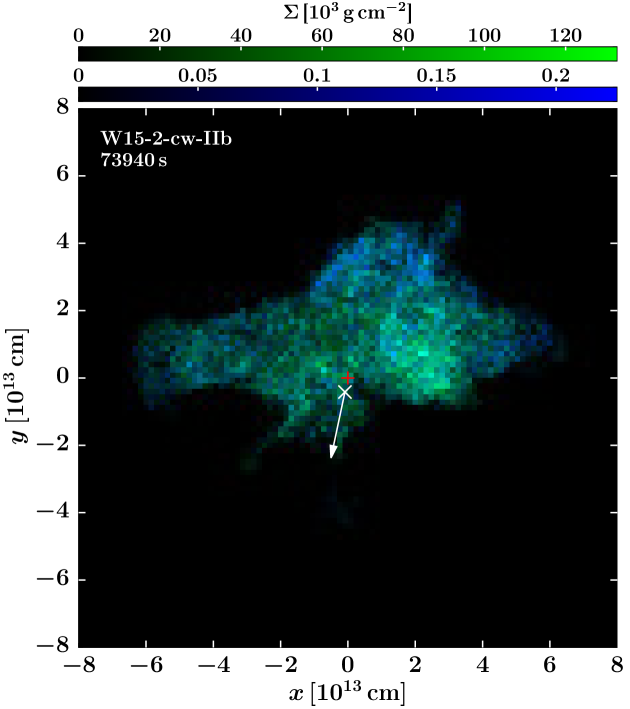
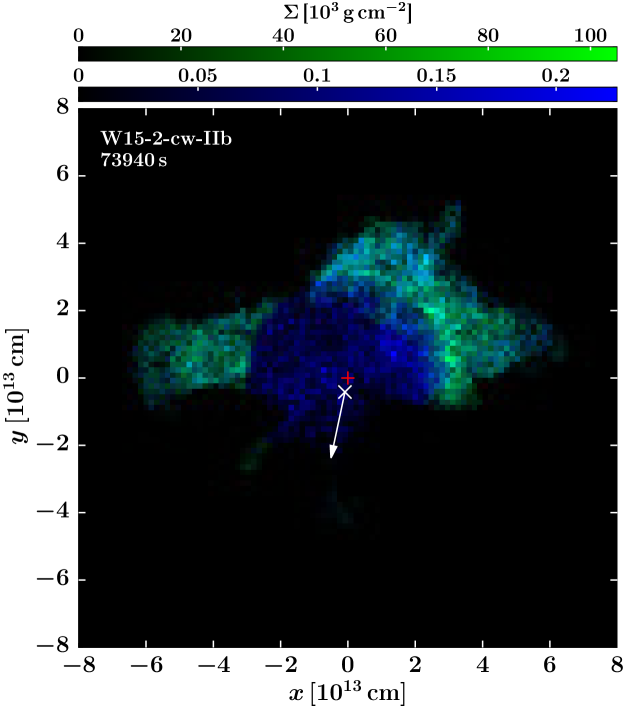
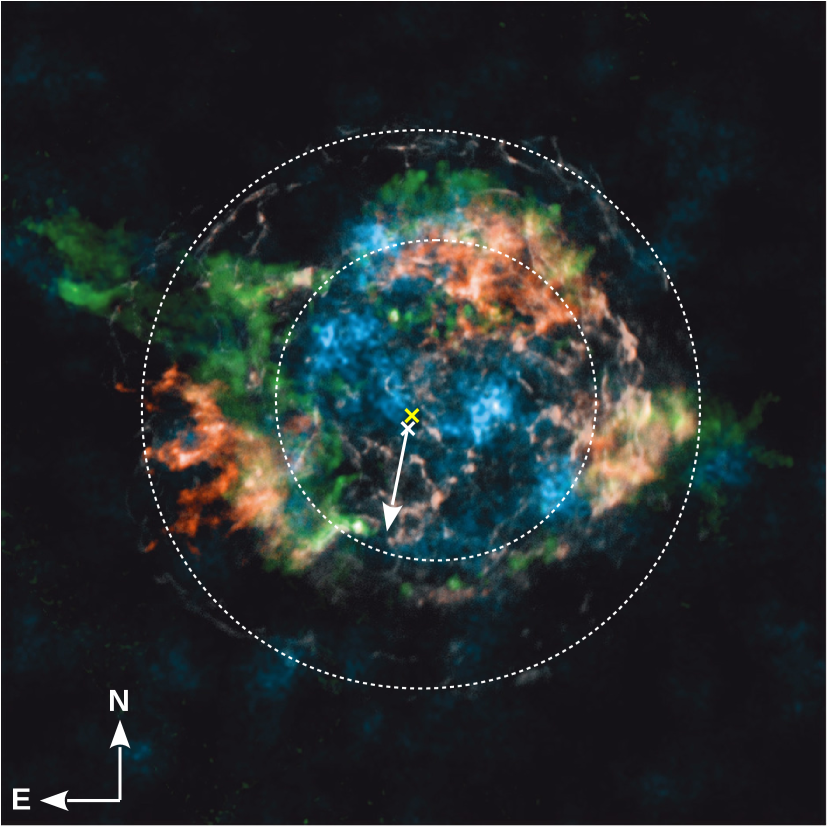
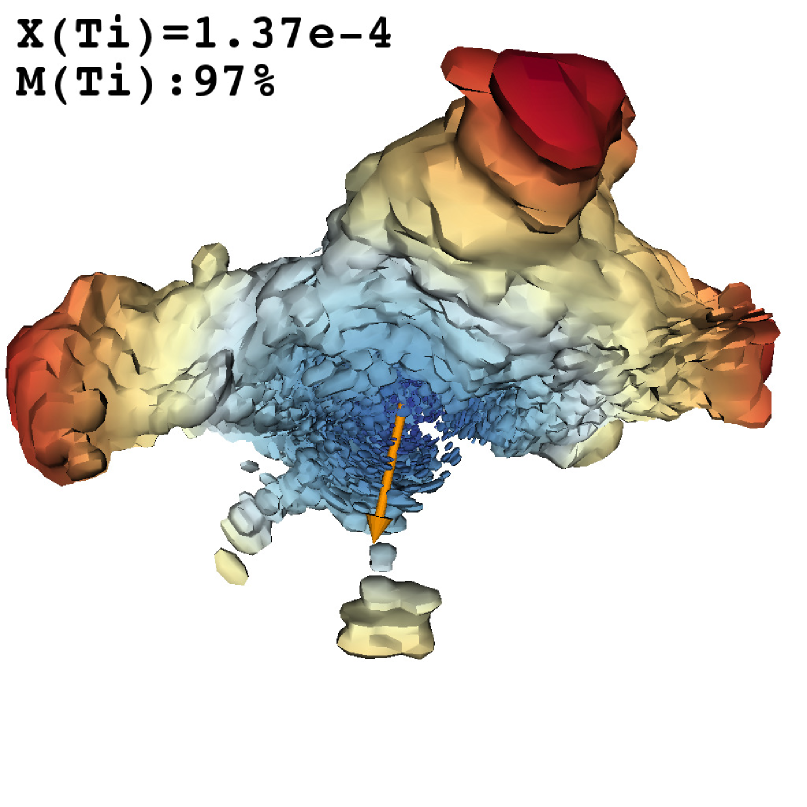
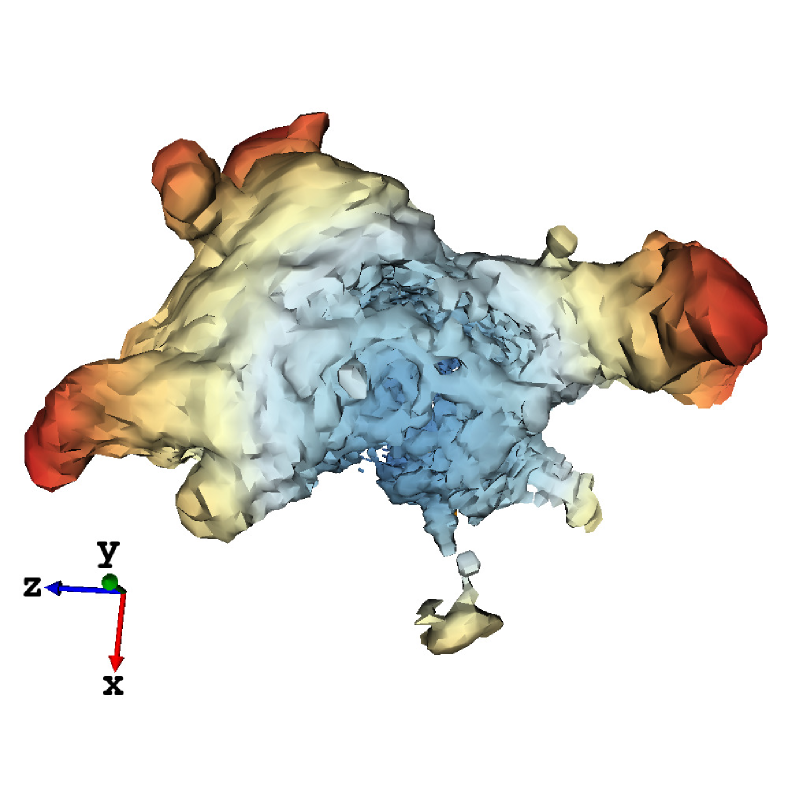
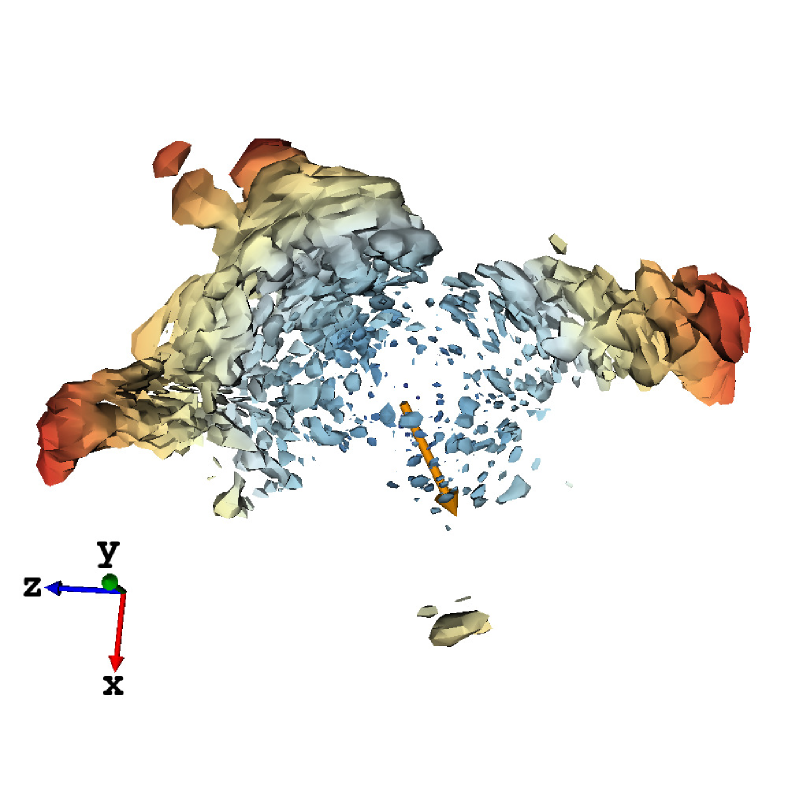
Spatial variations of the abundance mix of 44Ti and 56Ni can be concluded from Fig. 8, where we show column densities of both nuclei as observed from a direction perpendicular to the kick direction of the newly formed NS, which is indicated by a white arrow. The orientation of our image is chosen such that direct comparison with figures 2 and 3 and extended data figure 1 of Grefenstette et al. (2014) (see Fig. 9) is possible and exhibits the closest resemblance that we can achieve. Although nickel and titanium can be found in coexistence in the whole mass-filled volume, the color variations reflect considerable local differences of the abundance ratios of both nuclei, with more intense blue colors signaling relatively higher concentrations of 44Ti, and more intense green picturing higher concentrations of 56Ni.
In the right panel of Fig. 8, we show the nickel ejecta only at large radii but do not display those 50% of the expelled 56Ni mass that are contained in an inner, spherical volume. This is motivated by investigations of the Cas A SNR by Milisavljevic & Fesen (2015) and Orlando et al. (2016), who concluded that about half of the iron produced by the explosion could reside in the central region that has not yet been heated to X-ray emission temperatures by the reverse shock from the ejecta-environment interaction. After 56Ni has decayed to stable 56Fe, ionization by the reverse shock is necessary to enable Fe X-ray emission from atomic transitions. In contrast, 44Ti continues to be radioactive well into the SNR stage, even at the age of Cas A, and therefore radiates X-rays by nuclear transitions. We note that somewhat less than half of the total 44Ti mass (namely roughly 43%) is located within the 50-percent-nickel sphere (Fig. 7), consistent with the fact that the velocity distribution of 44Ti is slightly shifted to higher velocities compared to the 56Ni distribution (see middle panel of Fig. 5).
The overall morphological similarity between the NuSTAR image of Cas A (figure 2 of Grefenstette et al. 2014; 44Ti distribution in Fig. 9) and our model results (Fig. 8) is astounding. We emphasize once more that this similarity is not by construction but by chance, resulting as a consequence of stochastic asymmetries that develop at the origin of the explosion. For this reason the focus here should be on basic properties, not structural details. It is obvious that the NS kick vector points away from the direction in which the highest concentrations of iron-group material and 44Ti are expelled (see also Grefenstette et al., 2017). This is fully in line with the gravitational tug-boat mechanism for NS acceleration in asymmetric SN explosions as discussed by Wongwathanarat et al. (2010b, 2013) and Scheck et al. (2006) (see also Nordhaus et al., 2010, 2012).
This kick mechanism accelerates the NS over time scales of seconds mainly by gravitational forces between the anisotropic and clumpy innermost SN ejecta rather than by direct hydrodynamic interaction. In the context of the neutrino-driven explosion mechanism, which was investigated by 3D SN simulations by Wongwathanarat et al. (2010b, 2013), hydrodynamical instabilities such as convective overturn and the SASI naturally create large-scale asymmetries behind the SN shock in the prelude of the explosion. Due to the aid of these instabilities, neutrino-energy deposition revives the stalled SN shock and initiates its outward expansion anisotropically. In the direction of the more powerful shock acceleration, driven by the largest high-entropy plumes of neutrino-heated matter, more neutrino-processed plasma is expelled and, in addition, stronger shock-heating of the stellar shells swept up by the expanding blast wave allows for more efficient explosive nucleosynthesis. This leads to enhanced production of elements from roughly 28Si to the iron group (and beyond) in the direction of the stronger explosion. The corresponding hemispheric differences in the total yields of these elements can be as large as factors of 3–4 for highly asymmetric explosions, and even greater differences might well be possible for more extreme cases than those obtained in the set of 3D simulations of Wongwathanarat et al. (2013), or for nuclear species not included in their nucleosynthesis treatment with a small -network.
In the direction where the explosion and the nucleosynthesis are weaker, the shock and the postshock material accelerate outward more slowly. On this side the nascent NS can therefore accrete for a longer period of time before the mass infall is quenched by the acceleration of the SN explosion. The momentum transfer both by hydrodynamic accretion flows and by the gravitational attraction from more inert, typically denser and more massive innermost SN ejecta, pulls the NS to the side of the weaker blast wave. Thus the NS receives a kick opposite to the direction of the stronger shock expansion, consistent with momentum conservation during the explosion (for detailed discussions, see Wongwathanarat et al., 2013; Scheck et al., 2006).
This means that the NS experiences a recoil acceleration that points away from the hemisphere where the SN ejects more heavy elements with atomic numbers and higher. The kick velocity of the NS depends on the stochastic explosion asymmetry, the explosion energy, and the density around the newly formed NS (see Janka, 2017). The environmental density of the NS, in turn, depends on the compactness of the progenitor core and determines the amount of matter that is neutrino-processed and shock-heated in the region of explosive nucleosynthesis.
From the set of 3D simulations by Wongwathanarat et al. (2013), model W15-2, which we consider in the present paper, develops a fairly large explosion asymmetry and the NS receives a kick of 575 km s-1 until 3 s after the onset of the SN blast (with acceleration continuing on a low level for even longer time). Information on hemispheric differences of the yields of nuclei included in the -network can be found in Table 3 of Wongwathanarat et al. (2013), and visualizations of the 3D distribution of the ejected nickel (compared to other models) can be found in figures 14 and 15 of that paper. Even for a case with rather high NS kick like model W15-2, radionuclei as nucleosynthesis products in the innermost SN ejecta, where the explosion asymmetry is most extreme, are not just expelled in one hemisphere, but some of this material can be ejected also on the side of the kicked NS. The exact geometry, however, strongly varies from case to case, and lower NS kicks go hand in hand with more isotropic ejection of radioactive material (compare the cases displayed in figures 14 and 15 of Wongwathanarat et al., 2013).
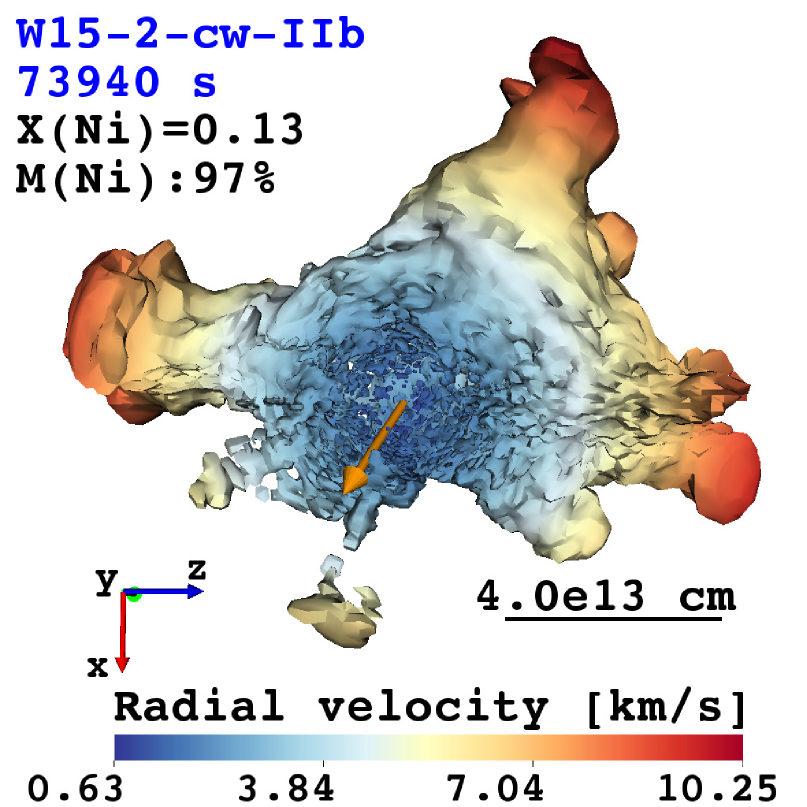
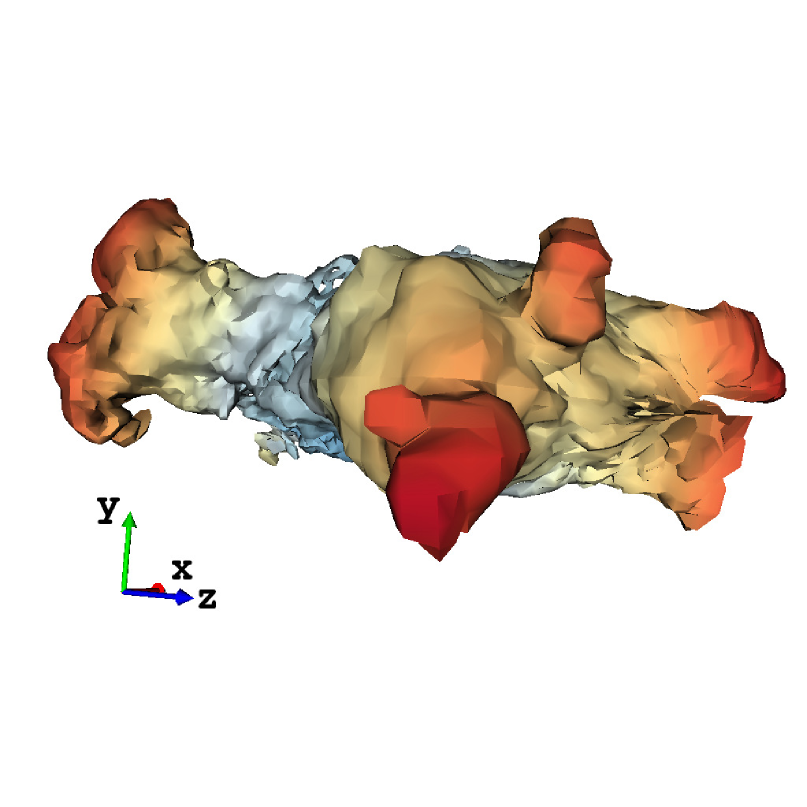
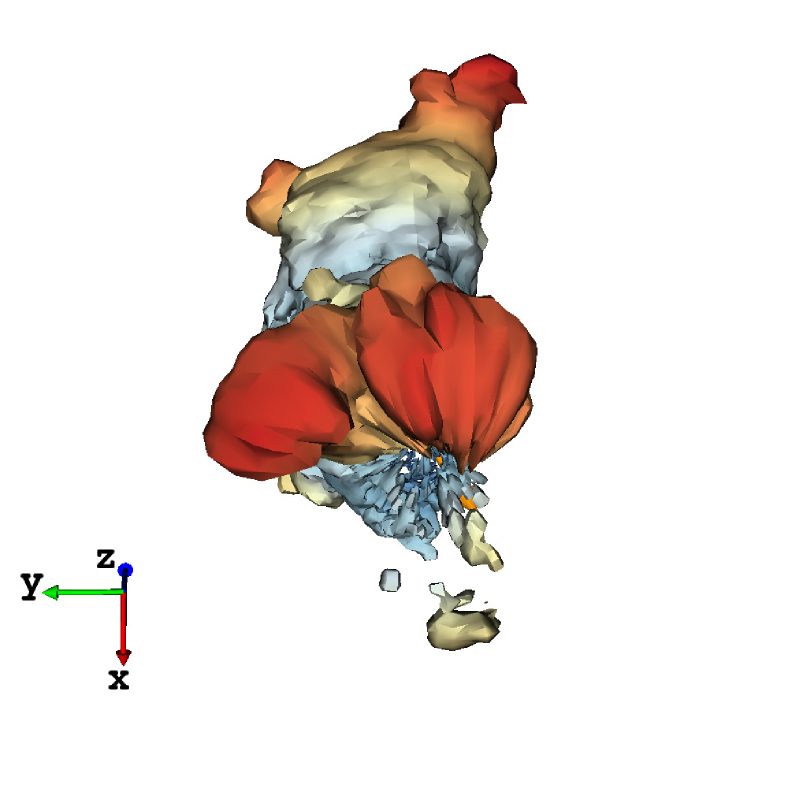
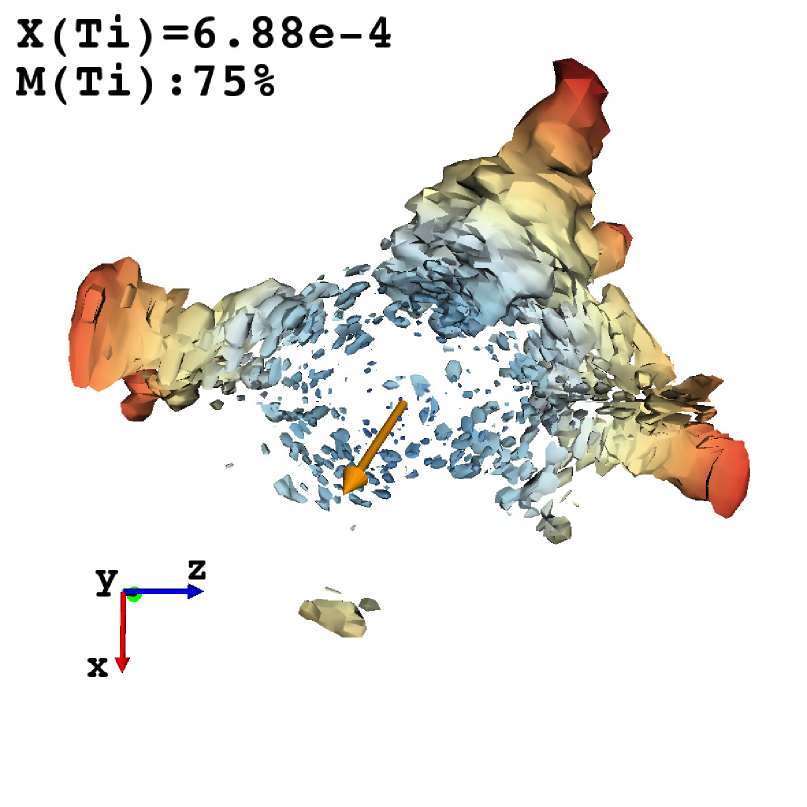
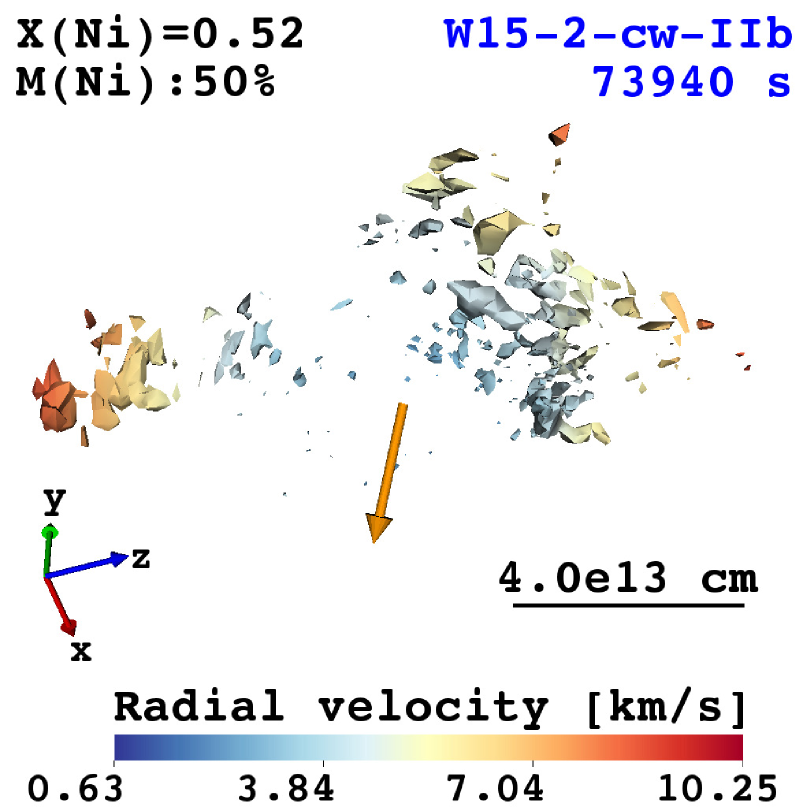
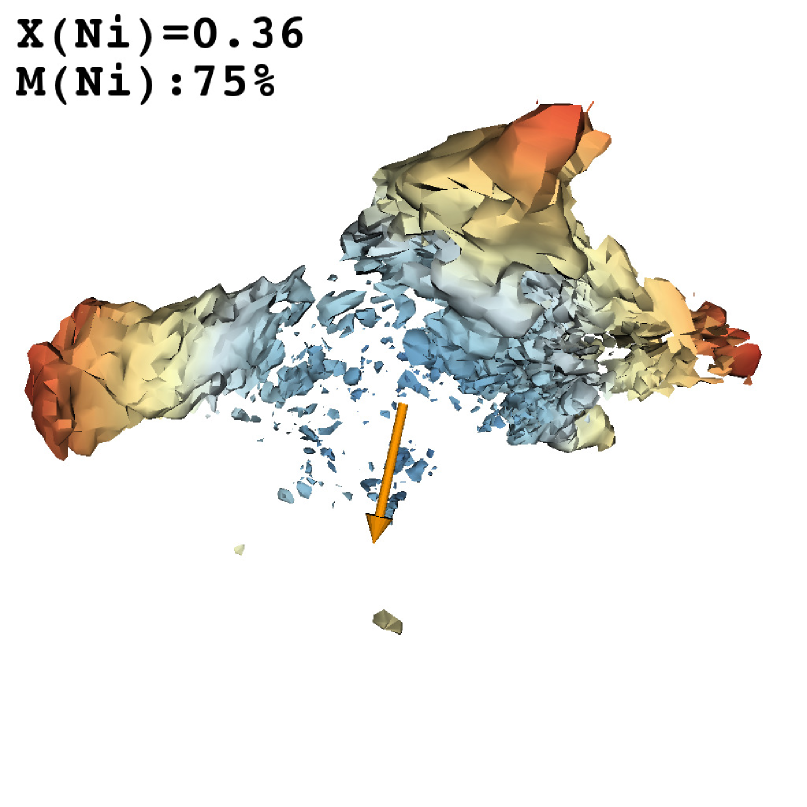
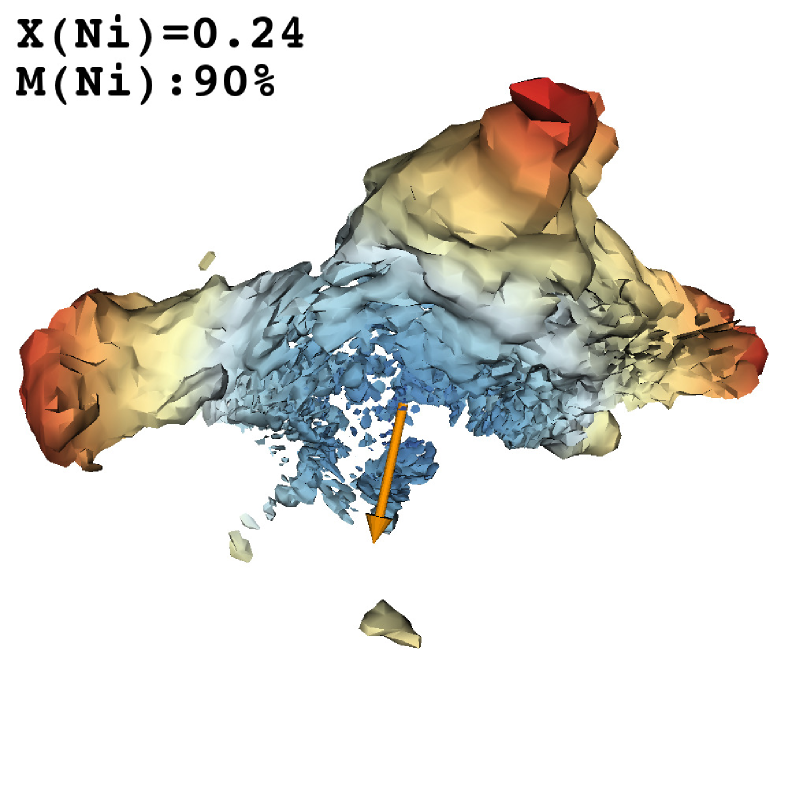
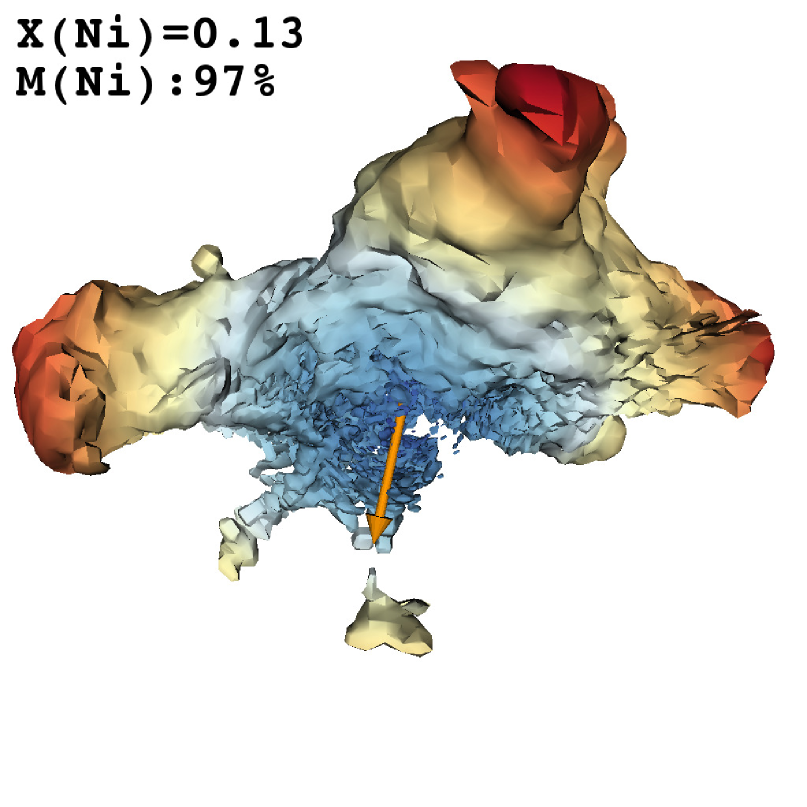
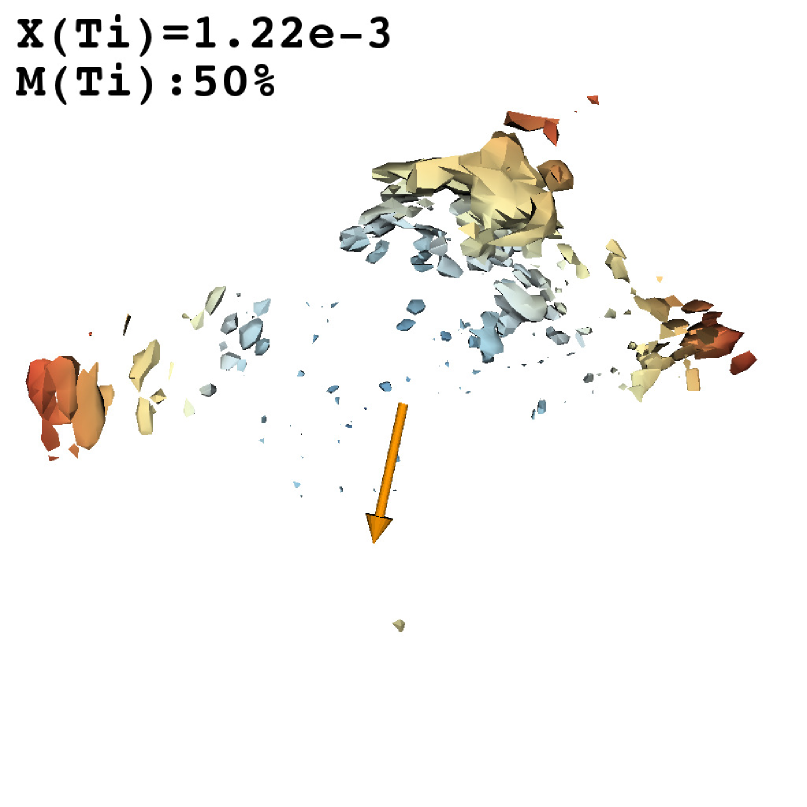
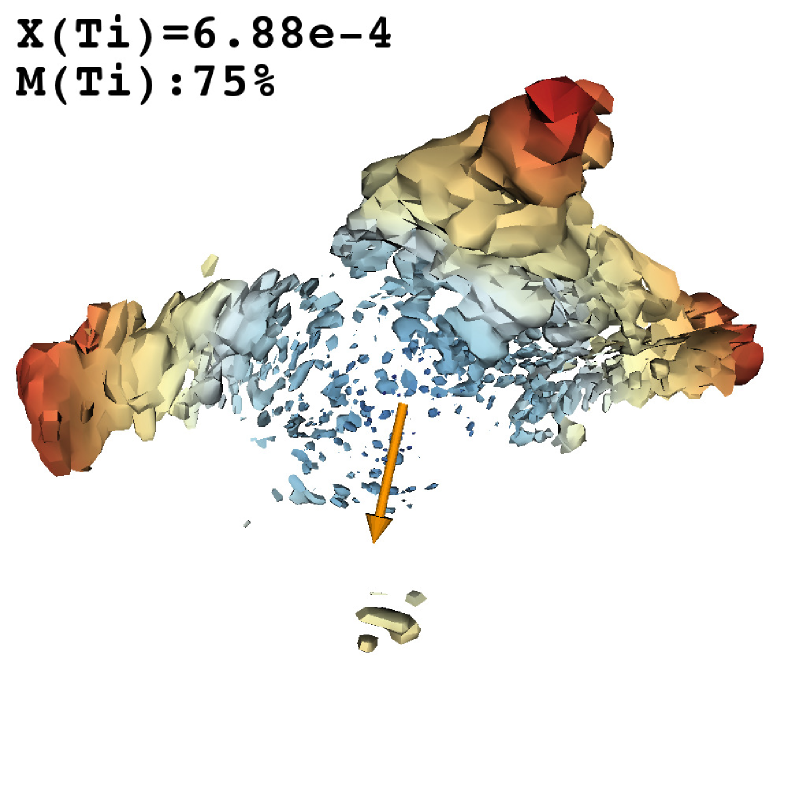
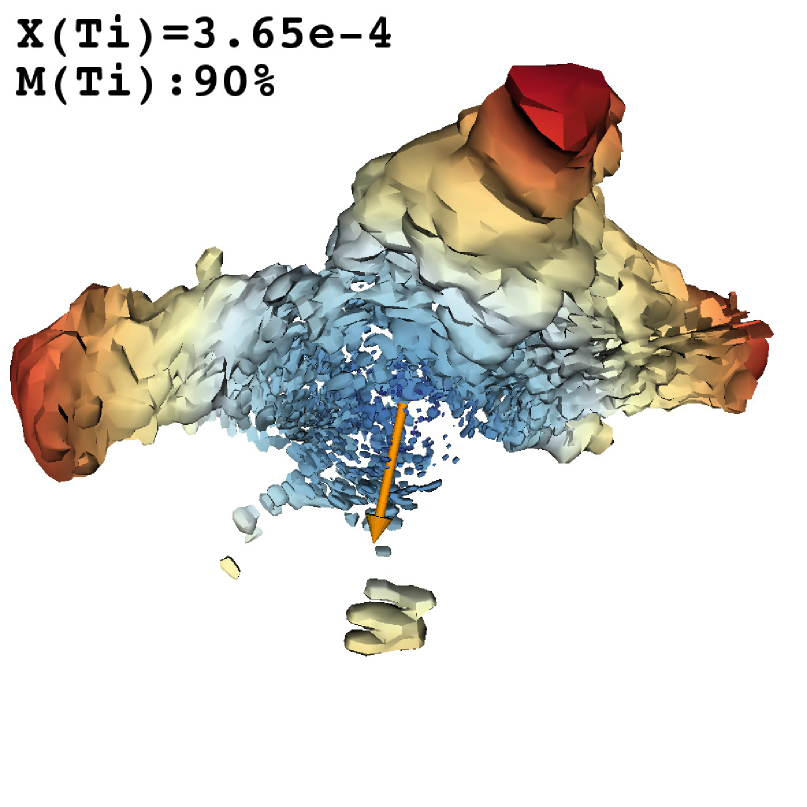
In Fig. 10 we provide a closer comparison of the 3D distributions of 44Ti and 56Ni including volumetric information. The images of this Figure show, for both nuclear species, isosurfaces corresponding to different values of the mass fraction. These isosurfaces were determined such that they enclose 50%, 75%, 90%, and 97% of the total mass ejected of the considered nucleus.
The plots confirm our previous conclusions drawn on the basis of the mass distributions in velocity space (Sect. 3.2): since 44Ti and 56Ni are nucleosynthesized in close spatial proximity in regions of (incomplete) silicon burning and the -particle-rich freeze-out (Sect. 3.1), they are expelled in close connection and there is no process at work that could decouple or decompose them in the ejecta. Their distributions therefore closely resemble each other and the two nuclei, overall, trace the same 3D geometry.
The bulk of the nickel and titanium is concentrated in relatively small, highly enriched clumps and knots that contain half of the ejecta masses of these nuclei (see left panels of Fig. 10). The majority of these clumps expands away from the center of the explosion in the hemisphere opposite to the direction of the NS motion. A close inspection of the two left panels in comparison reveals that the lumps containing 50% of the ejected 44Ti are considerably more extended than those of 56Ni, meaning that titanium is clearly more diluted. Moreover, one can find regions of high 56Ni concentration and little 44Ti and vice versa. Note that all of the clumps with radial velocities of 4000 km s-1 (blue and light blue colors) in the left two columns of Fig. 10 are located within the volume of the inner sphere that is assumed not to be reverse-shock heated in the right panel of Fig. 8. The radius of this sphere is about half the distance from the center to the outermost tips of the largest Ni and Ti fingers. The maximum velocities of titanium in this inner, unshocked sphere are in the ballpark of the fastest material seen by NuSTAR (Grefenstette et al., 2014). Our model suggests that a considerable amount of 44Ti should exist in Cas A with higher velocities outside of the reverse-shock radius, which is in line with the 3D data published recently by Grefenstette et al. (2017).
The isosurfaces enclosing 90% and 97% of the ejecta masses for the two nuclei (right two columns in Fig. 10) exhibit differences only in details. One example is a larger nickel feature at the 3:30 o’clock position (i.e., right of the root point of the kick vector) that contains little titanium. This feature is even better visible in the second column of Fig. 10. Another example are the tips of the most extended, longest finger-like structures, which are more inflated and show higher velocities for titanium. Indications of this trend can already be observed in the images of the left and second columns.
The series of plots in both rows also show significant amounts of low-velocity radionuclei distributed more homogeneously and in a more dilute, volume-filling manner in the central part of the 3D structure formed by the 44Ti and 56Ni ejecta. Again, most of this material expands away from the center in the hemisphere pointing opposite to the NS kick. A major exception is the big feature between the six o’clock direction and the 9:30 o’clock direction, which mostly shares the same hemisphere with the NS kick-velocity vector. One might diagnose a more knotty 44Ti NuSTAR map instead of the more homogeneous distribution of titanium with radial velocities of 4000 km s-1. Note, however, that our simulations do not account for the long-time effects of radioactive decay heating of nickel and titanium, which might have an influence on porosity and clumping in the titanium distribution 340 years later.
3.4 Comparison with 3D observational data
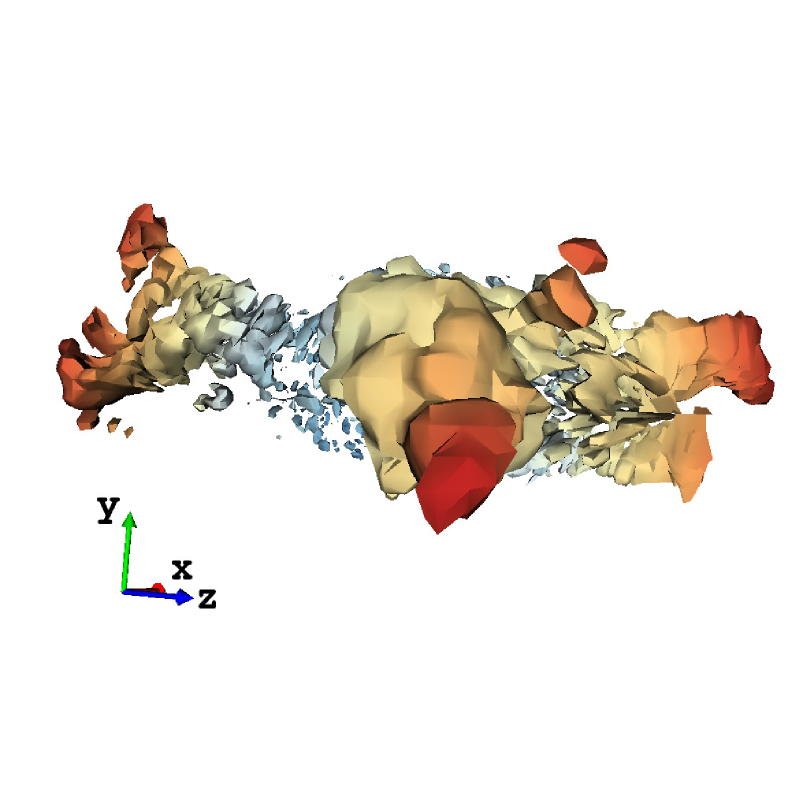
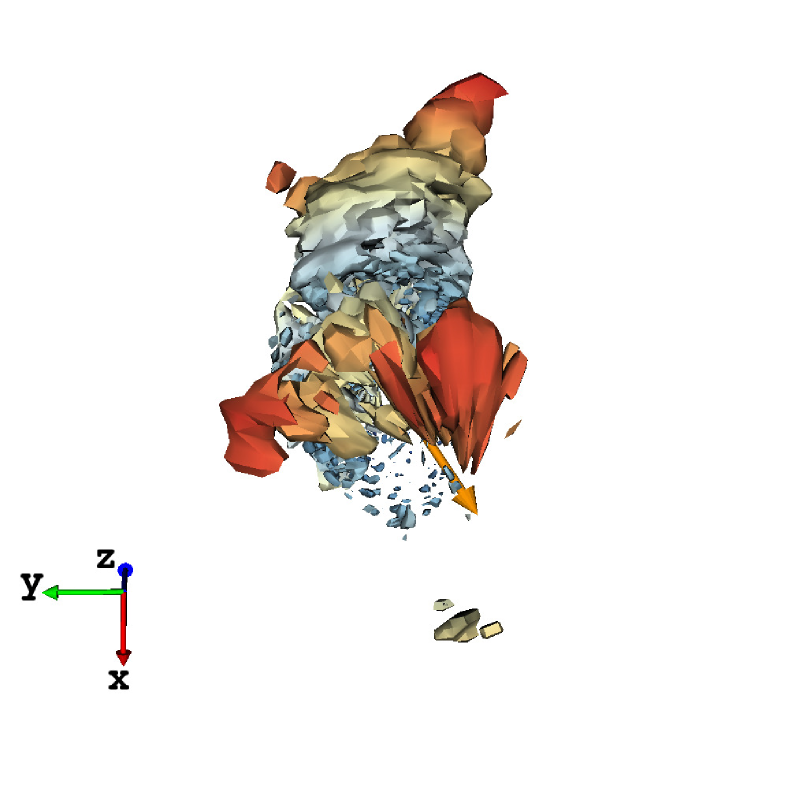
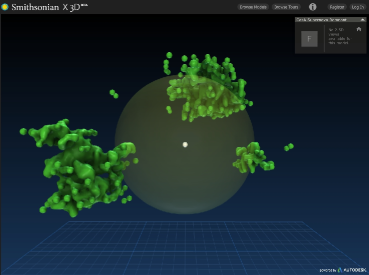
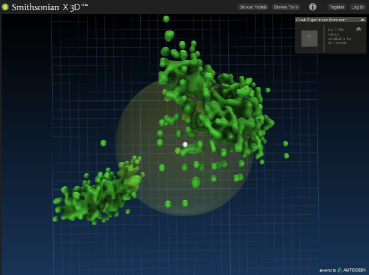
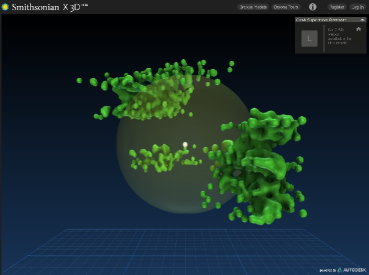
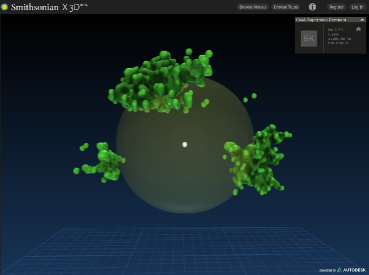
The “three-finger” geometry of the radioactive ejecta displayed in Figs. 10 and 11 reminds one of the three extended iron-rich structures (called “shrapnels” by Orlando et al., 2016) that are seen outside of the reverse-shock radius in Cas A (e.g., Hwang et al., 2004). In order to explore this morphological resemblence of our 3D model W15-2-cw-IIb with Cas A in more detail, we compare the properties of the innermost SN ejecta with the 3D visualization of the observational data of Cas A available at the Smithsonian X3D website http://3d.si.edu/explorer?modelid=45 (see Fig. 12) and at https://www.cfa.harvard.edu/dmilisav/casa-webapp/model.html. Our main focus in this Section is on the basic aspects of the 56Ni (or, after decay, Fe) distribution, which carries direct information on the geometry of the explosion in its earliest phase.
In Fig. 11 we present images of the iron and 44Ti distributions from four different observational perspectives corresponding to the “front view” (left panels), “top view” (second column), “left view” (third column), and “back view” (right panels) defined by the Smithsonian visualization (Fig. 12). For optimal resemblance we chose the front view similar to the observer direction of Figs. 8 and 10, however with a slightly different inclination of the NS kick vector relative to the line-of-sight. Instead of being perpendicular to the line-of-sight as in the previous Figures, the kick vector points toward the observer and out of the plane of the page with an angle of about 37∘. We note in passing that the corresponding velocity component of the NS motion perpendicular to the line-of-sight is around 460 km s-1. This is in the ballpark of the transverse velocity of the NS in Cas A, which was estimated to be about 350 km s-1 (Fesen et al., 2006b) and thus typical of young pulsars (e.g., Lyne & Lorimer, 1994; Arzoumanian et al., 2002).
The large angle of 53∘ between the NS kick and the observer direction for the front view of our model implies that the hemispheric asymmetry of the ejecta is mapped well from this perspective, where most of the 44Ti and 56Ni mass are seen in the northern part while the NS velocity vector points southward. The distribution of the radionuclei along the line-of-sight is far less one-sided. This can be concluded from the “top view” panels in the second column and the “left view” panels in the third column of Fig. 11, where one of the lower images permits the view on the NS kick vector. There are roughly similar amounts of matter moving toward the observers (who are located in the -direction) and away from them. This seems to be compatible with the observed redshift of the 44Ti line in Cas A. The corresponding bulk line-of-sight Doppler velocity was determined to be 1100–3000 km s-1 (Grefenstette et al., 2014). Boggs et al. (2015) estimated a “look-back” redshift velocity (associated with the finite lifetime of 44Ti and a longer light-travel time from the far side of Cas A) of 1400 km s-1 for the age and expansion speed of the SNR. They reasoned that the look-back effect is consistent with the measured redshift of the 44Ti line and that the spatially integrated 44Ti spectrum alone does not support any statistically significant asymmetry. Rather than having a large intrinsic mass-distribution asymmetry along the line-of-sight, Cas A reveals major asymmetry by the spatial brightness distribution of the 44Ti emission (Boggs et al., 2015). This look-back argument has been revised by the recent 3D analysis of Grefenstette et al. (2017). Nevertheless, the overall conclusions of these authors on the ejecta asymmetry in Cas A are in line with those of Boggs et al. (2015) (see below).
Besides the similarities between our model and Cas A discussed already, the different views in Figs. 11 and 12 reveal yet another resemblance. The three extended, iron and titanium containing fingers lie, by chance, in the same plane. For this reason, the ejecta fill a much narrower volume when looked at from the top and left views (panels in the two columns in the middle of Fig. 11). The configuration is reminiscent of Cas A, where reverse-shock-heated metals (Si, Ar, Ne, S, O) are arranged in a thick, ring-like belt girding the reverse-shock sphere, and the unshocked interior ejecta (seen in infrared via Si II; DeLaney et al., 2010) are apparently assembled in a “tilted thick disk” (Grefenstette et al., 2017). This outer belt also encompasses the iron-rich regions as well as the fiducial, Si-and Mg-rich “jets” (see the 3D visualizations of the Cas A observations on the websites mentioned above). Since this peculiar structure of the Cas A ejecta is not perpendicular to the “jets” but, quite the contrary, its central plane cuts the northeast and southwest “jets” of Cas A, rapid rotation seems highly unlikely as an explanation of the Cas A morphology. Adding to this argument, the NS kick in Cas A is perpendicular to the NE-SW direction, which contradicts expectations for a jet-driven explosion (Hwang et al., 2004).
Our long-time simulation demonstrates that the origin of the three iron fingers in our (nonrotating) 3D model W15-2-cw-IIb goes back to three dominant high-entropy plumes arising from postshock convective instability at the time when the explosion was launched (see left panel in the top row of figure 7 of Wongwathanarat et al., 2015). The morphological resemblance to the iron “shrapnels” of Cas A supports the interpretation that this remnant carries clear fingerprints of the initial explosion asymmetries, and neither a dynamically relevant amount of rotation nor a jet-driven explosion need to be invoked to explain the overall structure of the iron distribution in the Cas A remnant.
After the submission of our paper, a 3D analysis of the 44Ti distribution in Cas A was posted on arXiv by Grefenstette et al. (2017). In basic aspects their findings and conclusions are, again, in remarkably good agreement with our 3D results for model W15-2-cw-IIb as discussed above:
-
(i)
The estimated initial mass of 44Ti, , with an Fe/Ti ratio around 500 is in the ballpark of our model yields, although our nucleosynthesis calculations suggest that the iron content of Cas A could be somewhat higher than inferred by Grefenstette et al. (2017).
-
(ii)
In excellent correspondence to our simulated remnant geometry visualized in Figs. 10 and 11, the average momentum of the 44Ti in Cas A (estimated on grounds of the flux-weighted average of the ejecta velocities) is oriented in the plane of the sky almost precisely opposite to the direction of motion of the central compact object, and the NS is determined to have a significant line-of-sight velocity component toward the observer, even with an angle similar to the one shown in Fig. 11.
-
(iii)
44Ti knots near and exterior to the reverse shock are associated with emission from shock-heated iron (which should mostly be the product of radioactive 56Ni synthesized along with 44Ti); while the existence of titanium-rich regions without iron emission exterior to the reverse shock is not finally assured, the presence of shock-heated iron without observed titanium requires that the 44Ti yield is suppressed relative to the iron yield by at least a factor of two. This is easily compatible with predictions from our model, for which a detailed analysis reveals that the color variations visible in Fig. 8 correspond to large-scale variations of the titanium-to-iron ratio up to factors of 2–4 (and small-scale variations with even larger amplitudes).
-
(iv)
Significant amounts of 44Ti and 56Ni are diagnosed to lie within the reverse shock of Cas A, as suggested by our simulations. While our preferred model implies that 43% of the titanium could be in the unshocked inner sphere (Fig. 7), Grefenstette et al. (2017) found roughly 40% to be located clearly interior to the reverse shock. But current observational constraints (in particular of the part of the iron that is still hidden, i.e. unshocked, at the age of the Cas A remnant) are very uncertain, and better information from explosion models requires late-time simulations that follow the effects of radioactive decay heating by 56Ni and 44Ti as well as the evolution of the reverse shock from the ejecta interaction with the circumstellar medium.
-
(v)
Grefenstette et al. (2017) did not see any evidence for 44Ti ejecta associated with the blueshifted half of the thick disk of interior, unshocked ejecta, though redshifted titanium regions were found to lie in the redshifted half of the disk. However, the identity and location of the blueshifted knot 20b are disputable as discussed by Grefenstette et al. (2017) and mentioned in a footnote in Sect. 3.2. Maybe some part of this matter belongs to the blueshifted half of the thick disk. Different from Boggs et al. (2015), Grefenstette et al. (2017) did not diagnose any significant “look-back” effect (associated with the difference in light-travel time between blueshifted and redshifted ejecta) affecting the results, but concluded a moderate asymmetry of the 44Ti distribution with some excess of redshifted material (mean line-of-sight velocity of km s-1). This seems to be basically compatible with the asymmetric distribution of titanium in our model, as reflected by the line-of-sight component of the NS velocity toward the observer in Fig. 11.
In future work we plan to perform a closer comparison of our model predictions and the Cas A data with respect to a wider set of nucleosynthesis products and their spatially inhomogeneous distribution, e.g. in the fiducial Si/Mg-rich, high-velocity, wide-angle “jets” (e.g. Fesen et al., 2006b), in the form of large cavities and “bubbles” in the unshocked inner sphere (Milisavljevic & Fesen, 2015), and as crown-like and ring-like features (containing Ar) that also surround the iron-rich “shrapnels” in the Cas A SNR’s optical main shell (e.g. Fesen et al., 2001; DeLaney et al., 2010; Milisavljevic & Fesen, 2013). For this goal we will continue the present 3D explosion simulations toward the remnant stage. Such calculations will have to include the effects of radioactive decay heating, which may inflate the regions containing the radionuclei against their surroundings. They will also have to take into account the reverse shock from the ejecta-environment interaction, which will have an impact on the radial velocity profile and is likely to modify the detailed shape of the shock-compressed ejecta regions.
4 Conclusions and discussion
In this work we presented 3D simulations of a neutrino-driven SN explosion with remarkable resemblance to basic properties of Cas A. The discussed model (W15-2/W15-2-cw) was one of the cases studied by Wongwathanarat et al. (2013, 2015). Neither the progenitor star, a nonrotating 15 model (whose hydrogen envelope we removed by hand down to a small rest of 0.3 to account for the SN IIb case of Cas A), nor the explosion parameters were iterated for optimal agreement with the observations. The morphological similarities between the simulation results and Cas A are consequences of stochastic processes (convective overturn and SASI activity) that take place in the SN core at the onset of the explosion. Since the nonradial hydrodynamic instabilities grow from small, random, initial seed perturbations in a chaotic way, the final explosion geometry is not under control by input parameters of the simulation, and larger sets of 3D calculations may be needed to obtain results of very close similarity for other progenitor stars or different explosion energies.
Our 3D simulations were started shortly after core bounce, and the accretion phase and beginning of the SN explosion until 1.3 s were computed with a simplified, gray treatment of the neutrino transport and with prescribed, time-dependent neutrino luminosities at the inner grid boundary. Due to its free parameters this neutrino engine allowed us to tune the energy of the neutrino-driven explosion to a chosen value. Although approximative, the description of the neutrino effects was sufficiently realistic to adequately capture the development of hydrodynamic instabilities in the neutrino-heating layer and the subsequent evolution of asymmetries and mixing instabilities during the SN explosion. The discussed 3D simulations followed the evolution until about one day, at which time the expansion of the ejecta already closely approached a homologous state in the investigated SN IIb-like explosion.
Based on tracer-particle trajectories, we post-processed our 3D model with respect to the nucleosynthesis of radioactive nuclei, focusing particularly on 44Ti and 56Ni, which decay to stable 44Ca and 56Fe, respectively. These radionuclides are especially interesting for a comparison with Cas A, because they are assembled near the very center of the explosion and therefore carry imprints of the asymmetries that play a role for the physical mechanism triggering the blast wave of the SN.
Our main findings can be summarized as follows:
1. The production of radionuclei.
The explosion with an energy of 1.5 B and an ejecta
mass of about 3.3 produces
between 0.043 and 0.96 of 56Ni and
between and
of 44Ti. The 44Ti
yield is 50% higher than these values (up to
) when our standard rate of
the 44TiV reaction from Cyburt et al. (2010)
is reduced by a factor of two as suggested by recent experimental
results of Margerin et al. (2014).
Major contributions to the 56Ni and 44Ti nucleosynthesis
come from -particle-rich freeze-out in neutrino-processed,
high-entropy ejecta.
The uncertainties of the nickel and titanium yields are
connected to uncertainties of the electron fraction in
this matter. The lowest
yields are based on -values slightly less than 0.5, as
computed with our approximative neutrino handling; the upper
bounds for the yields were obtained when we adopted
as present in the progenitor star. For values
slightly higher than 0.5, one can still expect efficient
creation of 56Ni but noticeably less 44Ti,
whereas the production of both 56Ni and 44Ti
drops steeply below
(Magkotsios et al., 2010; Wanajo et al., 2013).
A large production of 44Ti therefore hinges sensitively
on the of the expelled matter, and is possible in
principle because neutrino-driven explosions genericly eject
considerable amounts of matter with a favorable range of
entropies (10 30
per nucleon).
It is important to note that the neutron-to-proton ratio in neutrino-processed ejecta can only be determined with accurate, energy-dependent neutrino transport. However, even with the best numerical treatment, considerable uncertainties prevent reliable theoretical predictions at the present time. Since in neutrino-heated SN outflows is set by a delicate competition of and absorptions (and initially also the inverse emission processes), a variety of factors can have important influence, easily leading to shifts of by a few percent above or below 0.5. Examples of such sensitive effects include, for example, the detailed and progenitor-dependent flow dynamics, which determines the expansion time scale and thus decides how long the ejecta can stay in reactive equilibrium with respect to the mentioned processes; remaining uncertainties of the neutrino opacities at high densities interior to the neutrinospheres, which could modify the radiated luminosities and spectra of and relative to each other and thus the neutrino absorption at larger radii; incompletely understood physics phenomena such as neutrino oscillations, in particular collective flavor transformations (for a review, see, e.g., Mirizzi et al., 2016); or the new lepton-emission self-sustained asymmetry (LESA; Tamborra et al., 2014), which could lead to considerable changes of the neutrino emission from SN cores.
For a somewhat higher explosion energy and a moderately larger ejecta mass than considered in our simulation, both of which seem likely for Cas A ( B, ; Vink, 2004; Orlando et al., 2016), neutrino-driven explosions produce higher nickel yields (see the correlation in figure 17 of Sukhbold et al., 2016). Since a higher explosion energy goes hand in hand with a larger mass of high-entropy ejecta, also more titanium can be expected, provided in the neutrino-heated matter stays in a favorable, narrow interval around 0.5. We stress again that we did not seek for a perfect quantitative match of Cas A observations and estimates here, but our discussion was focussed on a proof-of-principle.
We conclude that neutrino-driven explosions, without the need to invoke rapid rotation or (jet-induced) bipolar deformation, can well account for the initial 44Ti masses and titanium-to-nickel mass-ratios (around ) deduced from observations of Cas A and SN 1987A. For the former, current measurements give a 44Ti yield of (1.0 … 1.7) (Grefenstette et al., 2014, 2017; Siegert et al., 2015; Tsygankov et al., 2016; Wang & Li, 2016), whereas in the case of SN 1987A the recent determinations of the expelled amount of 44Ti exhibit a wider spread, namely between (Seitenzahl et al., 2014) and roughly (2 … (Grebenev et al., 2012), although the value was narrowed down to by Boggs et al. (2015) (for a result consistent with that, see Jerkstrand et al., 2011).
The rarity of pointlike sources in the Galaxy that produce of order of 44Ti, as inferred from an analysis of the observed gamma-ray sky compared to theoretical expectations (The et al., 2006; Renaud et al., 2006; Tsygankov et al., 2016), implies that only a small fraction of stellar explosions eject sufficient amounts of matter with close to 0.5 and temperatures and entropies high enough for efficient -rich freeze-out nucleosynthesis of 44Ti. In the context of neutrino-driven explosions, considerable masses of high-entropy ejecta are a generic property, but smaller differences of the explosion dynamics or neutrino-emission characteristics, which could vary with the progenitor or the physics of the nascent NS, may be responsible to provide or prevent conditions where atypically large amounts of 44Ti can be synthesized. Cas A and SN 1987A, which both originated from stars in the 15–20 range, seem to be representative of such atypical collapse events, in which special and yet undetermined conditions allowed in the neutrino-processed, high-entropy matter to stay in the favorable vicinity of 0.5. Independent of the physics needed to achieve this, large amounts of 44Ti as observed in Cas A and SN 1987A indicate sizable ejecta masses with entropies between 10 and 30 per nucleon. This may be interpreted as a characteristic fingerprint that is expected for SN explosions powered by energy stored in neutrino-heated matter. In this context it is notable that SN 1987A as well as Cas A were fairly energetic explosions, both having energies toward the high side of the range that may be explained by the neutrino-driven mechanism.
2. The velocities of radioactive ejecta.
The remnant of Cas A resulted from an asymmetric Type IIb SN
(Krause et al., 2008; Rest et al., 2011). For this
reason we repeated explosion calculations for our model
W15-2/W15-2-cw after removing the hydrogen envelope of the
original red supergiant progenitor except for a minor rest of
0.3 . The new simulation was named W15-2-cw-IIb.
The absence of a massive hydrogen envelope had two important consequences. First, for the same explosion energy, the bulk of the ejecta (dominated by the helium shell) was expelled with significantly higher velocities compared to the red supergiant. This could be expected because of the scaling of the average ejecta velocity with . Without the deceleration by a reverse shock from the He/H interface, also the innermost SN ejecta as traced by the radionuclei of 44Ti and 56Ni, could retain much higher mean bulk velocities up to roughly 7000 km s-1 (and smaller amounts of material being even faster), close to the velocity of the fastest 44Ti material reported (Grefenstette et al., 2014, 2017; Siegert et al., 2015).
The second consequence of the stripped nature of the SNIIb progenitor was the preservation of large, coherent iron and titanium “clumps” or plumes, which in the case of SN-shock deceleration by a massive H-envelope would have fragmented because of a RT unstable density inversion near the He/H interface; see Kifonidis et al. (2003) for a detailed discussion and 3D results for the red supergiant simulation of model W15-2-cw in Wongwathanarat et al. (2015).
Because the progenitor of Cas A did not possess a massive hydrogen envelope, the asymmetric Ni and Ti-rich structures imposed by the explosion mechanism at the very beginning of the SN blast could survive intact, with much less perturbative influence of secondary hydrodynamic instabilities that develop at the composition interfaces of the progenitor after the passage of the outgoing SN shock. As shown by Wongwathanarat et al. (2015) and in our simulation of model W15-2-cw-IIb, the RT unstable layer at the C-O/He boundary leads to considerably less fragmentation of the initial structures than the instability at the He/H transition. Therefore our results support speculations by Hwang et al. (2004) and Vink (2004) that Cas A is a very young remnant whose morphology still carries the imprints of the asymmetries at the onset of the explosion. This property makes Cas A an extremely precious test case for studying the explosion mechanism of core-collapse SNe.
3. 3D spatial distribution of the radionuclei.
Basic morphological features of the iron and 44Ti ejecta
in our model W15-2-cw-IIb exhibit amazing similarity to
overall properties of the spatial distribution of these
elements in Cas A.
The production (by (in)complete Si-burning and the -particle-rich freeze-out process) and distribution of 44Ti are closely linked to those of 56Ni. Most of the mass of these radionuclei is condensed in widely distributed clumps and knots of different sizes, which contain high mass fractions [(56Ni), (44Ti)] of more than 40–50% for iron and more than roughly 0.1% for titanium. Considerable spatial variations of the relative mix of iron and titanium can occur, and clumpy structures exist with high concentrations of 44Ti but comparatively small amounts of admixed iron, and vice versa. On large spatial scales, can vary between 0.001 and 0.004, on small scales even with larger amplitudes. The central regions of our simulated explosion are more homogeneously filled with lower-velocity material of the two nuclear species.
Most of the synthesized 44Ti and 56Ni mass in model W15-2-cw-IIb are expelled in the hemisphere opposite to the NS kick direction, although a bigger mass concentration shares the same hemisphere with the kick vector. This model feature, once more, is similar to the situation observed in Cas A, where the NS moves in a direction pointing away from the region where most of the 44Ti clumps are located (compare figure 2 of Grefenstette et al. 2014 with Fig. 8 for our model and the 3D 44Ti distribution analyzed by Grefenstette et al. 2017 with our Figs. 10 and 11). This observation is perfectly compatible with expectations on grounds of the gravitational tug-boat mechanism, which predicts the NS to be recoiled by explosion asymmetries and to be accelerated opposite to the direction of the stronger SN blast wave, i.e., away from the hemisphere where elements from silicon to the iron group, including 44Ti, are produced more efficiently by explosive nucleosynthesis (Wongwathanarat et al., 2013).
Three big, iron-rich fingers with mushroom-head-like tips (see Figs. 10 and 11) could have their correspondence in the three, extended regions seen in the Fe K-shell emission outside of the reverse shock in Cas A (Fig. 12). The fact that these fingers in our model, by chance, lie essentially in the same plane, leads to an ejecta structure that is considerably less extended perpendicular to this plane than in the plane itself. This geometry strongly resembles the spatial arrangement of the iron “shrapnels” (Orlando et al., 2016) and of intermediate-mass elements (Si, Ar, Ne, S, O) within a thick, ring-like belt around the reverse-shock sphere of Cas A (DeLaney et al., 2010; Milisavljevic & Fesen, 2013). Closest resemblance between model and observations is found when the plane of the three iron fingers in our simulation is oriented roughly perpendicular to the line-of-sight. This implies that a considerable component of the NS space velocity could lie along the line-of-sight toward the observer (Fig. 11).
Based on their recent, spatially resolved spectroscopic analysis of the 3D distribution of 44Ti in Cas A, Grefenstette et al. (2017) came to the same conclusion and described an ejecta and NS kick geometry with very close similarity to our model results. Also other main findings of Grefenstette et al. (2017) are in very nice agreement with our simulations. In particular, this recent work eliminates tension between some observational aspects reported by Grefenstette et al. (2014) and the theoretical expectations. 44Ti is now observed clearly interior to, near, and exterior to the reverse shock of Cas A, and shock-heated iron is found where titanium is observed in the shocked shell. Reversely, the fact that some iron-rich regions are not associated with a detection of 44Ti does not pose a major problem. Since the model-predicted mass-fraction ratio, , varies between 0.001 and 0.004 on large spatial scales,444Iron-group species different from 56Ni are synthesized abundantly especially in shock-heated ejecta (i.e., via incomplete silicon burning) and can also be formed in the neutrino-heated ejecta under conditions that do not allow for abundant 44Ti synthesis. These non-56Ni nuclei contribute several or globally about 25% (locally up to 35%) of the total iron yield of our model W15-2-cw-IIb. They may enhance the spatial variations of the Ti/Fe ratio (Grefenstette et al., 2017), although efficient mixing tends to work in the opposite direction and tries to erase pronounced differences of the and distributions in extended volumes. it is well able to account for the suppression of the production of 44Ti by at least a factor of two in some iron-rich regions as concluded by Grefenstette et al. (2017).
While the NuSTAR data of Grefenstette et al. (2014) were interpreted to imply that at least 80% of the observed 44Ti emission are contained within the reverse-shock radius of Cas A as projected on the plane of the sky, Grefenstette et al. (2017) were now able to refine this picture. Based on the present-day flux they estimated that 40% of the 44Ti mass are clearly interior to the reverse shock, 40% are at or near the reverse-shock radius, and roughly 20% are clearly exterior to it. This is nicely compatible with expectations from our model W15-cw-IIb, which predicts 43% of the 44Ti to be associated with the slower half of the iron (below about 4000 km s-1), if we assume that up to as much as 50% (or up to 0.1 ) of the total Fe yield of the Cas A SN could reside in the remnant’s unshocked central volume (e.g., Milisavljevic & Fesen, 2015; Orlando et al., 2016). Grefenstette et al. (2017) estimated that only about 0.02 of the iron are “hidden” in the unshocked interior of Cas A. This value appears to be on the low side compared to the previous estimates and also compared to our model results. However, one should keep in mind that it is based on the assumption of a model-dependent and uncertain (constant) Fe/Ti ratio of 500.
Although our current 3D SN explosion model is not fully self-consistent, but invokes a parametrized neutrino engine, the presented results are assuring and may, cautiously, be considered as support of the possibility that Cas A is the remnant of a neutrino-driven explosion with its generic hydrodynamic instabilities. Rotation does not seem to be needed to explain basic morphological properties of Cas A, and some of the discussed observations even disfavor its relevance. The fiducial “jet” and “counter-jet” are spatially connected to the thick metal belt that girds the reverse-shock sphere, and the direction of the NS kick is perpendicular to the NE-SW direction defined by the jets. Moreover, the jets are Si-rich but do not contain much iron, are very wide (Fesen et al., 2006b; Milisavljevic & Fesen, 2013), and their kinetic energy (of order B; Laming et al., 2006; Fesen & Milisavljevic, 2016) is too low to attribute to them a crucial role in the explosion mechanism. All of these facts are not compatible with theoretical expectations for a classical “jet-driven” explosion with the axis in the NE-SW direction (e.g., Khokhlov et al., 1999; Laming et al., 2006; Wheeler et al., 2008; Hwang et al., 2004; Isensee et al., 2010; Grefenstette et al., 2014).
Despite the reported first successes in understanding the origin of some basic properties and morphological peculiarities of Cas A, a large variety of features of Cas A remain to be explained and require more, longer, and better (in particular, more self-consistent) simulations. Important questions, for example, are connected to the following problems.
The fairly high explosion energy estimated for Cas A (around 2.3 B) may pose a challenge for the neutrino-driven mechanism. Presently no modern self-consistent multi-dimensional simulation has achieved to obtain such energetic explosions (see the recent reviews by Janka et al. 2016 and Müller 2016).555This is different from older two-dimensional smoothed-particle-hydrodynamics simulations with gray, flux-limited neutrino diffusion, where neutrino-driven explosions up to 3 B could be obtained (Fryer, 1999; Fryer & Kalogera, 2001), and it also disagrees with parametric neutrino-wind-driven explosions in spherical symmetry, which have produced explosion energies up to more than 7 B (Young et al., 2006; Pejcha & Thompson, 2015). However, 1D explosion models with a parametric treatment of the neutrino-heating mechanism (where the parameters were calibrated by employing constraints set by observed properties of SN 1987A) could reach these energies for the most extreme cases (Ugliano et al., 2012; Ertl et al., 2016; Müller et al., 2016a). Interestingly, the corresponding progenitors are in the 18–22 range and thus around the suspected mass of the Cas A progenitor. This justifies hope that the energy problem could ultimately be solved with a better quantitative understanding of the explosion physics of the neutrino-driven mechanism in 3D.
Of course, the origin of the fiducial jets in Cas A, which are actually rather wide, high-velocity structures (Fesen et al., 2006b), deserves special attention. Could they be connected to large-scale, low-mode asymmetries in the convective Si- and/or O-burning shells of the collapsing star such as the quadrupolar convection mode recently found by Müller et al. (2016b) for an 18 star at the onset of core collapse? Or do the high-velocity flows point to a phase of bipolar (magnetic) spin-down activity of the newly formed NS, possibly shortly after the explosion was launched by the neutrino mechanism? Or are they “simply” caused by direction and element-dependent differences of the interaction of asymmetrically expelled inner ejecta with the reverse shock from the SN expansion into the environment? Si-rich ejecta with the highest velocities (in our moderately energetic explosion model in excess of 10000 km s-1) are far outside of the fastest iron and are likely to be affected by their collision with the reverse shock in a different (possibly weaker) way than the lower-velocity bulk of the iron deeper inside the expanding SN debris, which encounters a fully developed reverse shock moving inward with higher speed.
Finally, it is intriguing that both Cas A and SN 1987A exhibit atypically high 44Ti masses and are attributed to progenitors in the 15–20 range (or, possibly, even in the 18–20 interval, see the discussion for SN 1987A in Sukhbold et al., 2016). Do both cases share a common reason for the exceptionally high production of 44Ti? Could there also be morphological similarities of both explosions and remnants? The Doppler redshifts of the 44Ti lines in SN 1987A were interpreted by a single-lobe explosion oriented at an angle pointing away from us (Boggs et al., 2015), whereas Larsson et al. (2016) reported a resemblance to a broken dipole structure, analysing in detail spectra and images of SN 1987A taken by HST/STIS and VLT/SINFONI at optical and near-infrared wavelengths. We speculate that our 3D explosion model discussed in the present paper, although no single-lobe explosion, might exhibit sufficient asymmetry to explain the redshifting of the NuSTAR spectrum with its 44Ti lines (Boggs et al., 2015) and of the gamma-ray and infrared emission associated with nickel and iron (Haas et al., 1990; Spyromilio et al., 1990). In order to account for this observed asymmetry of SN 1987A, our model would predict a NS kick pointing toward us with a rather small angle relative to the line-of-sight (in contrast to the case of Cas A, where we inferred this angle to be fairly large). In such a case the far majority of the synthesized 44Ti and 56Ni in our model would move away from the observer, consistent with the redshifted lines of 44Ti in SN 1987A. Further studies of this SN on the basis of the set of 3D simulations of Wongwathanarat et al. (2013, 2015) will be a topic of future research.
References
- Arnett & Meakin (2011) Arnett, W. D., & Meakin, C. 2011, ApJ, 733, 78
- Arzoumanian et al. (2002) Arzoumanian, Z., Chernoff, D. F., & Cordes, J. M. 2002, ApJ, 568, 289
- Blondin et al. (2003) Blondin, J. M., Mezzacappa, A., & DeMarino, C. 2003, ApJ, 584, 971
- Boggs et al. (2015) Boggs, S. E., Harrison, F. A., Miyasaka, H., et al. 2015, Science, 348, 670
- Colella & Glaz (1985) Colella, P., & Glaz, H. M. 1985, J. Comput. Phys., 59, 264
- Colella & Woodward (1984) Colella, P., & Woodward, P. R. 1984, J. Comput. Phys., 54, 174
- Couch et al. (2015) Couch, S. M., Chatzopoulos, E., Arnett, W. D., & Timmes, F. X. 2015, ApJ, 808, L21
- Cyburt et al. (2010) Cyburt, R. H., Amthor, A. M., Ferguson, R., et al. 2010, ApJS, 189, 240
- DeLaney et al. (2010) DeLaney, T., Rudnick, L., Stage, M. D., et al. 2010, ApJ, 725, 2038
- Diehl (2013) Diehl, R. 2013, Reports on Progress in Physics, 76, 026301
- Ellinger et al. (2013) Ellinger, C. I., Rockefeller, G., Fryer, C. L., Young, P. A., & Park, S. 2013, ArXiv e-prints, arXiv:1305.4137
- Ellinger et al. (2012) Ellinger, C. I., Young, P. A., Fryer, C. L., & Rockefeller, G. 2012, ApJ, 755, 160
- Eriksen et al. (2009) Eriksen, K. A., Arnett, D., McCarthy, D. W., & Young, P. 2009, ApJ, 697, 29
- Ertl et al. (2016) Ertl, T., Janka, H.-T., Woosley, S. E., Sukhbold, T., & Ugliano, M. 2016, ApJ, 818, 124
- Fesen (2001) Fesen, R. A. 2001, ApJS, 133, 161
- Fesen & Milisavljevic (2016) Fesen, R. A., & Milisavljevic, D. 2016, ApJ, 818, 17
- Fesen et al. (2001) Fesen, R. A., Morse, J. A., Chevalier, R. A., et al. 2001, AJ, 122, 2644
- Fesen et al. (2011) Fesen, R. A., Zastrow, J. A., Hammell, M. C., Shull, J. M., & Silvia, D. W. 2011, ApJ, 736, 109
- Fesen et al. (2006a) Fesen, R. A., Hammell, M. C., Morse, J., et al. 2006a, ApJ, 636, 859
- Fesen et al. (2006b) —. 2006b, ApJ, 645, 283
- Fryer (1999) Fryer, C. L. 1999, ApJ, 522, 413
- Fryer & Kalogera (2001) Fryer, C. L., & Kalogera, V. 2001, ApJ, 554, 548
- Fryxell et al. (1991) Fryxell, B., Arnett, D., & Müller, E. 1991, ApJ, 367, 619
- Gotthelf et al. (2001) Gotthelf, E. V., Koralesky, B., Rudnick, L., et al. 2001, ApJ, 552, L39
- Grebenev et al. (2012) Grebenev, S. A., Lutovinov, A. A., Tsygankov, S. S., & Winkler, C. 2012, Nature, 490, 373
- Grefenstette et al. (2014) Grefenstette, B. W., Harrison, F. A., Boggs, S. E., et al. 2014, Nature, 506, 339
- Grefenstette et al. (2017) Grefenstette, B. W., Fryer, C. L., Harrison, F. A., et al. 2017, ApJ, 834, 19
- Haas et al. (1990) Haas, M. R., Erickson, E. F., Lord, S. D., et al. 1990, ApJ, 360, 257
- Hughes et al. (2000) Hughes, J. P., Rakowski, C. E., Burrows, D. N., & Slane, P. O. 2000, ApJ, 528, L109
- Hwang & Laming (2003) Hwang, U., & Laming, J. M. 2003, ApJ, 597, 362
- Hwang & Laming (2012) —. 2012, ApJ, 746, 130
- Hwang et al. (2004) Hwang, U., Laming, J. M., Badenes, C., et al. 2004, ApJ, 615, L117
- Isensee et al. (2010) Isensee, K., Rudnick, L., DeLaney, T., et al. 2010, ApJ, 725, 2059
- Isensee et al. (2012) Isensee, K., Olmschenk, G., Rudnick, L., et al. 2012, ApJ, 757, 126
- Iyudin et al. (1994) Iyudin, A. F., Diehl, R., Bloemen, H., et al. 1994, A&A, 284, L1
- Janka (2001) Janka, H.-T. 2001, A&A, 368, 527
- Janka (2017) —. 2017, ApJ, 837, 84
- Janka et al. (2016) Janka, H.-T., Melson, T., & Summa, A. 2016, Annual Review of Nuclear and Particle Science, 66, 341
- Jerkstrand et al. (2011) Jerkstrand, A., Fransson, C., & Kozma, C. 2011, A&A, 530, A45
- Kageyama & Sato (2004) Kageyama, A., & Sato, T. 2004, Geochemistry Geophysics Geosystems, 5
- Khokhlov et al. (1999) Khokhlov, A. M., Höflich, P. A., Oran, E. S., et al. 1999, ApJ, 524, L107
- Kifonidis et al. (2003) Kifonidis, K., Plewa, T., Janka, H.-T., & Müller, E. 2003, A&A, 408, 621
- Kifonidis et al. (2006) Kifonidis, K., Plewa, T., Scheck, L., Janka, H.-T., & Müller, E. 2006, A&A, 453, 661
- Krause et al. (2008) Krause, O., Birkmann, S. M., Usuda, T., et al. 2008, Science, 320, 1195
- Laming & Hwang (2003) Laming, J. M., & Hwang, U. 2003, ApJ, 597, 347
- Laming et al. (2006) Laming, J. M., Hwang, U., Radics, B., Lekli, G., & Takács, E. 2006, ApJ, 644, 260
- Larsson et al. (2016) Larsson, J., Fransson, C., Spyromilio, J., et al. 2016, ApJ, 833, 147
- Liou (1996) Liou, M.-S. 1996, J. Comput. Phys., 129, 364
- Lodders (2003) Lodders, K. 2003, ApJ, 591, 1220
- Lyne & Lorimer (1994) Lyne, A. G., & Lorimer, D. R. 1994, Nature, 369, 127
- Magkotsios et al. (2010) Magkotsios, G., Timmes, F. X., Hungerford, A. L., et al. 2010, ApJS, 191, 66
- Margerin et al. (2014) Margerin, V., Murphy, A. S. J., Davinson, T., et al. 2014, Physics Letters B, 731, 358
- Milisavljevic & Fesen (2013) Milisavljevic, D., & Fesen, R. A. 2013, ApJ, 772, 134
- Milisavljevic & Fesen (2015) —. 2015, Science, 347, 526
- Mirizzi et al. (2016) Mirizzi, A., Tamborra, I., Janka, H.-T., et al. 2016, Nuovo Cimento Rivista Serie, 39, 1
- Müller (2016) Müller, B. 2016, PASA, 33, e048
- Müller et al. (2016a) Müller, B., Heger, A., Liptai, D., & Cameron, J. B. 2016a, MNRAS, 460, 742
- Müller et al. (2016b) Müller, B., Viallet, M., Heger, A., & Janka, H.-T. 2016b, ApJ, 833, 124
- Müller et al. (1991a) Müller, E., Fryxell, B., & Arnett, D. 1991a, in European Southern Observatory Conference and Workshop Proceedings, ed. I. J. Danziger & K. Kjaer, Vol. 37, 99
- Müller et al. (1991b) Müller, E., Fryxell, B., & Arnett, D. 1991b, A&A, 251, 505
- Müller & Steinmetz (1995) Müller, E., & Steinmetz, M. 1995, Comput. Phys. Commun., 89, 45
- Nagataki et al. (1997) Nagataki, S., Hashimoto, M.-a., Sato, K., & Yamada, S. 1997, ApJ, 486, 1026
- Nagataki et al. (1998) Nagataki, S., Hashimoto, M.-a., Sato, K., Yamada, S., & Mochizuki, Y. S. 1998, ApJ, 492, L45
- Nordhaus et al. (2012) Nordhaus, J., Brandt, T. D., Burrows, A., & Almgren, A. 2012, MNRAS, 423, 1805
- Nordhaus et al. (2010) Nordhaus, J., Brandt, T. D., Burrows, A., Livne, E., & Ott, C. D. 2010, Phys. Rev. D, 82, 103016
- Orlando et al. (2016) Orlando, S., Miceli, M., Pumo, M. L., & Bocchino, F. 2016, ApJ, 822, 22
- Pejcha & Thompson (2015) Pejcha, O., & Thompson, T. A. 2015, ApJ, 801, 90
- Perego et al. (2015) Perego, A., Hempel, M., Fröhlich, C., et al. 2015, ApJ, 806, 275
- Plewa & Müller (1999) Plewa, T., & Müller, E. 1999, A&A, 342, 179
- Quirk (1994) Quirk, J. J. 1994, Int. J. Num. Meth. Fluids, 18, 555
- Renaud et al. (2006) Renaud, M., Vink, J., Decourchelle, A., et al. 2006, ApJ, 647, L41
- Rest et al. (2011) Rest, A., Foley, R. J., Sinnott, B., et al. 2011, ApJ, 732, 3
- Scheck et al. (2006) Scheck, L., Kifonidis, K., Janka, H.-T., & Müller, E. 2006, A&A, 457, 963
- Seitenzahl et al. (2014) Seitenzahl, I. R., Timmes, F. X., & Magkotsios, G. 2014, ApJ, 792, 10
- Siegert et al. (2015) Siegert, T., Diehl, R., Krause, M. G. H., & Greiner, J. 2015, A&A, 579, A124
- Smith et al. (2009) Smith, J. D. T., Rudnick, L., Delaney, T., et al. 2009, ApJ, 693, 713
- Spyromilio et al. (1990) Spyromilio, J., Meikle, W. P. S., & Allen, D. A. 1990, MNRAS, 242, 669
- Strang (1968) Strang, G. 1968, SIAM J. Numer. Anal., 5, 506
- Sukhbold et al. (2016) Sukhbold, T., Ertl, T., Woosley, S. E., Brown, J. M., & Janka, H.-T. 2016, ApJ, 821, 38
- Tamborra et al. (2014) Tamborra, I., Hanke, F., Janka, H.-T., et al. 2014, ApJ, 792, 96
- The et al. (2006) The, L.-S., Clayton, D. D., Diehl, R., et al. 2006, A&A, 450, 1037
- Thorstensen et al. (2001) Thorstensen, J. R., Fesen, R. A., & van den Bergh, S. 2001, AJ, 122, 297
- Timmes & Swesty (2000) Timmes, F. X., & Swesty, F. D. 2000, ApJS, 126, 501
- Tsygankov et al. (2016) Tsygankov, S. S., Krivonos, R. A., Lutovinov, A. A., et al. 2016, MNRAS, 458, 3411
- Ugliano et al. (2012) Ugliano, M., Janka, H.-T., Marek, A., & Arcones, A. 2012, ApJ, 757, 69
- Utrobin (2005) Utrobin, V. P. 2005, Astronomy Letters, 31, 806
- Vink (2004) Vink, J. 2004, New A Rev., 48, 61
- Vink (2005) —. 2005, Advances in Space Research, 35, 976
- Vink (2012) —. 2012, A&A Rev., 20, 49
- Vink et al. (2001) Vink, J., Laming, J. M., Kaastra, J. S., et al. 2001, ApJ, 560, L79
- Wanajo (2006) Wanajo, S. 2006, ApJ, 647, 1323
- Wanajo et al. (2013) Wanajo, S., Janka, H.-T., & Müller, B. 2013, ApJ, 774, L6
- Wang & Li (2016) Wang, W., & Li, Z. 2016, ApJ, 825, 102
- Wheeler et al. (2008) Wheeler, J. C., Maund, J. R., & Couch, S. M. 2008, ApJ, 677, 1091
- Wongwathanarat et al. (2010a) Wongwathanarat, A., Hammer, N. J., & Müller, E. 2010a, A&A, 514, A48
- Wongwathanarat et al. (2010b) Wongwathanarat, A., Janka, H.-T., & Müller, E. 2010b, ApJ, 725, L106
- Wongwathanarat et al. (2013) —. 2013, A&A, 552, A126
- Wongwathanarat et al. (2015) Wongwathanarat, A., Müller, E., & Janka, H.-T. 2015, A&A, 577, A48
- Woosley & Hoffman (1991) Woosley, S. E., & Hoffman, R. D. 1991, ApJ, 368, L31
- Woosley & Weaver (1995) Woosley, S. E., & Weaver, T. A. 1995, ApJS, 101, 181
- Young et al. (2006) Young, P. A., Fryer, C. L., Hungerford, A., et al. 2006, ApJ, 640, 891