phylodyn: an R package for phylodynamic simulation and inference
Michael D. Karcher1*, Julia A. Palacios2,3111The first two authors contributed equally to this paper., Shiwei Lan4, Vladimir N. Minin1,5
1Department of Statistics, University of Washington, Seattle, WA, USA
2Department of Statistics, Stanford University, Stanford, CA, USA
3Department of Biomedical Data Science, Stanford University, Stanford, CA, USA
4Department of Statistics, University of Warwick, Coventry, UK
5Department of Biology, University of Washington, Seattle, WA, USA
Abstract
We introduce phylodyn, an R package for phylodynamic analysis based on gene genealogies. The package main functionality is Bayesian nonparametric estimation of effective population size fluctuations over time. Our implementation includes several Markov chain Monte Carlo-based methods and an integrated nested Laplace approximation-based approach for phylodynamic inference that have been developed in recent years. Genealogical data describe the timed ancestral relationships of individuals sampled from a population of interest. Here, individuals are assumed to be sampled at the same point in time (isochronous sampling) or at different points in time (heterochronous sampling); in addition, sampling events can be modeled with preferential sampling, which means that the intensity of sampling events is allowed to depend on the effective population size trajectory. We assume the coalescent and the sequentially Markov coalescent processes as generative models of genealogies. We include several coalescent simulation functions that are useful for testing our phylodynamics methods via simulation studies. We compare the performance and outputs of various methods implemented in phylodyn and outline their strengths and weaknesses. R package phylodyn is available at https://github.com/mdkarcher/phylodyn.
Introduction
In the last several decades, phylodynamic inference has demonstrated its usefulness in ecology and epidemiology [Grenfell et al., 2004, Holmes and Grenfell, 2009]. The key inferential insight of phylodynamics is that population dynamics leave their mark in the shape of gene genealogies and thereby the sequence data sampled. Kingman’s coalescent models the relationship between effective population size and the likelihood of observing a particular genealogy [Kingman, 1982]. In order to be computationally feasible, early coalescent-based models required strong parametric assumptions on the effective population size trajectory [Griffiths and Tavaré, 1994, Drummond et al., 2002, Kuhner et al., 1998]. More recently, nonparametric models have allowed a much more diverse class of effective population size trajectories to be inferred, at the cost of estimating many more parameters. Methods have emerged that compromise between the two extremes, maintaining a tractable number of parameters while allowing for a diverse class of estimable trajectories [Drummond et al., 2005, Minin et al., 2008, Palacios and Minin, 2013, Gill et al., 2013]. See the review by Ho and Shapiro [2011] for a detailed comparison.
Here we unify user interfaces for three different but related Bayesian nonparametric methods. These methods assume a log Gaussian process prior on . The first comes from the work by Lan et al. [2015]. They implement a number of Markov chain Monte Carlo (MCMC) algorithms for inferring effective population size trajectories from a fixed genealogy. They compare different algorithms’ computational efficiency and MCMC diagnostics.
The second methodology comes from the work by Palacios and Minin [2012] and Karcher et al. [2016]. They target the same posterior as in [Lan et al., 2015], but implement an integrated nested Laplace approximation (INLA) based approach. Utilizing INLA allows for a significant computational speedup at the cost of only having access to the latent parameters’ approximate marginal distributions (as opposed to MCMC algorithms which approximate the full joint distribution). Karcher et al. [2016] have an additional focus of accounting for potential preferential sampling, which incorporates a likelihood relating the sampling times of the genealogy to the effective population size trajectory.
The last methodology comes from the work by Palacios et al. [2015]. They implement an MCMC algorithm for inferring effective population size trajectories from a sequence of local genealogies. Here, genealogies are correlated and are assumed to be a realization of the sequentially Markov coalescent (SMC′) [Marjoram and Wall, 2006].
An R package phylodyn encapsulates all the above work. We integrated all of the above methods in a unified user-friendly format, added detailed tutorials, included more features such as simulation of genealogies from the coalescent model that accepts arbitrary but positive effective population size function [Palacios and Minin, 2013], and added features for data manipulation and interaction with other data formats such as BEAST-XML [Drummond et al., 2012]. These features greatly expand available phylodynamics methods in R. For example, the R package ape [Paradis et al., 2004] has a function skyline that implements the generalized skyline method for isochronous genealogies. To the best of our knowledge, no other R package infers effective population size trajectories from heterochronous genealogies. Other R packages for simulation of genealogical data exist (e.g. phyclust [Chen, 2011] and ape) but they are limited to very specific demographic scenarios such as piece-wise constant and exponential growth functions. Our addition of inference from a sequence of local genealogies expands phylodyn to a broader class of models that have not been implemented in the previous versions of the package.
Functionality
Genealogical simulation
A genealogy is a rooted bifurcating tree with labeled tips. Branching events are called coalescent events which occur at coalescent times, and tips are located at sampling times. Given a vector of sampling times and an effective population size function , Kingman’s coalescent provides the following likelihood of observing a particular genealogy with coalescent times :
where , is the number of lineages present during time interval , and is a time interval defined by coalescent times and sampling times and is a time interval that ends at coalescent time . See [Lan et al., 2015] for notational details. The coalsim function simulates coalescent times according to this distribution, given a vector of sampling times and an arbitrary effective population size function traj(t). The function gives the option of using a time-transformation method or a thinning method for simulating the coalescent times. The time-transformation method scales better but involves numerical integration, while the thinning method is faster with few samples and is an exact method. The generate_newick function takes the output generated with coalsim and returns the corresponding genealogy in ape’s phylo format [Paradis et al., 2004]. We are not aware of another R package that allows for simulating the coalescent process while allowing for arbitrary sampling times as well as arbitrary positive effective population size trajectories. phylodyn also provides functionality for easily simulating sampling times under preferential sampling according to an arbitrary positive function . The pref_sample function simulates sampling times according to an inhomogeneous Poisson process with intensity , where parameters and control the expected number of sampled sequences and the strength of preferential sampling, respectively. Currently the function only allows a thinning method, but a time-transformation method is forthcoming.
Markov chain Monte Carlo methods
Following the approach of Gill et al. [2013] and Palacios and Minin [2012], Lan et al. [2015] approximate by a piece-wise linear function , defined over a regular grid with end points , where equals the most recent sampling time, and , the time when the last two lineages coalesce. Hence, we seek to estimate the posterior
| (1) |
where is the coalescent likelihood, is a Gaussian process prior on with precision , and is a Gamma hyperprior on . Our implementation assumes a Gaussian process prior on with inverse covariance function , where corresponds to a modified inverse covariance matrix of Brownian motion (see [Lan et al., 2015] for details).
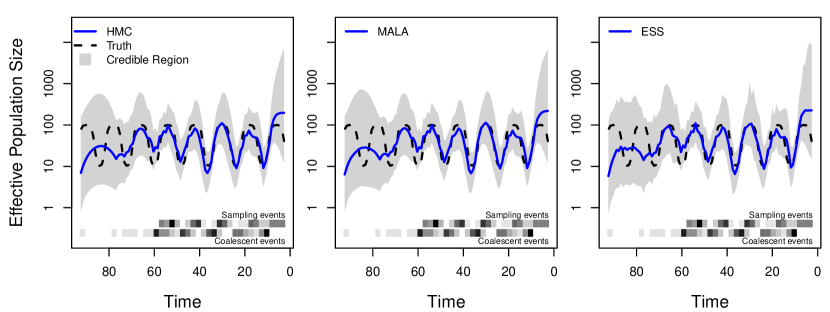
The mcmc_sampling function implements a variety of MCMC algorithms for estimating the posterior (1), given the sufficient statistics for a genealogy (sampling times and coalescent times). Available methods are Hamiltonian Monte Carlo (HMC) [Duane et al., 1987, Neal, 2011], split HMC [Leimkuhler and Reich, 2004, Neal, 2011, Shahbaba et al., 2014], Metropolis-adjusted Langevin algorithm (MALA) [Roberts and Tweedie, 1996], adaptive MALA [Knorr-Held and Rue, 2002], and Elliptical Slice Sampler (ESS) [Murray et al., 2010]. For a comparison of the computational efficiency of the different methods see [Lan et al., 2015].
We illustrate phylodyn’s capabilities with a simulation example. We let have a seasonal boom-and-bust trajectory (provided by the logistic_traj function), and we simulate a sequence of sampling times according to an inhomogeneous Poisson process with intensity proportional to using the pref_sample function. We simulate a genealogy from the coalescent using the coalsim function, and supply it to the different sampling algorithms of the mcmc_sampling function. We summarize the results in Figure 1.
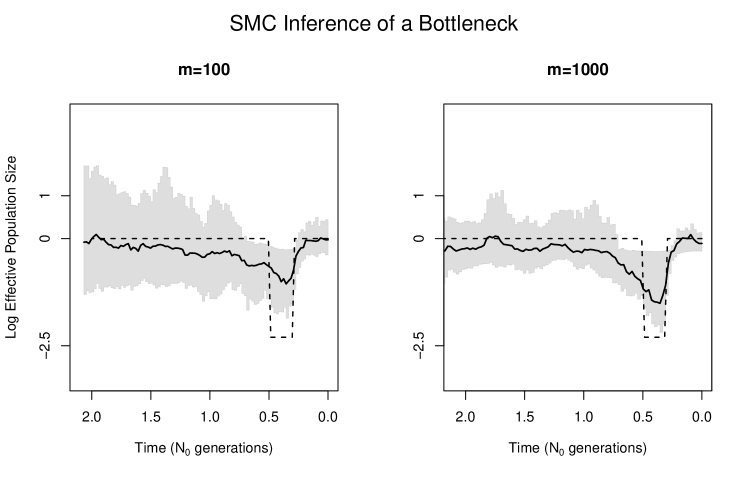
Palacios et al. [2015] infer from a sequence of local genealogies under the SMC’ model [Marjoram and Wall, 2006]. The SMC’ process is an approximation to the ancestral recombination graph (ARG) which models the set of ancestral relationships and recombination events of multilocus sequences [Griffiths and Marjoram, 1997]. In our implementation, we assume that our data consist of a sequence of genealogies that represent the ancestral relationships at consecutive loci separated by recombination events. These consecutive genealogies are modeled as a continuous-time Markov chain along a chromosomal segment. Here, we also approximate by the piece-wise linear function and rely on split HMC [Shahbaba et al., 2014] to sample from the posterior:
| (2) |
where is the sequentially Markov coalescent likelihood [Palacios et al., 2015]. Our mcmc_smc function samples from the posterior distribution (2). Figure 2 shows our estimate of from 100 and 1000 local genealogies of individuals simulated under a bottleneck demographic scenario. Palacios et al. [2015] show that our method recovers the bottleneck best when increasing the number of local genealogies.
INLA-based methods
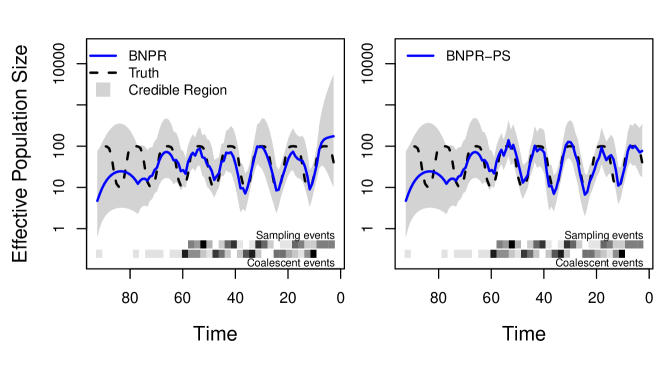
We implement the INLA-based methods of Palacios and Minin [2012] and Karcher et al. [2016], using the same log-Gaussian prior on as in the MCMC methods. The BNPR function implements the INLA approximation to obtain posterior medians and 95% Bayesian credible intervals (BCIs) of . Being a numerical approximation, this method runs extremely quickly. However, the method only estimates the marginals of the posterior of the effective population size and hyperparameters, rather than the full joint posterior distribution of MCMC-based methods. This is frequently sufficient for most purposes involving phylodynamic inference, but offers significant improvement in computational efficiency.
We also implement the BNPR-PS method of Karcher et al. [2016]. In cases where the frequency of sampling times is related to effective population size, including a sampling time model provides additional accuracy and precision. We model the sampling times as an inhomogeneous Poisson process with intensity proportional to a power of the effective population size, with the following log-likelihood:
This leads to the posterior that conditions on both coalescent and sampling times:
| (3) |
To illustrate, we use the same genealogy under seasonal boom-and-bust population size trajectory as in Figure 1. We apply BNPR and BNPR-PS to this genealogy, and summarize the results in Figure 3. Since our sampling times and genealogy were simulated with preferential sampling, we notice improved performance from BNPR-PS, which correctly models the sampling times.
Discussion
Phylodynamic inference aims to enhance our understanding of infectious disease dynamics that involves a combination of evolutionary, epidemiological, and immunological processes [Grenfell et al., 2004]. Although phylodynamic methods have been developed and successfully employed over the last 15 years, there are still many challenges in extending these methods to incorporate different types of information and evolutionary complexities of certain pathogens [Frost et al., 2015]. The tools developed in phylodyn currently concentrate on estimation of population dynamics from genealogical and sampling information — a subset of phylodynamics problems. Phylodynamic inference from sequence data alone is challenging because the state spaces of genealogies and effective population size trajectories are large. The MCMC tools implemented in phylodyn allow for an efficient exploration of the state space of effective population size trajectories when either a single genealogy is available or multiple local sequential genealogies are available. Future implementation in phylodyn will involve the exploration of the joint space of genealogies, population size trajectories and other epidemiological processes. We envision that the increasing popularity of R will allow researchers to integrate different packages with phylodyn. For instance, phylodyn can be used in combination with the R package coalescentMCMC to account for genealogical uncertainty. In addition, our coalescent simulation functions should be of interest to a wide range of users of the coalescent.
References
- Chen [2011] W.C. Chen. Overlapping Codon Model, Phylogenetic Clustering, and Alternative Partial Expectation Conditional Maximization Algorithm, 2011. URL http://gradworks.umi.com/34/73/3473002.html.
- Drummond et al. [2002] A. J. Drummond, G. K. Nicholls, A. G. Rodrigo, and W. Solomon. Estimating mutation parameters, population history and genealogy simultaneously from temporally spaced sequence data. Genetics, 161(3):1307–1320, 2002.
- Drummond et al. [2005] A. J. Drummond, A. Rambaut, B. Shapiro, and O. G. Pybus. Bayesian coalescent inference of past population dynamics from molecular sequences. Molecular Biology and Evolution, 22(5):1185–1192, 2005.
- Drummond et al. [2012] A. J. Drummond, M. A. Suchard, D. Xie, and A. Rambaut. Bayesian phylogenetics with BEAUti and the BEAST 1.7. Molecular Biology and Evolution, 29:1969–1973, 2012.
- Duane et al. [1987] S. Duane, A. D. Kennedy, B. J. Pendleton, and D. Roweth. Hybrid Monte Carlo. Physics letters B, 195(2):216–222, 1987.
- Frost et al. [2015] Simon D W Frost, Oliver G Pybus, Julia R Gog, Cecile Viboud, Sebastian Bonhoeffer, and Trevor Bedford. Eight challenges in phylodynamic inference. Epidemics, 10:88–92, March 2015.
- Gill et al. [2013] M. S. Gill, P. Lemey, N. R. Faria, A. Rambaut, B. Shapiro, and M. A. Suchard. Improving Bayesian population dynamics inference: a coalescent-based model for multiple loci. Molecular Biology and Evolution, 30(3):713–724, 2013.
- Grenfell et al. [2004] B. T. Grenfell, O. G. Pybus, J. R. Gog, J. L. N. Wood, J. M. Daly, J. A. Mumford, and E. C. Holmes. Unifying the epidemiological and evolutionary dynamics of pathogens. Science, 303(5656):327–332, 2004.
- Griffiths and Tavaré [1994] R. C. Griffiths and S. Tavaré. Sampling theory for neutral alleles in a varying environment. Philosophical Transactions of the Royal Society of London. Series B: Biological Sciences, 344(1310):403–410, 1994.
- Griffiths and Marjoram [1997] R.C. Griffiths and P. Marjoram. An ancestral recombination graph. In Peter Donnelly and Simon Tavaré, editors, Progress in population genetics and human evolution, volume 87 of IMA Volumes in Mathematics and Its Applications, pages 257–270. Springer Verlag, New York, 1997.
- Ho and Shapiro [2011] S. Y. W. Ho and B. Shapiro. Skyline-plot methods for estimating demographic history from nucleotide sequences. Molecular Ecology Resources, 11(3):423–434, 2011.
- Holmes and Grenfell [2009] E. C. Holmes and B. T. Grenfell. Discovering the phylodynamics of RNA viruses. PLoS Computational Biology, 5(10):e1000505, 2009.
- Karcher et al. [2016] M. D. Karcher, J. A. Palacios, T. Bedford, M. A. Suchard, and V. N. Minin. Quantifying and mitigating the effect of preferential sampling on phylodynamic inference. PLoS Computational Biology, 12:e1004789, 2016.
- Kingman [1982] J. F. C. Kingman. The coalescent. Stochastic Processes and Their Applications, 13(3):235–248, 1982.
- Knorr-Held and Rue [2002] Ll Knorr-Held and H. Rue. On block updating in Markov random field models for disease mapping. Scandinavian Journal of Statistics, 29(4):597–614, 2002.
- Kuhner et al. [1998] M. K. Kuhner, J. Yamato, and J. Felsenstein. Maximum likelihood estimation of population growth rates based on the coalescent. Genetics, 149(1):429–434, 1998.
- Lan et al. [2015] S. Lan, J. A. Palacios, M. D. Karcher, V. N. Minin, and B. Shahbaba. An efficient Bayesian inference framework for coalescent-based nonparametric phylodynamics. Bioinformatics, 31:3282–3289, 2015.
- Leimkuhler and Reich [2004] B. Leimkuhler and S. Reich. Simulating Hamiltonian dynamics, volume 14. Cambridge University Press, 2004.
- Marjoram and Wall [2006] P. Marjoram and J. Wall. Fast “coalescent” simulation. BMC Genetics, 7(1), 2006.
- Minin et al. [2008] V. N. Minin, E. W. Bloomquist, and M. A. Suchard. Smooth skyride through a rough skyline: Bayesian coalescent-based inference of population dynamics. Molecular Biology and Evolution, 25(7):1459–1471, 2008.
- Murray et al. [2010] I. Murray, R.P. Adams, and D. Mackay. Elliptical slice sampling. In International Conference on Artificial Intelligence and Statistics, pages 541–548, 2010.
- Neal [2011] R. M. Neal. MCMC using Hamiltonian dynamics. In S. Brooks, A. Gelman, G. Jones, and X.L. Meng, editors, Handbook of Markov Chain Monte Carlo, pages 113–162. CRC Press, 2011.
- Palacios and Minin [2012] J. A. Palacios and V. N. Minin. Integrated nested Laplace approximation for Bayesian nonparametric phylodynamics. In Proceedings of the Twenty-Eighth International Conference on Uncertainty in Artificial Intelligence, pages 726–735, 2012.
- Palacios and Minin [2013] J. A. Palacios and V. N. Minin. Gaussian process-based Bayesian nonparametric inference of population size trajectories from gene genealogies. Biometrics, 69(1):8–18, 2013.
- Palacios et al. [2015] J. A. Palacios, J. Wakeley, and S. Ramachandran. Bayesian nonparametric inference of population size changes from sequential genealogies. Genetics, page 115, 2015.
- Paradis et al. [2004] E. Paradis, J. Claude, and K. Strimmer. APE: analyses of phylogenetics and evolution in R language. Bioinformatics, 20:289–290, 2004.
- Roberts and Tweedie [1996] G. O. Roberts and R. L. Tweedie. Exponential convergence of Langevin distributions and their discrete approximations. Bernoulli, pages 341–363, 1996.
- Shahbaba et al. [2014] B. Shahbaba, S. Lan, W. O. Johnson, and R. M. Neal. Split Hamiltonian Monte Carlo. Statistics and Computing, 24(3):339–349, 2014.
Data Accessibility
phylodyn is available at https://github.com/mdkarcher/phylodyn. Installation instructions are provided in the README file. Several vignettes have been included to walk users through the standard workflow, as well as a number of example datasets from the papers that introduced the methods included in the R package.