Gas and stellar spiral arms and their offsets in the grand-design spiral galaxy M51
Abstract
Theoretical studies on the response of interstellar gas to a gravitational potential disc with a quasi-stationary spiral arm pattern suggest that the gas experiences a sudden compression due to standing shock waves at spiral arms. This mechanism, called a galactic shock wave, predicts that gas spiral arms move from downstream to upstream of stellar arms with increasing radius inside a corotation radius. In order to investigate if this mechanism is at work in the grand-design spiral galaxy M51, we have measured azimuthal offsets between the peaks of stellar mass and gas mass distributions in its two spiral arms. The stellar mass distribution is created by the spatially resolved spectral energy distribution fitting to optical and near infrared images, while the gas mass distribution is obtained by high-resolution CO and HI data. For the inner region (), we find that one arm is consistent with the galactic shock while the other is not. For the outer region, results are less certain due to the narrower range of offset values, the weakness of stellar arms, and the smaller number of successful offset measurements. The results suggest that the nature of two inner spiral arms are different, which is likely due to an interaction with the companion galaxy.
keywords:
galaxies: individual (M51 or NGC5194) – galaxies: spiral – galaxies: structure1 Introduction
The nature of stellar and gaseous spiral arms in galactic discs has been studied about 50 years and is still being discussed actively. In order to avoid the winding problem, in which differentially rotating spiral arms quickly become too tightly wound to hold the spiral structure, Lin & Shu (1964) proposed a density wave hypothesis, in which the spiral pattern is a density wave propagating the disc and is a quasi-stationary structure for at least several rotations, i.e. Gyr. Based on this hypothesis, Fujimoto (1968) and Roberts (1969) calculated a non-linear response of interstellar gas in a gravitational potential with a fixed spiral arm structure. Assuming isothermal gas with tightly wound spiral arms, they found a shock front appears upstream of the potential minima if the spiral arm perturbation is strong enough. Their results agree well with the observational fact that typical width of gas or dust in spiral arms is usually much narrower than that of the stellar mass seen in near-infrared images. Furthermore, a sharp increase of gas density at the shock front is recognized as a trigger of star formation in spiral arms. This picture, i.e., the gas response under a fixed or quasi-stationary spiral potential, is called galactic shock wave theory. In the case of tightly wound stellar spiral arms, Woodward (1975) presented that the galactic shocks appear within a few 100 Myr. This result suggests that the galactic shock needs a spiral potential to be stationary for more than this time-scale.
Since these pioneering works, many theoretical studies have been done to calculate the gas response for a fixed potential with different conditions and assumptions. In this paper, we call such models as steady spiral models. In the case of isothermal gas with tightly wound spiral arms, Gittins & Clarke (2004) presented that the shock front should move monotonically from downstream to upstream with increasing radius. This trend holds inside the corotation resonance, i.e. where gas and stars rotate faster than the spiral pattern. A similar trend is found in other cases with more open spiral arms (Kim & Kim, 2014; Baba et al., 2015) and with magnetic field (Martínez-García et al., 2009). This trend is likely because that a relative velocity between gas and a spiral pattern depends on radius, and thus should be an universal and model-independent characteristic of the galactic shock wave. The effect of gas self gravity to the shock location has also been investigated. Some studies based on one dimensional (1D) calculations suggested that a higher gas fraction, i.e. a stronger self gravity, pushes the gas peak downstream (Lubow et al., 1986; Kim & Ostriker, 2002; Lee, 2014). Furthermore, these studies claimed that the galactic shock is not formed when the gas density is too high. Meanwhile, recent two dimensional (2D) calculations by Baba et al. (2015) presented that gas peak positions with and without self gravity do not significantly differ when the potential is fixed. This might be because that models are different (e.g. 1D vs 2D), shift due to self gravity is too small, and/or stellar feedback included in Baba’s model counteracts with self gravity. Therefore, how gas self gravity changes the gas peak positions is not clear yet.
On the other hand, recent numerical simulations for dynamic stellar discs have suggested that spiral structures in isolated galaxies are multi-armed and not stationary (e.g. Fujii et al., 2011; Baba et al., 2013). In this paper, we call such models as dynamic spiral models. In these cases, spiral patterns almost corotate with the materials, and thus a relative velocity of gas to the pattern is small compared to the case of steady spiral models. As a result, no systematic offsets are seen in these simulations (Dobbs & Bonnell, 2008; Wada et al., 2011; Baba et al., 2015). For interacting galaxies, Dobbs et al. (2010) and Struck et al. (2011) studied a time evolution of disc structures. While the lifetime of spiral arms was longer ( a few 100 Myr) compared to isolated galaxies, no systematic offsets were found between gas and stellar arms. Pettitt et al. (2016) also investigated tidally interacting galaxies with a wider range of parameters, and found that gas arms appear slightly upstream of stellar arms for a few 100 Myr, when the spiral arm structure is enhanced due to the interaction. For more details of theoretical calculations on spiral structures, see a recent review by Dobbs & Baba (2014).
As described above, theoretical studies suggested that the radial trends of gas-star offsets differ between the two spiral models. To clarify the difference, here we summarize the results of Baba et al. (2015) who investigated the location of gas and stellar spiral arms, by performing high resolution simulations of steady and dynamic spiral models. For steady spiral models, stellar spiral arms were assumed to be a rigidly-rotating potential. They ran four hydrodynamic simulations with parameters in combination of two pitch angles ( and ), two spiral arm strengths (2% and 5%), and with or without gas self gravity. Similarly to the aforementioned steady spiral models, gas spiral arms appear downstream of stellar spiral arms at inner radii and move to upstream at outer radii. While absolute offset values vary with adopted parameters, this radial trend itself does not change. For dynamic spiral models, they simulated a MW-like galaxy with -body/hydrodynamic calculations including gas self gravity. During the course of the simulation, a bar in the centre developed. On average, spiral arms are more open (–) and stronger (%–8%) than in the steady spiral cases. Similarly to the other dynamic spiral models, gas spiral arms appear very close to the stellar spiral arms. No systematic offsets between the gas and stellar arms are found, and the situation does not depend on whether there is the bar or not. From these results for steady and dynamic spiral models, the authors claimed that the steadiness of spiral arms is the key to the offset dependence on radius. In other words, the radial dependence of gas-star offsets is suggested to be a useful observational tool to distinguish steady and dynamic spiral arms.
Based on this theoretical suggestion, we measure the gas-star offsets from the location of gas density peaks relative to stellar density peaks, both of which are estimated from observational data sets. The goal of this study is to investigate if gas spiral arms shift from downstream to upstream with increasing radius, as predicted by the steady spiral and galactic shock models.
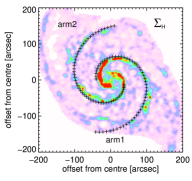
A prototypical grand-design spiral galaxy, M51 (or NGC 5194), is selected as a target because the arm to interarm contrast has been known to be large at a wide range of wavelength. The large contrast in stellar potential is necessary to form shock waves while that in gas density indicates the shock likely exists. This galaxy is also known as the whirlpool galaxy and is interacting with a companion galaxy, M51b or NGC 5195. We adopt parameters of M51 used in Egusa et al. (2013) and list them in Table 1. Their notation of two spiral arms, arm1 being to extend to the opposite side of M51b and arm2 being connected to M51b, is also adopted.
| R.A. (J2000) | |
|---|---|
| Decl. (J2000) | |
| P.A. | |
| Incl. | |
| Distance | 8.4 Mpc |
2 Data & analysis
2.1 Total H gas density
For atomic H gas, the integrated intensity map of the HI 21cm emission has been obtained from Walter et al. (2008), whose angular resolution (full width at half maximum (FWHM) of a gaussian beam) is . For molecular H2 gas, the integrated intensity map of the 12CO(1–0) emission has been obtained from Koda et al. (2009), whose angular resolution is . The factor [H2/cm2/(K km/s)] has been adopted to convert the CO integrated intensity into the H2 gas surface density. Discussion about a variation of this factor is given in Appendix A.1.
Both maps have been convolved with 2D gaussian profiles and then regridded so that the angular resolution become ( pc at the distance of M51) and the pixel size become . We have calculated the total surface density of H, , by adding these two maps using the conversion factor. As already presented by Koda et al. (2009), is dominated by the H2 gas for most of the M51 disc. The ionized gas and warm H2 gas components are neglected in this study.
2.2 Stellar mass density
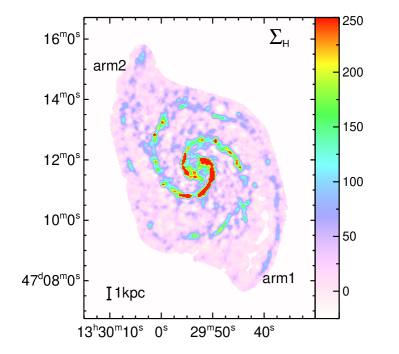
Mentuch Cooper et al. (2012) created a spatially resolved map of the stellar mass distribution in M51 by fitting spectral energy distribution (SED) models to optical through near-infrared data. While the original angular resolution of the data presented in their paper was to match the lower resolution of infrared data, here we use a modified analysis at higher spatial resolution of and limit our interest to the stellar mass distribution within the galaxy. Plausible MW stars have been identified and masked out. The map of stellar mass surface density, , has also been smoothed and regridded to match the map. These images are presented in Figure 1.
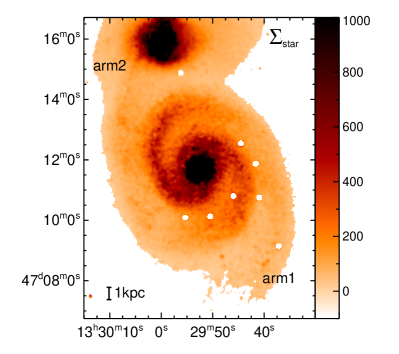
While the map resembles near-infrared (e.g. -band) images, it is more reliable as the near infrared luminosity can still be affected by young stars and interstellar dust features, and thus the mass-to-luminosity ratio is not constant. Effect of attenuation to is discussed in Appendix A.2.
2.3 Phase diagrams
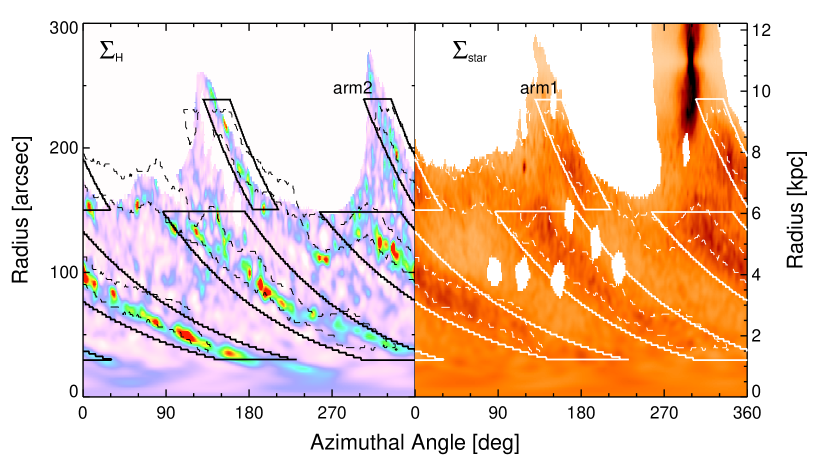
The matched images have been deprojected to a face-on view and then transformed into the polar grid, i.e. (radius, azimuthal angle) , coordinates. Parameters listed in Table 1 have been used in this transformation. We show these phase diagrams in Figure 2. The azimuthal angle starts at the eastern side of the minor axis (i.e. P.A. ) and increases counter-clock wise, which is the same direction of the material flow assuming trailing arms. As a consequence, a larger azimuthal angle corresponds to the downstream side inside the corotation resonance.
2.4 Arm definition
In order to avoid picking up peaks in interarm regions, we define arm regions based on the position of stellar arms. As an initial step, the arm definition from Egusa et al. (2013), which is based on a stellar brightness map from Mentuch Cooper et al. (2012), is adopted. This definition is presented by the thin dashed contours in Figure 2. We regrid the phase diagram so that the radial interval becomes and create azimuthal profile at each radius. For each arm, the peak of the profile within the defined arm region is identified at each radius.
We then fit a logarithmic spiral
to the peak positions, assuming the pitch angle is constant. Since both of the two arms in M51 show a break/kink at , inner () and outer () arms are fitted separately, i.e. four individual fittings are performed. We define arm regions as within the azimuthal range of (inner) or (outer) from the stellar logarithmic spiral arms. These azimuthal ranges are determined so that they include major peak positions seen in the and phase diagrams. This new arm definition is indicated by thick solid contours in Figure 2. The arm1 starts and ends at an azimuthal angle of , while arm2 starts and ends at . Dependence of results on this arm definition is discussed in Appendix B.
2.5 Locating peaks
Here we describe how we define the location of and peaks from their azimuthal profiles using two different methods. As for , azimuthal profiles are created at radial interval.
2.5.1 Finding peaks
Similarly to §2.4, we locate peaks of azimuthal profiles within the new arm regions at each radial bin. We confirm that stellar peak positions are consistent between the initial and new arm definitions except for the inner- and outer-most regions and around the break. By definition, this method is very sensitive to local peaks. One caveat is that it could pick up false peaks due to noises.
The logarithmic spiral fitting is performed again to these and peak positions. The best-fitting pitch angles are listed in Table 2. Our results for inner gas arms are consistent with Miyamoto et al. (2014), who derived for – from the 12CO(1–0) map of M51 obtained with the NRO45m telescope.
| inner arms: – | ||
|---|---|---|
| gas | star | |
| arm1 | ||
| arm2 | ||
| outer arms: – | ||
| gas | star | |
| arm1 | ||
| arm2 | ||
2.5.2 Fitting Gaussian profiles
Dobbs et al. (2010) fit two-gaussian profiles to azimuthal profiles of simulated gas and stellar disc in order to locate two spiral arms at a radial interval of 1 kpc. We basically follow their procedure except that we use the radial interval of . If fitted peaks fall outside the defined arm regions, we exclude them from the following analysis. Widths of stellar and gas spiral arms from the fitting are presented in §3.1 and 3.2, respectively, and are used to estimate uncertainties in offset measurements (§3.3.1). Compared to the peak-finding method, it is more sensitive to broader profiles. One caveat is that this fitting may not be appropriate when azimuthal profiles are not symmetric.
2.5.3 Comparison
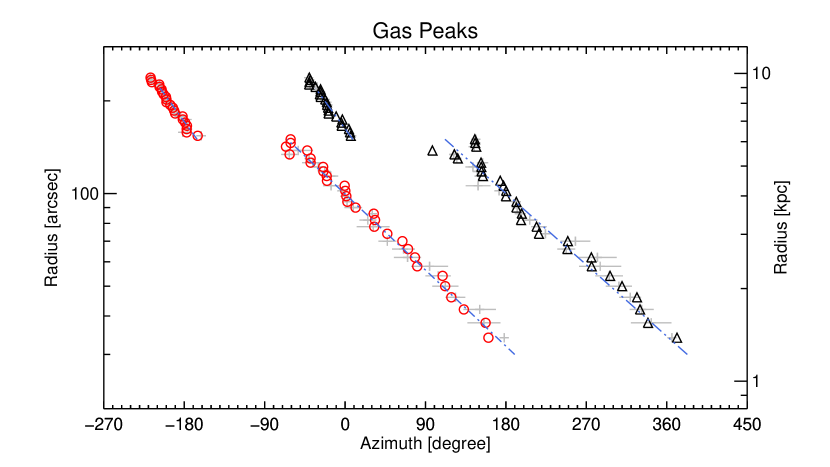
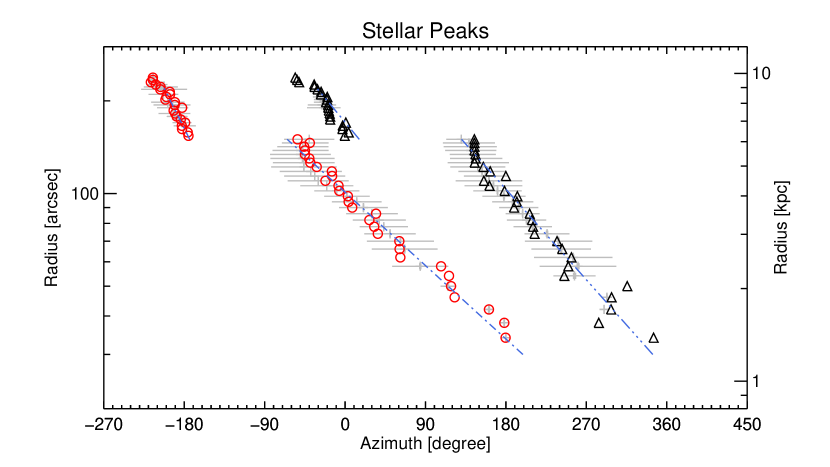
An example of azimuthal profiles at a radial bin of – is shown in Figure 3. The arm regions at this radius are indicated by the blue vertical dashed lines. The solid arrows indicate identified peaks within the arm regions, while the red dashed-dotted curves present fitted gaussian profiles. Overall comparison with the peak-finding method and gauss-fit method is presented in Figure 4, together with the log-spiral fit. Note that in this figure the spiral arms are unwrapped and thus the azimuthal range is from to . In addition, radius is in logarithmic scale. The fitted logarithmic spirals are indicated by blue dot(s)-dashed lines. The identified peaks are plotted by open circles and triangles for arm1 and arm2, respectively. The results of gaussian fitting is presented by gray horizontal crosses. The length of thin horizontal bars correspond to the width () of fitted gaussian profiles. Thick bars indicate the uncertainty of the peak position but they are generally too small to be visible in this plot. From these two figures, we find that the above two methods give generally consistent arm locations.

2.6 Measuring offsets
We define offsets as azimuth(H gas)azimuth(star), so that the gas shock at a leading side of the stellar peak should result in a negative offset. Inside the corotation resonance, the leading side corresponds to the upstream side.
For each of the peak locating methods, we measure offsets from all peak positions. In addition, we identify “matched peaks” where difference between the peaks from the two methods is smaller than the of the fitted gaussian profile, i.e. the arm width.
Uncertainties in measured offsets are estimated in §3.3.1.
3 Results
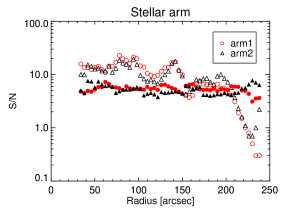
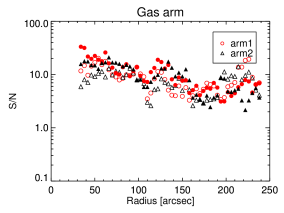
In this section, we first present an overview of stellar and gas spiral arms in §3.1 and 3.2, respectively, focusing on the signal-to-noise (S/N) ratio of identified peaks and on the spiral arm width. The former is estimated by the ratio of peak brightness to RMS in interarm regions at each radius, while the latter is measured from the gaussian fitting (§2.5.2). For gas spiral arms, their locations are compared with a prediction by the galactic shock models. In §3.3, the gas-star offsets and their radial dependence are presented. We also discuss how results depend on the two peak locating methods. Offset dependence on the self-gravity strength is given in Appendix C.
3.1 Stellar spiral arms
The S/N is estimated to be for inner arms, while is for outer arms (Figure 5, left, open symbols). We find S/N becomes for , which is due to smaller interarm area with available data and to this area being affected by the brightness of the companion galaxy. This outermost region is thus excluded from the following analysis. In addition, we estimate the S/N at peak positions from the stellar mass surface density and its uncertainty at lower () resolution derived by Mentuch Cooper et al. (2012), because the uncertainty map at resolution is not available. These S/N values are presented by the filled symbols in the left panel of Figure 5, and are almost constant () across the current radial range.
Typical arm widths in azimuthal angle are degree (FWHM) for inner arms and degree for outer arms. They are generally larger than those of gas spiral arms (Figure 4, thin gray horizontal bars).
3.2 Gas spiral arms
The S/N is estimated to be between 3 and 20 (Figure 5, right, open symbols), and has a weak trend of decreasing with radius. While gas arms appear more prominent than stellar arms, their S/N values do not differ significantly. This is probably due to the interarm structures (e.g. feathers) only remarkable at map. In addition, we estimate the S/N at peak positions from the CO integrated intensity map and its uncertainty, because the uncertainty map for HI is not available. These S/N values are presented by the filled symbols in the right panel of Figure 5, and are consistent with those estimated from the peak/rms ratio.
Typical arm widths in azimuthal angle are degree (FWHM) for inner arms and degree for outer arms. They are generally smaller than those of stellar spiral arms (Figure 4, thin gray horizontal bars).
3.2.1 Comparison with model-predicted locations
In the case of galactic shock waves, gas spiral arms are expected to move from downstream to upstream with increasing radius inside the corotation. While this radial trend itself does not change, absolute offset values between the gas and stellar arms depend on models and parameters. Azimuthal offsets predicted by Gittins & Clarke (2004) range from to 0 degree and monotonically decrease with radius. Here we take the result of Baba et al. (2015) for comparison and adopt the strong spiral arm (“F05” in their model names) cases, since they are more suitable for M51 than the weak spiral case. The panels (B)–(D) of their Figure 2 present that gas peak positions do not significantly differ between the models. The offset appears to linearly depend on radius and moves from to with increasing radius from 1 kpc to 9 kpc. Here we assume that this dependence should scale with the corotation radius (), which is set to be 10 kpc in the models. Given that their the definition of offset direction is opposite to that in this paper, we adopt offset(gas-star) degree within the range of –, as a prediction of the galactic shock waves.
For M51, there are many estimates of the corotation radius, most of which can be categorized into three:111 A recent study on gas dynamics suggests the corotation at (Querejeta et al., 2016). We do not include this possibility as galactic shock models outside the corotation are not available. (i) – (Tully, 1974; Elmegreen et al., 1992; Vogel et al., 1993), (ii) – (Garcia-Burillo et al., 1993; Egusa et al., 2009), and (iii) (Kuno et al., 1995; Oey et al., 2003). The former two correspond to just inside and outside the break of spiral arms, while the latter corresponds to the location of the companion galaxy. Furthermore, Meidt et al. (2008) suggested that the pattern speed in M51 may decrease with radius and that no corotation appears within the disk. We here test three constant cases, taking into account the area only inside each corotation radius.
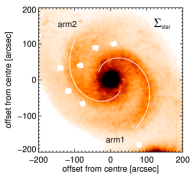
The stellar arm positions are defined by the results of logarithmic spiral fitting performed to define the arm regions in §2.4. These log-spiral arms are presented in the left panel of Figure 6, together with the deprojected map. Based on this stellar arm positions and three estimates (, , and ), predicted positions of gas arms are presented in the middle panel. The maximum radial extent of gas arms are set to be the smaller one of and . We find that arm2 is consistent with the galactic shock wave with , while arm1 cannot be explained by any of the three cases (Figure 6, right).

3.3 Offsets between gas and stellar spiral arms
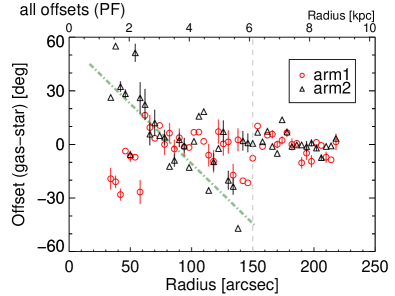
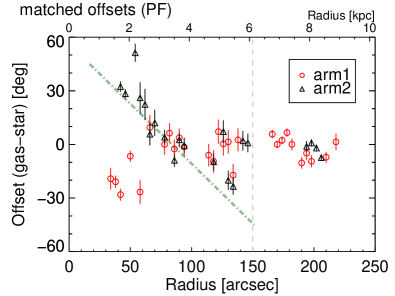
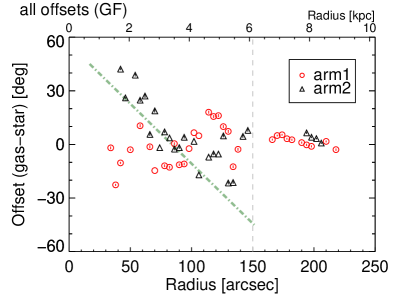
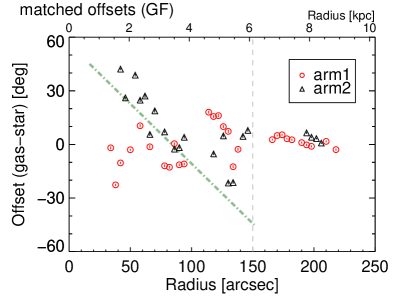
In Figure 7, we plot offsets against radius for both peak-finding (top) and gauss-fit (bottom) methods. Right panels are for offsets between the matched peaks only. Red circles and black triangles indicate arm1 and arm2, respectively. As the azimuthal angle is defined to increase with the same direction of galactic rotation, a negative offset corresponds to a gas peak at the leading (upstream if inside the corotation) side of a stellar peak. Vertical error bars are uncertainties in measured offsets estimated based on S/N and arm widths, which are explained in §3.3.1. Since the arm widths are measured in the gaussian fitting (§2.5.2), these error bars are available only for offsets between matched peaks. Vertical dashed line at indicates the border between inner and outer arms. Light green dot-dashed lines represent the model prediction from Baba et al. (2015) as described in §3.2.1 with . From this plot, it is clear that the offset distribution is different for arm1 and arm2 as well as for the inner and outer regions. We find that this trend does not change depending on the methods. Most notable correlation is that offsets decrease with radius for inner arm2, which is consistent with the galactic shock wave.
3.3.1 Uncertainty in offset measurements
In order to estimate uncertainty in measured offsets, we first simulate observations by the following steps: (1) create a map of random noise with a pixel size of (or 82 pc), which is the same with and maps. (2) add a source with a 2D gaussian shape at (or 4.1 kpc). (3) convolve the map with the 2D gaussian with FWHM of , which is the matched PSF size used in this study. Free parameters of these procedures are the peak signal-to-noise ratio (S/N) and size of the source.
We then apply the same analysis described in §2.5 to a simulated image and measure an azimuthal difference between identified and original peak positions. This process is repeated 1000 times and a histogram of the azimuthal difference is created. We fit a gaussian profile to this histogram and define of the fitted gaussian as the uncertainty in locating peaks.
From this simulation, we find that
for the peak-finding method described in §2.5.1. For the gaussian-fitting method (§2.5.2), the uncertainty is about 10 times smaller. We should note here that this is calculated for peak positions of gas and stars separately. The uncertainty in offset values is thus should be . From S/N values derived in §3.1 and 3.2, we assume at all radii for both and maps. Arm widths measured during the gaussian fitting to profile peaks (§2.5.2) are adopted as the azimuthal source width. For offsets between matched peaks, error bars with half-length of are added to the plot. This uncertainty is also used when calculating uncertainties of the correlation coefficients (§3.3.2). We should note that this uncertainty is likely underestimate, because it is based on idealized simulations and does not include any systematic errors which are discussed in Appendix A.
3.3.2 Cross correlation coefficient
In order to test if the offset distribution in M51 is consistent with the galactic shock models, we calculate Spearman’s correlation coefficient for offsets and radius of each arm, inner and outer arms separately. As well as the coefficient for all the offsets between all the peaks located by each method, that for offsets between matched peaks are calculated. Since the latter has its uncertainty estimated from the arm width and S/N (§3.3.1), variations of the correlation coefficient due to this uncertainty are also calculated. We should again note here that this uncertainty is likely underestimate. All of these values are listed in Table 3 together with the number of offsets used for calculation.
| offsets from peak finding method | ||||||
|---|---|---|---|---|---|---|
| radial range | arm1 | arm2 | both arm | |||
| all | matched | all | matched | all | matched | |
| inner (–) | (30) | (18) | (30) | (17) | (60) | (35) |
| outer (–) | (17) | (10) | (17) | NA (4) | (34) | (14) |
| all | (47) | (28) | (47) | (21) | (94) | (49) |
| offsets from gaussian fit method | ||||||
| radial range | arm1 | arm2 | both arm | |||
| all | matched | all | matched | all | matched | |
| inner (–) | (22) | (18) | (23) | (17) | (45) | (35) |
| outer (–) | (10) | (10) | NA (4) | NA (4) | (14) | (14) |
| all | (32) | (28) | (27) | (21) | (59) | (49) |
| Note: numbers in parentheses are the number of data used to calculate the coefficient. | ||||||
As already seen in Figure 7, dependence on method is not significant. The largest difference is for inner arm1, where the coefficient for all offsets from peak finding is , while that for all offsets from gauss fit and for matched offsets is –. Other arm segments, i.e. inner arm2 and outer arms, show negative coefficients, which is consistent with the galactic shock models. Among them, result for inner arm2 is most robust, as the number of measurements is largest and difference between the methods is small. This distribution may indicate an existence of corotation at , as already shown in §3.2. Relationships for outer arms are more uncertain due to offset values close to zero, the small number of data points, and smaller S/N. Especially, outer arm2 has only four offsets from matched peaks, which results in the failure of calculating the correlation coefficient and its variation.
3.3.3 Pitch angles
By fitting the logarithmic spiral function to stellar and gas peaks, we measure pitch angles for arm1 and arm2 separately as well as for the inner (–) and the outer (–) disk. The fit results are listed in Table 2 and presented as blue dot(s)-dashed lines in Figure 4. From this figure, it is clear that spiral arms in M51 are relatively well expressed by the log spiral functions within the radial ranges we used.
Given that the galactic shock models predict gas arms move from downstream to upstream of stellar arms with increasing radius, a pitch angle for the gas arm should be smaller than that for the stellar arm. For M51, we find this difference in pitch angle except for inner arm1. This is consistent with the radial dependence of offsets presented in Figure 7 and Table 3.
4 Discussion
4.1 Comparison with previous studies of M51
Schinnerer et al. (2013) presented the 12CO(1–0) emission data at resolution for the central region of M51. Offsets between the CO and other data were calculated using the cross-correlation method. Among them, best tracers for the stellar mass are the HST/ACS -band image and the stellar component in Spitzer/IRAC m map from Meidt et al. (2012). From their Figure 11, offsets between CO (i.e. molecular gas) and stars fall within and no radial dependence is seen at –. Meanwhile, we find larger offset values (). In addition, their radial dependences are opposite for arm1 and arm2 at –. This discrepancy is at least partially due to the fact that Schinnerer et al. (2013) did not separate two arms. We also calculate correlation coefficients without separating two arms (“both arm” column in Table 3), and find values between and for the inner region. Kendall et al. (2011) estimated the shock location in nearby spiral galaxies by using Spitzer/IRAC and optical images by the SINGS survey (Kennicutt et al., 2003). Though the scatter is relatively large, their result for M51 indicates that the shock is generally at the leading side of the stellar arms at –. Their results are consistent with our results for inner arm2 despite the small overlap in radius (–), but not for outer arms, where we find that offsets fluctuate around zero. Their pitch angle () is also smaller than our estimates (see Table 2). While not fully understood, one reason for these inconsistencies could be how they derive gas and stellar peak positions. For gas peaks, Spitzer 8m map was used as a tracer, which includes PAH features that become brighter due to emission from young stars. For stellar peaks, Spitzer 3.6m and 4.5m maps were used as a tracer. The authors found small-scale structures not associated with PAH features, and attributed them to direct emission from young stars. Thus, their gas and stellar peak positions could be affected by young stars but in a different way.
On the other hand, information on gas kinematics has been used to explore the nature of spiral arms in M51. Garcia-Burillo et al. (1993) used the 12CO(2–1) emission data at resolution for to compare with orbit crowding model calculations and found that the observed arm/interarm ratio of CO brightness is consistent with the model without galactic shock. Kuno & Nakai (1997) investigated velocity distributions and orbits of gas from the 12CO(1–0) emission data at resolution for –. Since a difference in crossing time of arm and interarm regions was in accordance with the arm/interarm ratio of gas density and the velocity change across the spiral arms was gradual, they concluded that the spiral arms in M51 can be explained without galactic shock. Contrary to these single-dish observations, Aalto et al. (1999) claimed that interferometric CO data at higher (–) resolution support the presence of shocks in M51. Regarding the difference between the arms, Vogel et al. (1993) suggested two spiral arms are both driven by density waves from H residual velocities at minor and major axis. Meanwhile, Shetty et al. (2007) presented that profiles of streaming motions for the two arms are different based on CO and H velocity fields. By calculating mass flow rates, they also claimed that the spiral structure in M51 is not consistent with a steady spiral model in a flat disk. In summary, it is still an open question whether quasi-steady spiral arms as well as the galactic shock waves exist in M51 or not.
4.2 Nature of spiral arms in M51
In this subsection, we discuss the nature of spiral arms in M51, taking into account offsets between and presented in this paper as well as those between CO and H studied by Egusa et al. (2009) and Louie et al. (2013). Since we find that inner and outer arms as well as arm1 and arm2 may have a different nature, we discuss them separately. Note that CO-H offsets are measured at –, only for the inner region.
First, we briefly summarize the result for the outer spiral arms. Their nature is not well constrained because (i) the number of successful gas-star offset measurements is small and (ii) CO-H offsets are not measured. Despite its uncertainty, the gas-star offset for the outer arm1 shows a relatively strong negative correlation with radius. This does not exclude the possibility that the outer arm1 is consistent with the galactic shock wave with . The nature of the outer arm2 is even more uncertain, but the offset distribution appears similar to that of outer arm1.
For the inner arm1, Egusa et al. (2009) measured CO-H offsets and derived Myr, while is a time needed for CO clouds to form HII regions and is called star formation time-scale. Assumptions in their analysis are a constant pattern speed (i.e. the arm is a density wave), circular orbits, and constant . Their result indicates that arm1 is stable (or rigidly rotating) at least for Myr. On the other hand, we find that the gas-star offset is unlikely to be consistent with the galactic shock models. This result suggests that the spiral structure is not quasi-stationary and/or the gas self-gravity is too strong to form the standing shock waves. The former implies that the inner arm1 is slowly-winding. Its lifetime should be long enough ( Myr) to have CO-H offsets consistent with the density wave and short enough ( Myr) to have gas-star offsets inconsistent with the galactic shock. This is in agreement with a picture proposed by numerical simulations for an interacting system (Dobbs et al., 2010; Struck et al., 2011; Pettitt et al., 2016), in which spiral arms change their shape at a time-scale of a few 100 Myr. The latter, i.e. the effect of gas self-gravity, is discussed in Appendix C, but is not conclusive from the current data set.
Interpretation of the results for the inner arm2 is not straightforward. While we find that the gas-star offset is consistent with the galactic shock wave, the CO-H offset measured by Egusa et al. (2009) is not consistent with the density wave. If we follow the discussion on the inner arm1, the former suggests that the inner arm2 is long-lived while the latter suggests that it is short-lived. One possibility is that the assumptions of constant pattern speed, circular orbits, and constant adopted in Egusa et al. (2009) are not valid. Naively speaking, our interpretation of the inner arm1 to be slowly-winding spiral arm means that the pattern speed decreases with radius. If this is the case, a decreasing trend of CO-H offsets with radius will be weaker. Furthermore, if increases with radius (due to lower gas density and/or metallicity at larger radii, for example), it will help CO-H offsets become larger at larger radii. However, these two possibilities do not explain the difference between arm1 and arm2. Based on the method of Kuno & Nakai (1997), Miyamoto et al. (2014) investigated gas dynamics at – and –. From their velocity vectors and profiles at –, velocity component perpendicular to the arm becomes larger after the passage of arm2, while it becomes smaller after the passage of arm1. Although such a difference is not seen at –, this behaviour can explain the large CO-H offsets for arm2 at larger radii. For further discussion on the nature of inner arm2, more careful investigation of gas orbits is necessary, which is beyond the scope of this paper.
5 Summary
From theoretical calculations of gas response to a quasi-stationary spiral potential, interstellar gas should experience a galactic shock around spiral arms, and offsets between the shocks and potential minima are expected to depend on galactocentric radius. On the other hand, no such systematic offsets are found in simulations of dynamic spiral structures.
For the grand-design spiral galaxy M51, we have measured these offsets using high-resolution maps of stellar mass density and hydrogen mass density. The former was created by fitting SED models to optical and near-infrared images, and thus is most reliable as uncertainties due to extinction, the contamination of young stars, and interstellar features are small. The latter was created by combining CO and HI images, which are the tracer of molecular and atomic hydrogen, respectively. The final resolution of images used in this study is , which corresponds to 240 pc at the adopted distance of M51.
The offset is defined as an azimuthal difference of peak positions of gas and stellar mass profiles and is measured separately for two spiral arms at every in radius. The uncertainty of offsets is estimated from the data S/N and arm width. We separate the inner and outer regions and investigate radial dependence of the offsets. For the inner region, arm1 and arm2 show a different dependence, only the latter that extends to the companion galaxy being consistent with the galactic shock wave. For the outer region, the stellar arms are weaker and offset values are closer to zero. The number of offsets is also smaller, so that the result is not conclusive. Nevertheless, the offset distributions do not exclude the possibility that outer arms are consistent with the galactic shock wave. This study highlights an importance of separating two arms as well as inner and outer regions for studying the nature of the spiral structure in M51.
Furthermore, we attempt to constrain the lifetime of inner arms, by combining implications from gas-star offsets and CO-H offsets (Egusa et al., 2009; Louie et al., 2013). For the inner arm1, CO-H offsets suggest that its lifetime should be longer than the star formation time-scale which is Myr. From the gas-star offsets measured in this paper, the inner arm1 is unlikely to be consistent with the galactic shock wave. This result suggests that its lifetime should be shorter than Myr, which is a time-scale to form the galactic shock, and/or the gas self-gravity is too strong to form the galactic shock. The former possibility is consistent with numerical simulations of interacting systems, in which spiral arms are slowly-winding at a time-scale of a few 100 Myr. Meanwhile, implications from CO-H and gas-star offsets for the inner arm2 appear to be contradictory. We discuss several possibilities to cause this inconsistency.
Acknowledgments
Authors are grateful to careful reading and a number of comments by a referee, which have significantly improve the manuscript of this paper. This work was in part carried out on the common use data analysis computer system at the Astronomy Data Center, ADC, of the National Astronomical Observatory of Japan. JB was supported by HPCI Strategic Program Field 5 ‘The origin of matter and the universe’. JK is supported by the NSF through grant AST-1211680 for this research. JK also acknowledges the support from NASA through grant NNX14AF74G.
References
- Aalto et al. (1999) Aalto S., Hüttemeister S., Scoville N. Z., Thaddeus P., 1999, ApJ, 522, 165
- Arimoto et al. (1996) Arimoto N., Sofue Y., Tsujimoto T., 1996, PASJ, 48, 275
- Baba et al. (2013) Baba J., Saitoh T. R., Wada K., 2013, ApJ, 763, 46
- Baba et al. (2015) Baba J., Morokuma-Matsui K., Egusa F., 2015, PASJ, 67, L4
- Bolatto et al. (2013) Bolatto A. D., Wolfire M., Leroy A. K., 2013, ARA&A, 51, 207
- Colombo et al. (2014) Colombo D., et al., 2014, ApJ, 784, 4
- Dobbs & Baba (2014) Dobbs C., Baba J., 2014, Publ. Astron. Soc. Australia, 31, 35
- Dobbs & Bonnell (2008) Dobbs C. L., Bonnell I. A., 2008, MNRAS, 385, 1893
- Dobbs et al. (2010) Dobbs C. L., Theis C., Pringle J. E., Bate M. R., 2010, MNRAS, 403, 625
- Donovan Meyer et al. (2013) Donovan Meyer J., et al., 2013, ApJ, 772, 107
- Egusa et al. (2009) Egusa F., Kohno K., Sofue Y., Nakanishi H., Komugi S., 2009, ApJ, 697, 1870
- Egusa et al. (2013) Egusa F., Wada T., Sakon I., Onaka T., Arimatsu K., Matsuhara H., 2013, ApJ, 778, 1
- Elmegreen et al. (1992) Elmegreen B. G., Elmegreen D. M., Montenegro L., 1992, ApJS, 79, 37
- Fujii et al. (2011) Fujii M. S., Baba J., Saitoh T. R., Makino J., Kokubo E., Wada K., 2011, ApJ, 730, 109
- Fujimoto (1968) Fujimoto M., 1968, in Non-stable Phenomena in Galaxies. p. 453
- Garcia-Burillo et al. (1993) Garcia-Burillo S., Combes F., Gerin M., 1993, A&A, 274, 148
- Gittins & Clarke (2004) Gittins D. M., Clarke C. J., 2004, MNRAS, 349, 909
- Kendall et al. (2011) Kendall S., Kennicutt R. C., Clarke C., 2011, MNRAS, 414, 538
- Kennicutt et al. (2003) Kennicutt Jr. R. C., et al., 2003, PASP, 115, 928
- Kim & Kim (2014) Kim Y., Kim W.-T., 2014, MNRAS, 440, 208
- Kim & Ostriker (2002) Kim W.-T., Ostriker E. C., 2002, ApJ, 570, 132
- Koda et al. (2009) Koda J., et al., 2009, ApJ, 700, L132
- Kuno & Nakai (1997) Kuno N., Nakai N., 1997, PASJ, 49, 279
- Kuno et al. (1995) Kuno N., Nakai N., Handa T., Sofue Y., 1995, PASJ, 47, 745
- Lee (2014) Lee W.-K., 2014, ApJ, 792, 122
- Lin & Shu (1964) Lin C. C., Shu F. H., 1964, ApJ, 140, 646
- Louie et al. (2013) Louie M., Koda J., Egusa F., 2013, ApJ, 763, 94
- Lubow et al. (1986) Lubow S. H., Cowie L. L., Balbus S. A., 1986, ApJ, 309, 496
- Martínez-García et al. (2009) Martínez-García E. E., González-Lópezlira R. A., Gómez G. C., 2009, ApJ, 707, 1650
- Meidt et al. (2008) Meidt S. E., Rand R. J., Merrifield M. R., Shetty R., Vogel S. N., 2008, ApJ, 688, 224
- Meidt et al. (2012) Meidt S. E., et al., 2012, ApJ, 744, 17
- Meidt et al. (2013) Meidt S. E., et al., 2013, ApJ, 779, 45
- Mentuch Cooper et al. (2012) Mentuch Cooper E., et al., 2012, ApJ, 755, 165
- Miyamoto et al. (2014) Miyamoto Y., Nakai N., Kuno N., 2014, PASJ, 66, 36
- Muñoz-Mateos et al. (2009) Muñoz-Mateos J. C., et al., 2009, ApJ, 701, 1965
- Oey et al. (2003) Oey M. S., Parker J. S., Mikles V. J., Zhang X., 2003, AJ, 126, 2317
- Pettitt et al. (2016) Pettitt A. R., Tasker E. J., Wadsley J. W., 2016, MNRAS, 458, 3990
- Querejeta et al. (2016) Querejeta M., et al., 2016, A&A, 588, A33
- Roberts (1969) Roberts W. W., 1969, ApJ, 158, 123
- Sandstrom et al. (2013) Sandstrom K. M., et al., 2013, ApJ, 777, 5
- Schinnerer et al. (2010) Schinnerer E., Weiß A., Aalto S., Scoville N. Z., 2010, ApJ, 719, 1588
- Schinnerer et al. (2013) Schinnerer E., et al., 2013, ApJ, 779, 42
- Shetty et al. (2007) Shetty R., Vogel S. N., Ostriker E. C., Teuben P. J., 2007, ApJ, 665, 1138
- Struck et al. (2011) Struck C., Dobbs C. L., Hwang J.-S., 2011, MNRAS, 414, 2498
- Tully (1974) Tully R. B., 1974, ApJS, 27, 449
- Vogel et al. (1993) Vogel S. N., Rand R. J., Gruendl R. A., Teuben P. J., 1993, PASP, 105, 666
- Wada et al. (2011) Wada K., Baba J., Saitoh T. R., 2011, ApJ, 735, 1
- Walter et al. (2008) Walter F., Brinks E., de Blok W. J. G., Bigiel F., Kennicutt Jr. R. C., Thornley M. D., Leroy A., 2008, AJ, 136, 2563
- Woodward (1975) Woodward P. R., 1975, ApJ, 195, 61
Appendix A Systematic uncertainties
A.1 Effect of conversion factor variation to gas mass
In this paper, we use a constant conversion factor to derive the H2 gas surface density from the CO integrated intensity. However, it has not been confirmed to be constant. In particular, its dependence on gas-phase metallicity has been actively discussed (e.g. Arimoto et al., 1996; Bolatto et al., 2013), as it would directly affect the ratio of CO to H2. Since the metallicity often decreases with radius, the conversion factor is suggested to increase with radius. However, no strong radial dependence is found by Donovan Meyer et al. (2013) at kpc for three nearby galaxies. On much smaller scales, the conversion factor is likely variable within a molecular cloud, since CO is more easily destroyed by UV radiation when H2 is still self-shielded. Schinnerer et al. (2010) performed LVG analysis on 17 locations (120 or 180 pc in diameter) in a spiral arm of M51 and derived the conversion factor for each of them. Most of the values are consistent with the Galactic value within a factor of two. There might be a tendency that downstream clouds have a slightly higher conversion factor, perhaps due to stronger UV radiation from young stars, if any. If such a systematic variation of the conversion factor exists, CO intensity peaks would shift upstream from the true gas density peaks. Since they are systematic, these shifts cannot erase the radial trend of offsets for the galactic shock. Again, this trend is within the factor of two variation and not confirmed yet. For a metal-rich galaxy such as M51, the conversion factor is estimated to be constant within a factor of few except the central region (e.g. Sandstrom et al., 2013).
A.2 Effect of attenuation to stellar mass
The map used in this study is created by fitting SED models to optical and NIR images. The methodology is the same as Mentuch Cooper et al. (2012), but the angular resolution is higher than their work. While the stellar mass is the most robust parameter among the fitting results, it may be subject to the age-extinction degeneracy. For example, a redder SED may come from highly extincted star light and/or older stars. The former leads to an underestimation of stellar mass, while the latter leads to an overestimation. Mentuch Cooper et al. (2012) compared their values with Muñoz-Mateos et al. (2009), who used the IR-to-UV ratio to derive the amount of extinction. While the most of these values are consistent within their uncertainties, values from the SED fitting are on average mag lower than those from the IR/UV ratio. If UV and FIR brightness were included in the SED fitting, we would be able to better constrain the stellar mass distribution. However, the current highest resolution of FIR images is achieved by Herschel, which is significantly larger than the resolution of and maps () used in this study.
By examining the and maps, we find a dip in where peaks in several locations. So it is more likely that the stellar mass is underestimated when the gas density is high and thus the extinction is large. This effect should create offsets even if peaks of true stellar mass and gas mass coincide, but such artificial offsets should appear in random direction. If true gas peaks move from downstream to upstream with increasing radius, as predicted by the galactic shock models, the attenuation effect would shift stellar peaks to the opposite side of gas peaks. This results in observed offsets to be larger than true offsets, but the radial trend does not change.
In addition, we locate spiral arms by fitting a gaussian profile to the azimuthal profiles in §2.5.2. As the width of fitted gaussian for stellar arms is wider than that for gas arms, we deduce that the derived stellar arm positions are minimally affected by the attenuation due to gas arms. If stellar peaks were artificially created by over correcting the extinction, widths of gas and stellar arms would be similar. We confirm in §3.3 that the radial trend of offsets from the peak-finding method and gauss-fit method is consistent with each other. We thus conclude that the attenuation effect does not significantly change the trend of gas-star offset against radius presented in this paper.
Appendix B Dependence on adopted parameters
B.1 Radial ranges
Here we test how adopted radial ranges affect the result. The first test is to treat inner and outer arms as a single arm. The cross correlation coefficients in this case are listed in “radial range = all” rows in Table 3. The coefficients for arm1 are positive, and thus a hint of negative correlation for the outer arm disappears. The coefficients for arm2 do not differ, as both inner and outer arms show negative correlations as well as the number of outer arm measurements is small.
The next test is to exclude the innermost region (). In this region, we find stellar peaks deviate from the logarithmic spiral (Figure 4). It is likely due to that azimuthal profiles are rather flat, resulting in stellar peak positions being more uncertain. In addition, several studies suggested that the innermost spiral structure is in a different dynamical condition (Meidt et al., 2013; Colombo et al., 2014). When this region is excluded, the cross-correlation coefficient for inner arm1 becomes slightly negative () for the peak-finding method and stays positive for the gaussian-fitting method. The effect of excluding the innermost region is not significant, but it highlights again the difference between the methods for inner arm1. Results for inner arm2 do not significantly change, i.e. all coefficients stay negative and are consistent with the galactic shock.
B.2 Arm regions
In our analysis, and peak locations are restricted to be within the defined arm regions. Here we test how the width of outer arm regions affect the result. When we expand the outer arm region width from to , the number of gauss-fit peaks for outer arm2 increases from four to eight. The cross-correlation coefficient for the gauss-fit method becomes positive (), while that for the peak-finding method stays negative (). Nevertheless, the number of measurements is still small to derive a robust conclusion. Results for outer arm1 are almost the same with the original arm definition.
Appendix C Effect of gas self-gravity
As already mentioned in §1, several theoretical studies based on 1D calculations suggested that the self-gravity of gas shifts the galactic shock location downstream (Lubow et al., 1986; Kim & Ostriker, 2002; Lee, 2014). On the other hand, 2D numerical simulations by Baba et al. (2015) showed that shock locations with and without self-gravity almost coincide. Several possible reasons for this discrepancy are: 1) difference in models (e.g. 1D vs 2D), 2) shift due to the self-gravity is small. In Figure 6 of Lee (2014), the difference in peak positions for the strong and weak self-gravity cases is pc perpendicular to a spiral arm. Given kpc and in the model, this shift corresponds to in azimuthal direction. Meanwhile, the uncertainty in offset from the peak-finding method is typically . 3) feedback effect: the model with self-gravity in Baba et al. (2015) includes stellar feedback. This affects gas density distribution especially at the downstream side and might be able to shift gas peaks upstream.
From observational point of view, it is still difficult to constrain the self-gravity strength. Lee (2014) defined it as
where is the number of spiral arms, is an average gas density, and is the epicyclic frequency. Therefore, depends on , , , and distance. As already discussed in Appendix A.1, the uncertainty is a factor of few. We estimate the uncertainty due to uncertainties in and to be % for each. The uncertainty in distance is %, according to NED distances. As a result, is uncertain at least by a factor of two.
For M51, we calculate using the constant , assuming a constant rotational velocity km/s, stellar from Table 2, and distance from Table 1. The ranges for inner and outer arms are 0.2–0.4 and 0.1–0.2, respectively. The offset from the peak-finding method is plotted against in Figure 8. We do not add error bars for , since it is uncertain as well as too large compared to its dynamic range. If the gas self-gravity shifts a galactic shock front downstream, this shift should be larger at inner radii as generally decreases with radius. Therefore, the decreasing trend of offset with radius, which is predicted by the galactic shock models, should not be changed due to the presence of self-gravity. An analogy is true for the correlation between offset and . Offset should increase with if both offset and decrease with radius. This trend is not dependent of whether the self-gravity effect is included or not. However, such a positive correlation is not clear in Figure 8, even for inner arm2 (black open triangles), where the radial dependence of offsets is consistent with the galactic shock models. We attribute this discrepancy to the facts that is not monotonically decreasing with radius at smaller scales and that the uncertainty in is again large compared to its small dynamic range.
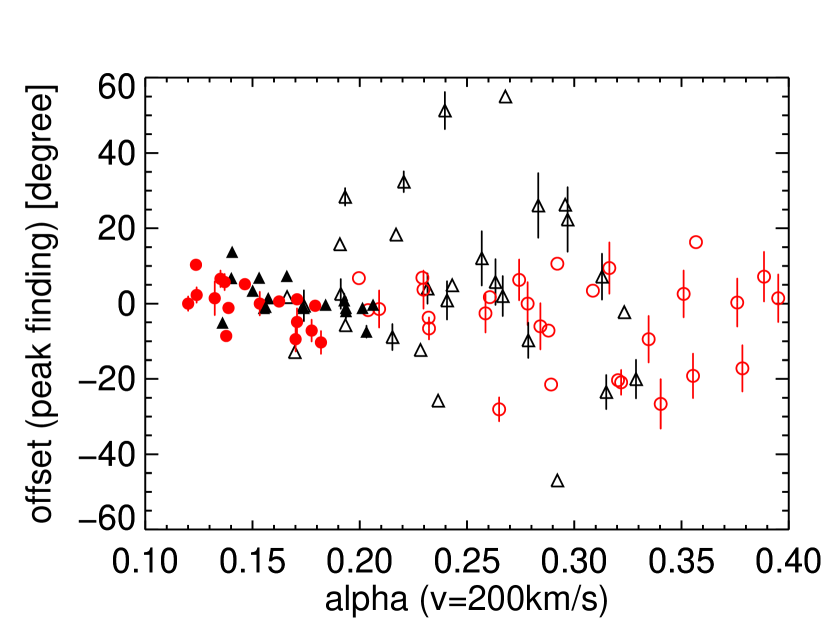
Another theoretical indication is that if the self-gravity is too strong, no solution for the galactic shock is found. The threshold in Lee (2014) is , depending on other parameters such as a magnetic field strength. Larger values for inner arm1 than for inner arm2 can be one reason for the lack of galactic shock in inner arm1. We should again note here that the difference in is not large compared to its uncertainty.