Electronic structure of Pr1-xCaxMnO3
Abstract
The electronic structure of Pr1-xCaxMnO3 has been investigated using a combination of first-principles calculations, X-ray photoelectron spectroscopy (XPS), X-ray absorption spectroscopy (XAS), electron-energy loss spectroscopy (EELS), and optical absorption. The full range of compositions, , and a variety of magnetic orders have been covered. Jahn-Teller as well as Zener polaron orders are considered. The free parameters of the local hybrid density functionals used in this study has been determined by comparison with measured XPS spectra. A model Hamiltonian, valid for the entire doping range, has been extracted. A simple local-orbital picture of the electronic structure for the interpretation of experimental spectra is provided. The comparison of theoretical calculations and different experimental spectra provide a detailed and consistent picture of the electronic structure. The large variations of measured optical absorption spectra are traced back to the coexistence of magnetic orders respectively to the occupation of local orbitals. A consistent treatment of the Coulomb interaction indicate a partial cancellation of Coulomb parameters and support the dominance of the electron-phonon coupling.
pacs:
71.38.-k,78.20.-e,71.20.Ps,78.10.BhI Introduction
Manganites have attracted wide interest due to their strong correlations between charge, spin, orbital and lattice degrees of freedom. These correlations lead to a rich phase diagram including two-phase regions with nano-scale phase separation. 1, 2, 3, 4, 5 In addition, manganites are well known for their colossal magnetoresistance (CMR) effect6, 7, 8 and the emergence of exotic phases including charge-ordered,9 multiferroic4 and pseudogap states.10 They may be used to design more efficient correlated-electron devices, 11, 12 e.g. in magnetoelectronics and electronic memory elements with smaller size.
Recently, interest in doped manganites arose from their exotic photovoltaic properties13, 14 as well as their potential benefit as electrocatalysts.15 The latter is inspired by the use of a CaMn4O5 complex as oxygen-evolution center in natural photosynthesis.16 Theoretical work on descriptors for catalytic oxygen-evolution activity rely on a detailed knowledge of the electronic properties of Mn-O bonds in manganite perovskites.17, 18 While arguments based on electron filling of a rigid antibonding state between Mn-3d and O-2p orbitals describe some trends in oxygen evolution activity,19 they do not cover all observed trends.20
Doping, which determines the charge state of the Mn ion, is the main control parameter within the complex phase diagram of manganites. A wide range of other parameters such as ion sizes,21, 2 dimensionality, etc. allows to tune the phase boundaries. In addition, external fields and temperature allow to actively drive the system across a phase boundary, which radically changes its properties and thus holds promise for technological applicability.
The series of Pr1-xCaxMnO3 is of special interest because of the similar ion sizes of Pr and Ca. They allow to change the charge of the Mn ion over the entire range from Mn3+ to Mn4+ without greatly affecting the crystal structure. 22, 4
Early electronic structure calculations23 for manganites indicated that conventional density functionals do not capture the electronic structure in their electron spectrum. This finding is in line with that for other transition-metal oxides. It has been shown, that the spectral properties can be improved by the so-called LDA+U method,24 which adds an explicit Fock term and thus introduces the atomic physics of strongly interacting electrons. A more rigorous basis for this description has been given by the hybrid density functionals.25, 26 The one-particle spectrum extracted from density-functional calculations, the so-called Kohn-Sham spectrum, should, in principle, not be identified with an excitation spectrum. However, the hybrid functionals, despite their roots in density-functional theory, have a close similarity with many-particle Green’s function methods such as the GW method.27, 28 This analogy provides a conceptional connection of the resulting Kohn-Sham spectra obtained in density-functional theory with the optical excitation spectra. In this paper, we exploit this analogy to determine the free parameters of the hybrid functionals by comparison with experimental spectra.
Most ab-initio calculations focussed on the electron-rich Mn3+ systems such as LaMnO3, which is an orbital ordered Jahn-Teller insulator with a band gap slightly above 1 eV.29, 30 Ederer, Kovacic and collaborators31, 32, 33, 28, 34, 35, 29, 30 performed a careful analysis using hybrid functionals on the iso-electronic series by exchanging the A-type cation and extracted parameters for model hamiltonians.
However, a comprehensive comparison of the occupied and empty states as well as the optical excitation spectrum with experimental data is still missing.
This is even more the case for a full doping series, where the effect of doping-induced changes of the correlations on the electronic structure, e.g. due to charge ordering, must be captured by ab-initio studies in a fully consistent approach.
The nature of the charge-ordered state at half doping was under debate for years. Experiments clearly confirmed the absence of strong charge disproportionation between different Mn sites,36 the presence of multiferroic states with electric polarization4 and the formation of Mn-O-Mn dimers.37, 38 The occurrence of an underlying Zener polaron type of charge ordering was supported by different theoretical work.39, 40, 41 Colizzi and Giovanetti40, 41 investigated the half-doped materials Pr1/2Ca1/2MnO3 and La1/2Ca1/2MnO3 using the measured atomic structure and confirmed the observed electric polarization. Efremov et al.39 used an extended double-exchange Hamiltonian for the study of the transition of the CE-type CO structure to the ordering of Zener polarons. Finding an exact relation between the bandstructure close to the Fermi level, excitation spectrum and the type of order is a very important step towards the future understanding of quasiparticle excitations in the different phases, using model Hamiltonians in combination with time-resolved optical spectroscopy.
In this paper, we examine the series Pr1-xCaxMnO3 for to study the effect of doping on the detailed structure of the valence and conduction band, magnetic and charge ordering as well as on the resulting excitation spectra. We use local hybrid density-functional calculations, which contain one free parameter per atom type. This free parameter is determined by experimental X-ray photoelectron spectroscopy (XPS). The resulting description is verified by comparison with electron energy-loss near-edge structure (ELNES) and the X-ray absorption near-edge structure (XANES)42, as well as measurements of optical absorption43. The density-functional calculations in turn serve to determine a minimal model, which puts the focus on the mechanisms for the polaron order and the effects of varying correlations on the states forming the band gap in manganites. Finally, the insight on the electronic structure is used to explain the experimental optical conductivity data.
II Methods
II.1 First-principles calculations
The calculations were performed in the framework of density functional theory (DFT)44, 45 and the projector augmented wave method (PAW).46
The augmentation of the PAW method includes the orbital shells on Pr, the orbitals on Ca, the orbitals on Mn and the orbitals on O. The partial waves have been constructed using the nodeless partial waves,47 which implies that the orbital shells refer to the sequence of nodeless partial waves rather than atomic orbitals. The matching radii in units of the covalent radii for the partial wave construction are for electrons respectively for Pr, for all angular momenta in Ca, for Mn, and for O.
The auxiliary wave function are expanded up to a plane-wave cutoff of 40 Ry and the auxiliary density to a plane-wave cutoff of 80 Ry.
The k-point integration uses a grid with an upper wave-length cutoff of of the Fourier expansion in the reciprocal unit cell. This translates into a grid with division of the reciprocal lattice vectors for the unit cell of the Pbnm space group used for PrMnO3 and CaMnO3. For the calculations of half-doped Pr1/2Ca1/2MnO3, a larger unit cell has been used, with a correspondingly smaller k-point grid.
We used the experimental lattice constants from Poeppelmeier et al.48 for CaMnO3, from Jirak et al.3 for Pr1/2Ca1/2MnO3 and from Alonso et al.49 for PrMnO3. Two further calculations have been performed for the half-doped material Pr1/2Ca1/2MnO3, for which we used the experimental lattice constants37 for . The notation regarding -directions used in the following refers to the Pbnm space group, respectively P21nm space group.
For Pr1/2Ca1/2MnO3 we used an alternating (rock-salt) ordering of A-type ions Ca and Pr. For the CE-type order we performed also one calculation with layers of Pr and Ca ions alternating in -direction.
The atomic positions in each unit cell have been relaxed without any restriction. The electronic structure has been limited to collinear spin arrangements.
The electronic structure in manganites depend strongly on the type of magnetic order. Wollan50 introduced a notation according to which a perovskite with antiferromagnetically arranged Mn ions is called G-type. The wave vector of the spin wave is oriented along the direction. The ferromagnetically ordered material, wave vector is called B-type. The perovskite with antiferromagnetically coupled chains of ferromagnetically aligned Mn ions with wave vector is called C-type. The antiferromagnet with ferromagnetic ab-planes with vector is called A-type.
Calculations have been performed for the G, A, C, and B-type magnetic orders for all three compositions with and . For the half-doped material Pr1/2Ca1/2MnO3 we also investigated the CE-type and the E-type magnetic order shown in figure 13. Unless mentioned otherwise, results for CaMnO3 () are provided for the G-type order, results for Pr1/2Ca1/2MnO3 () for the CE-type order and for PrMnO3 () A-type order.
We used our local hybrid functional PBE0r as density functional. PBE0r is derived from the PBE0 51 functional which replaces a fraction of the exchange energy of the PBE 52 functional by the explicit nonlocal Hartree-Fock exchange energy .
| (1) |
In the local version, PBE0r, the Kohn-Sham wave functions are mapped onto localized tight-binding orbitals and only the onsite exchange terms of the exchange correction are included.
The restriction of the exchange correction to local terms is a way of range separation, which mimics the screening of the long-range part of the interaction in the spirit of the GW approximation. The limitation of onsite terms is appropriate for materials such as transition metal oxides with a strongly localized d-orbitals, while it is not suitable for the description of materials with strong covalent bonds.
In contrast to other implementations of local hybrid functionals, 53, 54 and the closely related LDA+U method, we include the Fock term on all atoms and we take into account all tight-binding orbitals that contribute the valence electrons or the core wave functions. Also the exchange interaction between core and valence electrons is taken into account. The rationale for the inclusion of all orbitals is to avoid unphysical energy shifts between orbitals that are included in the correction relative to those that are not.
Another important difference to the LDA+U method is the double-counting correction, which subtracts the local terms of the DFT exchange corresponding to the terms of the Fock term () added. Our choice55 is in the spirit of density-matrix functional theory.
The commonly used value for the admixture in the PBE0 functional is .56 In the present paper, we adjust these parameters such that the experimentally observed spectral features are well described. While the use of spectral features for this purpose is illegitimate in the context of density functional theory, a justification is provided by the connection with many-particle Green’s functions and density-matrix functional theory57 on the one hand and to the GW approximation on the other.
The local approximation of the hybrid functionals allows us to choose the mixing parameter individually for each atom, reflecting an effective local dielectric constant. The determination of the parameters is described in detail below. We used a mixing factor for Pr, for Mn and for O and Ca.
Like the augmentation, also the construction of local orbitals uses the framework of nodeless partial waves described elsewhere.47 The local orbitals are constructed in the spirit of the tight-binding linear muffin-tin orbital (LMTO) method58 by enforcing that only the nodeless scattering partial waves are admitted on the neighboring sites.47 These orbitals are approximated by a one-center expansion and truncated beyond a radius of two times the covalent radius of that atom.
The orbital set includes states up to for Pr, up to for Ca, up to for Mn and up to for O atoms.
II.2 Calculation of ELNES and XANES spectra
ELNES describes that part of the electron-energy loss spectrum (EELS) which samples the contribution of a core-electron excitation of a given element to the empty orbitals. XANES is similarly based on the absorption of X-rays by excitations of core electrons into empty states.
ELNES spectra describe the energy loss function
| (2) |
due to the excitation of an core electron. is the contribution of the corresponding processes to the relative dielectric constant and is the energy transferred from the fast probe electron. In this paper, we study the -edge absorption of oxygen, where the 1s core level is excited.
The relative dielectric constant is obtained as59
| (3) | |||||
is the energy of the ground state and is the energy of the excited many-particle state with a core hole and the excited electron. In practice, the excitation energy is determined as the difference between the energy of an unoccupied Kohn-Sham state and the level of the core state . The oscillator strengths are obtained as
| (4) |
The sum over states implicitly contains the spin multiplicity, i.e. every spin state is counted once. The sum over is the sum of core levels from the same shell. The index specifies the orbital momentum and the spin quantum numbers of the core shell. Only unoccupied band states contribute to the spectrum. is the number of oxygen atoms per unit volume. is the life-time broadening of the excitation.
In order to evaluate the matrix elements between the core state and the band state , we use the approximate representation of the wave function in terms of all-electron partial waves , i.e.
| (5) |
When we express the dipole operator by cubic spherical harmonics, we can express the matrix elements using the Gaunt coefficients = as
| (6) | |||||
where is the radial part of the partial wave = , and is the analogously defined radial part of the core level. The index species the cubic spherical harmonic with , that points in the direction of .
The life-time effects have been estimated as follows: The life-time broadening of the electron in the conduction bands has been estimated by Egerton60 as
| (7) |
by the free-electron velocity and the inelastic mean free path . The energy is the energy of the band state relative to the absorption edge. For the inelastic mean free path we use the interpolating formula of Seah61
| (8) |
with the values eV2nm and nm/ for inorganic compounds from Seah’s analysis.
The smaller effect is the lifetime of the core hole. We follow Egerton60 and obtain the core-hole lifetime broadening for the K-shell from
| (9) |
where is the excitation energy at the absorption threshold. We use the calculated core-level energy , so that eV.
In this paper, we use the so-called independent electron approximation (IPA), which ignores the presence of the core-hole. The only effect of the core hole considered is a rigid energy shift of the spectrum to adjust the absorption threshold to experiment. A more accurate calculation would use the same analysis, but for a supercell calculation with one-half of a core hole on the probed atom. The justification for the factor one-half is Slater’s transition state rule. An even more advanced analysis requires the solution of the Bethe-Salpether equation.62
The justification of the IPA in the present work is the limitation on the O edge (1s-2p transition) because it is particularly suited for an interpretation based on partial Density of States (DoS) calculations given the generally strong screening of the 1s core hole.63 In contrast, the spectral shape of the Mn edge would be strongly affected by multiplet effects arising from the strong wavefunction overlap between the 2p hole and the 3d electrons.
II.3 Measurement of ELNES spectra
EELS were recorded on an FEI Titan 80-300 microscope, equipped with a GIF Quantum 965 ER spectrometer, operated at 300 kV in scanning transmission electron microscopy (STEM) mode. An electron monochromator provided an energy resolution of 150 meV. The convergence semi-angle was 10 mrad, the inner acceptance semi-angle was 22 mrad. Spectra were acquired from epitaxial thin films of PrMnO3, Pr1/2Ca1/2MnO3 and Pr0.05Ca0.95MnO3 prepared by ion beam sputtering. Details of the growth parameters and film properties can be found in ref. 43. Due to large oxygen-vacancy concentration and the tendency for phase decomposition in undoped CaMnO3 films, we have chosen a slightly doped variant for representation of the x=1 system and discuss its impact, where required. TEM specimens were prepared by mechanical polishing followed by Ar+ ion milling at glancing angles of 6 degrees. A power law type background has been subtracted and the spectra have been normalized. Savitzky-Golay smoothening has been applied by fitting sub-sets of 20 adjacent data points with a 3rd order polynominal.64
II.4 Measurement of XANES and XPS spectra
XPS and XANES measurements were performed at the ISISS beam line of the synchrotron facility BESSY II.65 Spectra were taken at room temperature from epitaxial thin films of PrMnO3, Pr1/2Ca1/2MnO3, and Pr0.2Ca0.8MnO3 prepared by ion beam sputtering. The experimental details of the XANES spectra have been published elsewhere.42 The resonant photoemission spectra were recorded at 930 eV for the Pr-M resonance and at 642 eV for the Mn L-resonance. Pre-resonance spectra at 920 eV and 635 eV respectively as well as a Shirley-type background were subtracted.66 The recorded spectra have been aligned on the energy axis such that the signal exceeds the baseline by a factor of two. This places the difference spectra onto a common energy scale.
II.5 Measurement of optical absorption spectra
Temperature-dependent (from to ) optical-absorption measurements in a Cary Varian 5e spectrometer with unpolarized light in a wavelength range of nm as well as reflectivity-corrected optical-absorption measurements in a Cary Varian 50 at room temperature for nm were carried out at Pr1-xCaxMnO3 () thin films on transparent MgO substrate with a film thickness of nm. The transmission (vertical beam) and reflectivity measurements were performed in a Dual Beam mode with . The absorption coefficient has been obtained via . For measurements at low temperatures or at wavelengths above nm a reflectivity correction is infeasible, thus is used for the determination of .
II.6 Calculation of optical absorption spectra
In order to interpret the measured optical absorption spectra we used the expression Eq. LABEL:eq:absonsite developed in appendix B. It decomposes the optical absorption into the contributions of transition between pairs of local orbitals. Each contribution is given by a joint DoS of specific pairs of orbitals and a trivial frequency-dependent factor. Thus we can attribute the features in the measured absorption spectrum to particular transitions which can be related to the projected DoS. The orbitals selected will be described in the text.
III Results and discussion
III.1 Electronic structure of manganites
Before discussing the details of our results we review the gross features of the atomic and the electronic structure of the Pr1-xCaxMnO3.
In the perovskite structure, Mn and O ions form a network of corner-sharing MnO6 octahedra. In the manganites studied here, the size of the A-type ions is sufficiently small so that the octahedra tilt in an alternating manner to increase the ionic attraction.
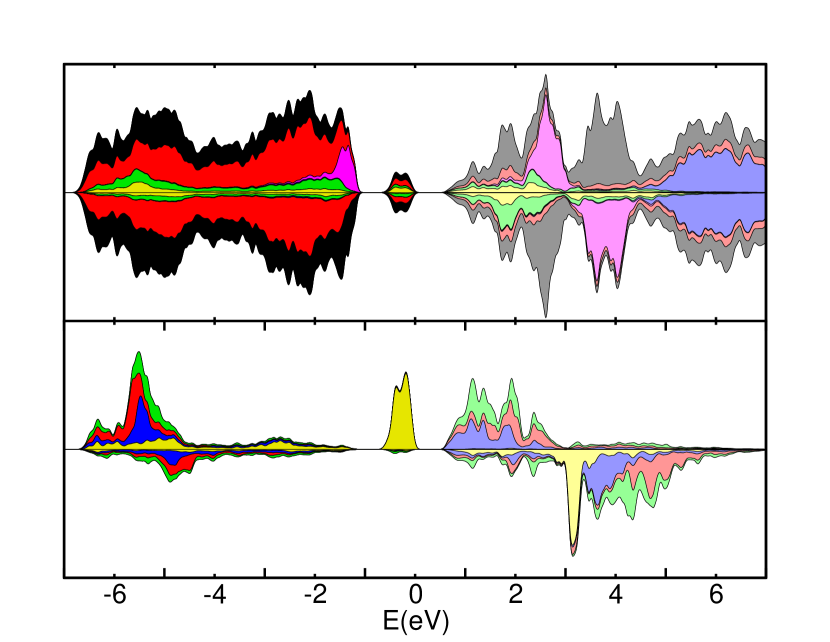
The most simple member of the class of Pr1-xCaxMnO3 manganites is CaMnO3. The ions are in the formal oxidation states Ca2+Mn4+O.
The calculated DoS of CaMnO3 is shown in figure 1. The filled valence band, which extends from -5 eV to 0 eV, is predominantly of O-p character with some contribution of Mn-d orbitals. The Ca-d states are located 7-9 eV above the valence band. The Mn-d states relevant for the complex properties of manganites lie mostly in between these two features.
The Mn-ions have a large magnetic moment, which leads to a Hund’s-rule splitting between Mn-d levels in the majority- and the minority-spin direction.
Relevant for the correlations dominating the manganite physics are the antibonding states between Mn-d and O-p orbitals. The corresponding bonding states are located at the bottom part of the oxygen valence band. Crystal field splitting divides the Mn-d states into states and states. We emphasize that the crystal-field splitting is not of electrostatic origin but due to the covalent interaction with the oxygen neighbors.67 Because the bond of the states is stronger than the bonds formed by the states, the antibonding states lie energetically above the states.
The Crystal-Orbital Overlap Populations (COOPs) in Fig. 1 reveal that the three antibonding states of the majority-spin direction are located in the upper part of the oxygen valence band. They are often modelled by a classical spin with . The majority-spin orbitals in CaMnO3 form the conduction band. This band can be filled by additional electrons introduced for example by doping. The antibonding states of the minority spin are located at higher energies, while their DoS overlaps with the majority-spin bands.
Passing from CaMnO3 to PrMnO3, the di-valent Ca ions are replaced by tri-valent Pr ions and additional electrons are inserted into anti-bonding states of the Mn sites. These electrons form polarons. The interplay of magnetic and polaron order are at the origin of the complex phase diagram of manganites.
The DoS of PrMnO3 is shown in figure 2. The filled Pr-f states, two per Pr, are located in the upper part of the oxygen valence band in the range -2 eV to -1 eV. The empty Pr-f states overlap energetically with the empty Mn-d states in the range from 2 eV to 4 eV.
In contrast to CaMnO3, the band gap in PrMnO3 is due to the Jahn-Teller effect: The degeneracy of the Mn- orbitals is lifted by a distortion of the MnO6 octahedra, which lowers the energy of the occupied state. This stabilization of the occupied state is due to weakening of the antibonds with the neighboring oxygen atoms as a result of an increase of the corresponding Mn-O bond distances. The ordering of the Jahn-Teller distortions give rise to an orbital ordered state.
All three compounds investigated, with , and , are insulating at low temperature. This conflicts with the simplified view of carrier doping known from semiconductor physics. In the manganites, electrons are strongly correlated with spin and lattice degrees of freedom. As a consequence, additional electrons tend to form new bound states with existing quasi-particles. This reflects in a strong structural and magnetic relaxation of the material upon addition or removal of electrons. This relaxation is often able to split off the state with the additional electron from the conduction band, and to shift it into the valence band.
III.2 Role of the U-tensor
The electronic spectra of transition metal oxides obtained from conventional gradient corrected density-functionals such as PBE52 differ appreciably from their excitation spectra. For example, the band gap of CaMnO3 in the PBE density functional is due to a transition from the to states, while in reality it is a charge-transfer insulator with a transition from the O-p states to the states.
While an agreement between Kohn-Sham spectra and excitation spectra is not a theoretical requirement, there are density functionals that produce spectra which are closer to excitation spectra. Hybrid functionals incorporate a fraction of an explicit exchange term very similar to the screened exchange of the GW method.27 The GW method, while approximate, has a sound theoretical basis for predicting the spectrum of one-particle excitations.
Qualitative differences between Kohn-Sham and excitation spectra are often a sign for a fundamental flaw of the density functional used, which also affect the description of the total energy. This is the reason for seeking a functional that is able to describe spectral properties in addition to giving a correct description of the energetics.
The main effect of admixing the non-local expression for the exchange in the hybrid functionals is a downward shift of occupied orbitals compared to empty orbitals with a similar character due to the self-interaction correction. Thus, this term correctly opens, respectively widens, a band gap of transition metal oxides. For this reason, the inclusion of a scaled Fock term as in the hybrid functionals is vital for the present work. For the manganites this affects predominantly the Mn-d orbitals and the Pr-f orbitals.
The effect of the Fock admixture on the DoS of CaMnO3 and PrMnO3 is shown in figure 3, where the hybrid mixing factors have been varied. The hybrid factors on all atoms have been kept equal.
The dominant effect on CaMnO3 is that the filled states are shifted downward from above the O-p band to its bottom part. A DFT calculation without admixture of a Fock term, describes the band gap of CaMnO3 incorrectly as due to a transition from to states. Already a small contribution of exact exchange shifts the filled states into the oxygen valence band and changes the nature of the material from a band insulator to a charge-transfer insulator.
A closer look reveals that the states within the O-p valence band form two distinct contributions, one due to antibonding states in the upper part and another one due to bonding states in the lower part of the valence band.
Only for large contributions of the Fock term, the states leave the oxygen valence band at the bottom and form a clearly identifiable separate peak.
A secondary effect of the exact exchange admixture in the hybrid functionals is the increase of the Hund’s-rule coupling between majority-spin and minority-spin orbitals. The Hund’s-rule coupling is reflected in the separation of the orbitals of both spin directions. The Hund’s-rule coupling grows with increasing localization of the orbitals, which in turn increases the local moment.
The position of the oxygen valence band is little affected by the Fock admixture, despite the fact that the O-p orbitals are filled and fairly localized.
Turning our attention to PrMnO3 in figure 3, we observe a dependence of the Mn-d states on the Fock admixture similar to that in CaMnO3. One important difference is that not only the states, but also the filled orbitals are shifted downward with increasing the Fock admixture.
A feature in PrMnO3 not present in CaMnO3 are the Pr-f states. For a pure GGA calculation using PBE, the Fermi level is pinned within the Pr-f states. The Pr-f states are split into majority- and minority-spin contributions, but there is no splitting between the occupied and empty states. The Fock admixture from the hybrid functional splits the occupied Pr-f states into separate bands of filled and unoccupied states. The filled states are shifted downward in energy with increasing Fock admixture and the empty states are shifted upward by a similar amount.
III.3 XPS
After understanding the role of the Fock admixture, we relate our findings to experiment and we extract a suitable set of parameters for the Fock admixture. For this purpose, the XPS data are most useful. The overall features of non-resonant valence band photoemission have been discussed by Kurash et al.68 Our resonant Mn-XPS, shown as green line in figure 4, shows a main peak (B) at -2 eV on our energy scale and a weaker maximum (A) at -6 eV. These two bands are attributed to the two contributions of the d-orbitals within the O-p valence band. The broadening of feature (A) towards higher binding energies is due to the presence of a Mn LVV Auger process, which can clearly be separated from the resonant Mn 2p3d peak as shown by Wadati et al.69
Characteristic for the manganites is the shoulder (D) between the upper peak and the Fermi-level. We attribute this feature with the filled orbitals located above the O-p band. A clear indication for this interpretation is the growth of this feature with , that is with increasing number of electrons in the d-shell. Because the experimental data are obtained at small but non-zero Pr concentration, i.e. , the pre-peak is still visible even at our most Ca-rich materials.
The dominance of the upper peak (B) compared to the lower one (A), and the existence of the pre-peak (D) above the main peak in the Mn-XPS, can only be obtained with narrow range of Fock admixture on the Mn site. We have chosen on the Mn site.
Turning now to the experimental Pr-XPS, a single band (C) from the occupied Pr-f states is observed which is similar in shape to the Pr-projected DoS. It is important that the Pr-f band is located energetically between the main peak of the Mn-XPS and the pre-peak. We have chosen a value of on the Pr site.
The commonly used Fock-admixing factor56 of makes the physically realized configuration of f-electron atoms unstable. As shown above, it furthermore overestimates the effect on the spectral properties. For this reason we determine the correction factors by comparison with the experimental spectral properties. The smaller Fock admixture is in line with recent studies.70, 35, 34 The comparison with experimental spectra suggests that the Fock admixture should be even smaller than the value suggested earlier.35, 34
| Element | Pr | Ca | Mn | O |
|---|---|---|---|---|
| 0.15 | 0.1 | 0.07 | 0.1 |
III.4 ELNES and XANES
The O ELNES and XANES spectra describe the absorption intensity of an electron transition from the 1s core shell of oxygen to its empty p orbitals. Therefore, it is sensitive to the antibonding states of mainly Mn- character. The antibonding states lift some O-p weight from the valence band into the spectrum of unoccupied states and are thus probed. The Mn- states contribute less to the spectrum, because they only form weak antibonds with -character. Another contribution to the spectra is due to lone pairs of the oxygen bridges, which point towards the A-type ion. The antibonding interaction with the d-electrons of the A-type ions, Ca and Pr, lifts some oxygen weight into the empty spectrum related to the A-type d-states, which is picked up by the spectra.
The experimental ELNES and XANES spectra are shown in figure 4 alongside with the calculated ELNES spectra and the calculated DoS.
The experimental spectra exhibit three main peaks: an upper peak (I) at 15-18 eV, a middle peak (H) at 6-10 eV and a lower peak (E, F, and G) below 6 eV. We assign the broad band (I) near 15-18 eV to a free-electron like feature.
The middle peak (H) near 6-10 eV is attributed to the Ca-d and Pr-d orbitals that overlap with the lone-pairs of the oxygen bridges. The calculated Ca-d and Pr-d states lie a few eV below the experimental ones. While we can only speculate about the origin at this point, we attribute this to a self-energy shift, which is not described adequately in our DFT calculations. For a high-energy excitation, the electron-correlations in the quasi-particle spectrum, which reduce the Coulomb repulsion, can not fully develop. In the DFT calculations in contrast, the correlations are fully developed, so that the resulting states lie lower than the measured excitation levels.
The spectral region of interest for the polaron physics of manganites is related to the lower peak (E, F, G) of the experimental spectra and lies in the energy window from 1 eV to 6 eV.
The lower peak has a shoulder (G) towards higher energies i.e. at 4-5 eV. This split-off band at higher energy can be attributed to the minority-spin Mn- states. It is present for all doping levels.
The main peak (F) of the lower band is due to the majority-spin orbitals and the minority-spin orbitals, which both lie in an overlapping energy region. Due to their smaller matrix elements, the states contribute less to the absorption than the states.
For CaMnO3 the main peak of the lower band in the calculated and experimental spectra has an interesting structure with a shoulder (E) towards lower energies. Also, the calculated DoS of the majority-spin states in that energy region can be divided into a sharp feature at the upper band edge attributed to feature (F) and a broad tail extending towards lower energies attributed to feature (E).
Proceeding from CaMnO3 towards PrMnO3, the relative weight of the bands (E, F) associated with the majority-spin Mn- states at 1-4 eV decreases. The weight is measured relative to the high-energy bands (H,I) due to the A-type d electrons and the free electron feature. This decrease in weight can be attributed to the filling of the two majority-spin Mn- levels. Only the empty orbitals are visible in the ELNES and XANES spectra. From CaMnO3 to PrMnO3 the number of empty majority-spin orbitals is reduced by a factor of two, which is consistent with the corresponding decrease of weight.
The experimental ELNES and XANES spectra of PrMnO3 exhibit a double peak (E, F) in the energy region 1-3 eV. The calculated spectra exhibit one broad band in this energy window. However, two fairly different states contribute: in the lower part (E) the majority-spin states are dominant, while in the upper part (F) the minority-spin states contribute. Therefore, we attribute the double peak to these two contributions.
IV Model Hamiltonian
In this section, we present a simple model that describes the relevant physical effects. The physics of manganites is characterized by strong correlations of electrons, phonons and classical spins. The electrons are those in the two orbitals of the Mn ions. The three spin-aligned electrons in the states of the Mn ions are described as classical spins. The two Jahn-Teller active distortions and an isotropic expansion of the MnO6 octahedra are the relevant phonons, which are strongly coupled to the electrons. All other degrees of freedom are either absorbed into the dynamical variables of the model, or they are considered as a bath and not treated explicitly.
A variety of models of this kind have been investigated and we refer to the excellent review of Hotta.67 The selection of the model and the choice of the model parameters are obtained either to match experimental observations or alternatively from first-principles calculations. While the first way is insensitive to the errors inherent in ab-initio calculations, it is possible that the same set of observations can be produced by different sets of parameters. This obscures the connection between the underlying physics and the experimental facts. Proceeding from ab-initio calculations, we hope to provide a consistent set of parameters that correctly captures the underlying physics.
IV.1 Functional form
In the model, the total-energy functional of density-functional theory is replaced by a potential energy functional of the form
| (10) |
where is the energy of the isolated electronic subsystem. describes the spin system, namely the antiferromagnetic interaction of the orbitals on neighboring Mn sites. is the phonon energy. The remaining two terms describe the coupling of these subsystems, namely the electron-phonon coupling due to the Jahn-Teller effect and the Hund’s coupling between electrons in the and shells of a given Mn site.
The electrons are described, in the spirit of density-functional theory44, 45 by a set of one-particle wave functions. In order to account for non-collinear magnetic structures, each wave function is a two-component spinor. The one-particle wave function with band index is expressed as
| (11) |
in terms of local spin-orbitals having spin , spatial orbital character denoting the orbital for and for orbitals. The orbital is centered at the Mn site specified by the index . The orbitals are aligned with the local coordinate axes defined by octahedral axes.
The electronic energy consists of the kinetic energy and the electron-electron interaction .
The kinetic energy of the electrons is
| (12) |
The hopping-matrix elements contribute only onsite and nearest-neighbor terms between the Mn sites.
The overall form of the hopping matrix is obtained assuming orbitals with pure angular momentum character. It is obtained by down-folding the p-orbitals of the oxygen bridge to obtain the indirect hopping matrix element between the d-orbitals with character. Only the axially symmetric orbitals along the bond Mn-O axis can contribute. Due to its symmetry, the d-orbital with character along the bond axis does not couple to a p-orbital of the bridging oxygen ion.
For nearest neighbors along the -direction, we obtain
| (15) |
while the hopping matrix elements in the -direction is
| (18) |
and the one along the -direction is
| (21) |
In addition to the intersite matrix elements, the hopping contributes the onsite matrix.
| (24) |
The onsite term ensures that a superposition of two d-orbitals on either side of an oxygen bridge cannot profit from bonding if their parity differs from that of the bridging O-p orbitals.
The down-folding produces also a constant energy term for each Mn site, which accounts for the Mn-O bonding contribution. We omit it, because it is a global constant. However, this term may become relevant when site-dependent and material-specific hopping parameters are used.
The Coulomb energy for a diagonal density matrix will be expressed by the local one-center reduced density matrix
| (25) |
The onsite Coulomb energy between the electrons
| (26) |
can be broken up into a term proportional to the Hartree energy
| (27) |
and a corresponding self-interaction correction
| (28) |
The self-interaction term stabilizes filled orbitals, and is thus largely responsible for opening up the band gap in transition metal oxides with a partially filled d-shell.
The remaining contribution to the onsite Coulomb interaction is
| (29) | |||||
With we denote the three Pauli matrices for . The notation implies for and vice versa. Similarly, for and for . The term vanishes for a fully spin-polarized system.
The division of the Coulomb energy used here is advantageous for the manganite systems. In manganites, the shell is nearly fully spin polarized so that is small. It has little effect on the filled orbitals, while it affects the position of the minority-spin states. The decomposition also makes it evident that the effective Coulomb parameter consists of a combination of several Kanamori parameters, and , which tend to compensate each other to a large extent.
The phonons are described by classical amplitudes of the breathing mode, the uniform octahedral expansion, and those, and , of the two Jahn-Teller active phonon modes.71 They are defined by
| (30) |
where is the distance between the oxygen atoms on the left and right corners of the octahedron centered at . Similarly is the distance of the oxygen atoms in the front and back and is the distance of the oxygen atoms on the top and bottom corners. is the equilibrium distance of two opposite oxygen atoms in the octahedron. The mode specifies the compression and expansion along orthogonal axes in the -plane. The mode describes expansion in -direction and compression in the plane.
The electron-phonon coupling is
| (31) |
where and are the electron-phonon coupling constants and
| (34) |
The phonon energy describes the term restoring the symmetric octahedron
| (35) |
where is the restoring force constant for the Jahn-Teller distortions and is the restoring force constant of the breathing distortion.
We describe the three majority-spin electrons at site by their classical spin . While the direction of the spin may vary, the magnitude of the spin vector is fixed to .
The spin energy
| (36) |
is due to a small anti-ferromagnetic coupling of the spins on neighboring sites.
The spins of the electrons are strongly coupled to the spins of the electrons by the Hund’s coupling . The Hund’s coupling is described by
| (37) |
where
| (40) |
IV.2 Parameter determination
The ratio of the breathing and Jahn-Teller parameters have been determined from theoretical grounds: because the Jahn-Teller splitting is due to Mn-O antibonds, an axial elongation affects only the position of the axial d-orbital, while leaving the d-orbital with -symmetry about the axis unchanged. A pure elongation along a single axis has a fixed ratio of Jahn-Teller distortion and breathing amplitude, namely
| (41) |
Such a distortion leaves one level unchanged, when the ratio of the coupling constants is . We use this condition to link and . The restoring force constant for the breathing mode is determined such that the equilibrium distortion of an isolated octahedron due to occupying a orbital is a pure axial elongation, which requires , hence . Thus, we use
| (42) | |||||
| (43) |
The other parameters of the model have been determined from the first-principles calculations of CaMnO3 and PrMnO3 in the stable magnetic structures. For this purpose, we selected a set of quantities, which are, on the one hand, physically relevant and, on the other hand, expressed by only a small set of parameters at a time.
Many of the relevant energy scales are defined already by the onsite contribution of the energy functional. In the onsite approximation of the model, this implies that we restrict the density matrix to a diagonal form.
| (44) |
Furthermore, we exploit isotropy of the onsite approximation in the -plane and in spin space: We restrict the Jahn-Teller distortion to the contribution, and we restrict the classical spin to point into the positive -direction.
This model can be optimized with respect to the phonon amplitudes and , which expresses them as function of occupations .
| (45) |
The onsite total energy for optimized phonon amplitudes has the form
where the parameters for the breathing have been expressed by those for the Jahn-Teller distortion as described in Eqs. 42 and 43.
We determine the energy levels from the model using Janak’s theorem72 as derivative of the total energy with respect to the occupations . Finally, we choose a special set of occupations, namely
| (47) |
while the other occupations, namely for , are set to zero.
The resulting energy levels are
| (69) | |||||
The comparison of these energy levels with the DoS of our first-principles calculations provides conditions that determines the values of the model parameters. The details on the relation between DoS and Hamilton matrix elements are provided in appendix A.
The parameters have been extracted from PrMnO3, which we represent in the model calculations by and , and CaMnO3 for which .
-
1.
From the spin splitting of the orbitals in CaMnO3 one extracts the Hund’s-coupling parameter .
-
2.
The Jahn-Teller splitting of the majority-spin states in PrMnO3 yields
-
3.
The Jahn-Teller splitting of the minority-spin states in PrMnO3 yields .
-
4.
From the splitting between majority- and minority-spin levels in PrMnO3, we obtain .
-
5.
Using the calculated Jahn-Teller distortion in PrMnO3, we can extract the electron-phonon coupling constant and the restoring force constant separately.
-
6.
Using the Jahn-Teller distortions of PrMnO3 in the A-type magnetic structure, we disentangle and via .
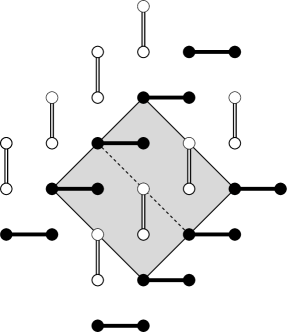
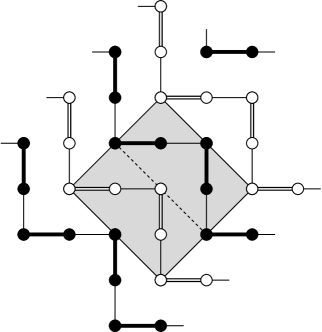
| Type | Mn | Magnetic configuration |
|---|---|---|
| G(AFM) | -3 |
![[Uncaptioned image]](/html/1610.07548/assets/x5.png)
|
| C(AFM) | -1 |
![[Uncaptioned image]](/html/1610.07548/assets/x6.png)
|
| CE(AFM) | -1 |
![[Uncaptioned image]](/html/1610.07548/assets/x7.png)
|
| E(AFM) | -1 |
![[Uncaptioned image]](/html/1610.07548/assets/x8.png)
|
| A(AFM) | 1 |
![[Uncaptioned image]](/html/1610.07548/assets/x9.png)
|
| B(FM) | 3 |
![[Uncaptioned image]](/html/1610.07548/assets/x10.png)
|
The energy related to the Heisenberg coupling can be expressed for the collinear magnetic structure from the number of ferromagnetic versus antiferromagnetic Mn neighbors. The result is summarized in table 2.
From the total energy difference between CaMnO3 for the G-type antiferromagnetic order and the ferromagnetically ordered material, we obtain the value of meV. With this value the model predicts the incorrect ground state for the half-doped material, namely, the ferromagnetic rather than the CE-type antiferromagnetic order. In order to recover the correct energetic order we increased the antiferromagnetic coupling to 14 meV.
The hopping parameter has been extracted as an average over all oxygen bridges, dopings and magnetic structures investigated.
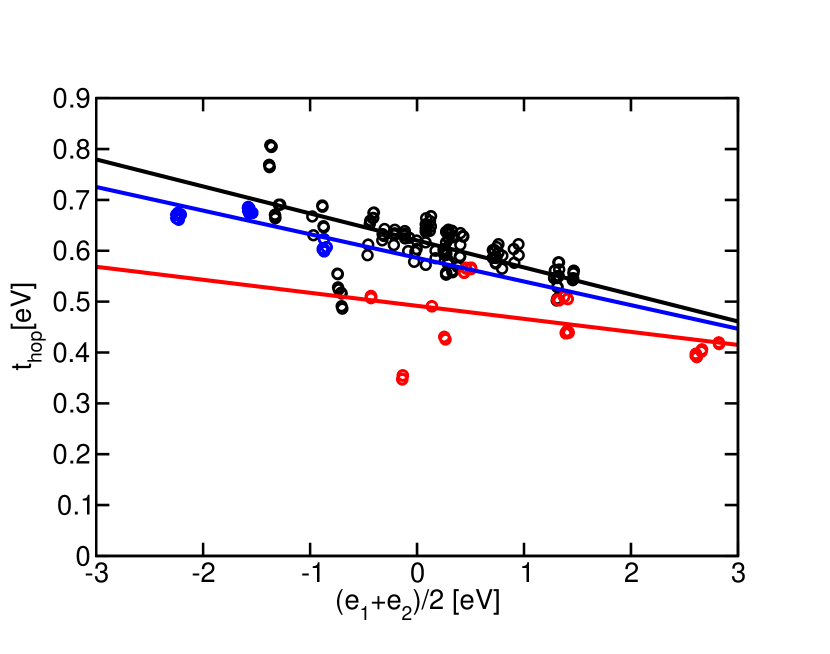
The hopping parameters exhibit a considerable spatial variation, which, however, seems to follow a, yet unknown, systematics. One trend is a correlation with the level positions, shown in figure 5. The level positions are the orbital energies extracted from the projected DoS via Eq. A.2. We obtain the fit
| (70) |
where the term in angular brackets is the average over all bonds considered. The variation of the hopping terms has been attributed29 to the fact that the hopping is mediated by the O-p orbitals. Orbitals closer to the oxygen valence band thus experience a stronger hybridization than more distant orbitals.
The parameter set, which results from the procedure described above, is shown in table 3
| 0.653 | eV | 2.988 | eV/Å | 1.306 | eV | |||
| 2.514 | eV | 10.346 | eV/Å2 | 2.909 | eV | |||
| 0.692 | eV | 0.014 | eV | 2.165 | eV | |||
| 2.113 | eV/Å | 0.585 | eV | 0.343 | eV | |||
| 5.173 | eV/Å2 | 1.923 | Å | 0.409 | Å |
IV.3 Discussion of the parameter set
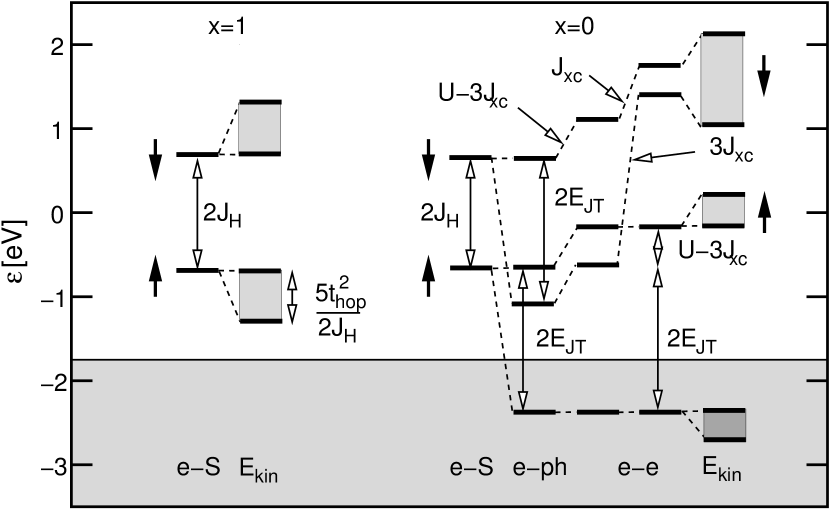
The energy levels resulting from the onsite model for CaMnO3 (x=1) and Pr1/2Ca1/2MnO3 (x=0) are shown in figure 6. It demonstrates the relative importance of the individual terms in the Hamiltonian. The kinetic energy has been included using perturbation theory for the hopping between ferromagnetically aligned Mn-sites.
Breathing term:
Figure 6 makes it evident that, due to the inclusion of the breathing term, the Jahn-Teller effect lowers one orbital instead of lowering one orbital and raising the other.
The same ratio as the one determined above in Eq. 43 on the theoretical grounds has been estimated independently by Hotta73 on the basis of measured phonon frequencies. Our first-principles calculations for PrMnO3 in the A-type structure lead to an even larger ratio of breathing amplitude and Jahn-Teller amplitude than anticipated by Eq. 41: With the data from table 4, we obtain values for Å and Å, which are of the similar size.
Coulomb interaction:
The two Coulomb parameters in our model, and , capture all Coulomb matrix elements within an orbital shell. We considered all four Kanamori parameters74.
| (71) |
with
| (72) |
For the orbitals, only two parameters and are independent.
Our model sheds light on the long-standing discussion about the relative importance of Coulomb and Jahn-Teller effect on the orbital ordering in manganites. In a seminal paper75, Kugel and Khomsky showed that orbital ordering can result solely from Coulomb interactions, while the Jahn-Teller distortions are expected to play a secondary role. Recent calculations have established the dominance of the Jahn-Teller effect76, 77. The one-site model supports this finding from a somewhat different perspective. Let me consider the limit of large Hund’s coupling, where the spins of the electrons are completely aligned with the spin of the orbitals. This is a reasonable assumption for the manganites under study. In this case, the only orbital-dependent terms in the onsite model Eq. LABEL:eq:onsitemodelenergy are the Jahn-Teller and the self-interaction energies. Both act in an identical manner so that they can be combined into one term
This term favors orbital polarization. While providing a simplified view of the problem, this argument shows how the Coulomb interaction and the Jahn-Teller effect act similarly. With our set of parameters, the Coulomb interaction accounts for 20 % of the net effect, while the dominant effect is due to the Jahn-Teller distortions. The relative size of the two contributions becomes significant for relaxation processes, because they are expected to operate on different time scales. Compared to electronic relaxation processes, the response of Jahn-Teller distortions is slow. Thus, we have provided a very intuitive picture of the Kugel-Khomsky mechanism75, and a measure for the relative importance of Kugel-Khomsky and Jahn-Teller mechanisms for orbital ordering.
The Coulomb interaction does not affect the energetic position of the occupied orbital in Pr1/2Ca1/2MnO3 as seen in figure 6. This is a consequence of the absence of any self interaction between electrons in the orbital-ordered state.
The total Coulomb repulsion for a density matrix with exactly one electron vanishes identically. This case is particularly relevant for the manganites, because (1) they contain between zero and one electrons and (2) the correlations tend to favor integral occupations. The balance between the different terms of the U-tensor is broken, when only parts of the U-tensor are considered. Therefore, conclusions drawn on the basis of a partial U-tensor need to be considered with caution.
Notable is that the Coulomb parameters and occur often in a combination eV, which is considerably smaller than the intraband Coulomb parameter eV. This reduces the net effect of the Coulomb interaction compared to approximations that ignore . The term proportional to dominates, whenever the Mn-sites are fully magnetized, which is fulfilled in the manganites to a good approximation. , in contrast, acts only on the minority-spin states.
The polaron formation energy including Jahn-Teller and breathing terms is
| (74) |
Usually, the breathing term in polaron formation energy is ignored, which makes the comparison of our values with those in the literature ambiguous.
In the absence of the breathing term, there is a simple relation between the polaron formation energy and the Jahn-Teller splitting of the energy levels. If the breathing term is considered, the relation between the polaron formation energy and the Jahn-Teller splitting of the electron levels is different.
With the definition Eq. 74 of the polaron formation energy given above, we obtain .
The dimension-less electron-phonon coupling constant is . We obtain with and without breathing contribution. Millis78 concluded that lies between 1.3 and 1.5.
The hopping is expected to depend on the bond angle of the bridging oxygen ion via . The dependence of the hopping parameter on the bond angle, explains its correlation with the tolerance factor and the resulting octahedral tilt. Due to the similar ionic radius of Ca and Pr, the bond angle variation in the materials considered here is relatively small. Our hopping parameter extrapolated to yields eV.
The smaller splitting of the minority-spin energy levels as compared to the majority-spin levels has been attributed to reduced bond-strength with the oxygen orbitals.31 This general trend is confirmed in figure 5. Nevertheless, our model uses a uniform hopping parameter.
For the uniform hopping parameter given above, we find that the model calculations favor the ferromagnetic structure over the CE-type antiferromagnetic structure in Pr1/2Ca1/2MnO3 by 0.037 eV per Mn site, when using meV. This is inconsistent with the experimental finding.
This difficulty can be healed by increasing the antiferromagnetic coupling beyond meV. Raising the antiferromagnetic coupling is a common cure for this problem, which does not affect the band structure.
Besides the dependence on , also a reduction of the hopping parameter in the ferromagnetic structure by 0.08 eV is sufficient to interchange the stability. This is within the range of the scattering of the hopping parameters extracted from the ab-initio calculations. Indeed we found the largest hopping parameters within the zig-zag chain of the CE-type structure, while the ferromagnetic calculations had unusually small hopping parameters. A more accurate description of the hopping parameters requires more work.
Because Jahn-Teller distortion and hopping are related to the hybridization of Mn-d states with the p-levels on the bridging oxygen, it has been suggested29 to reduce the Jahn-Teller splitting for the minority-spin direction. Our model attributes this reduction to the onsite Coulomb interaction.
The same ratio as the one determined above has been estimated independently by Hotta73 on the basis of the ratio of phonon frequencies. With Å extracted from a calculation for CaMnO3, we find for PrMnO3 in the A-type structure and Å, which indicates that the breathing distortion may be even larger than the ratio of Eq. 41 in the current parameterization.
V Electronic structure of Pr1-xCaxMnO3
The gross features of the electronic structure have been discussed earlier. Here we will focus on finer details and relate them to absorption spectra.
V.1 CaMnO3
The calculated direct band gap for CaMnO3 of 1.58 eV agrees well with the onset of our measured optical conductivity at 1.45 eV and other measurements at 1.55 eV.79 The calculated fundamental band gap is with 1.47 eV slightly smaller than the direct gap. In CaMnO3, we expect at room temperature a thermal average of different magnetic orders due to their near degeneracy. Such an average, however, would not affect the band gap strongly, because our calculations predict similar direct gaps in the range from 1.47 eV to 1.58 eV for the G-, C-, and A-type antiferromagnetic orders and fundamental band gaps in the range from 1.41 eV to 1.47 eV. The fundamental gaps become relevant if the magnetic disorder is very short ranged, so that the k-selection rule is no more valid.
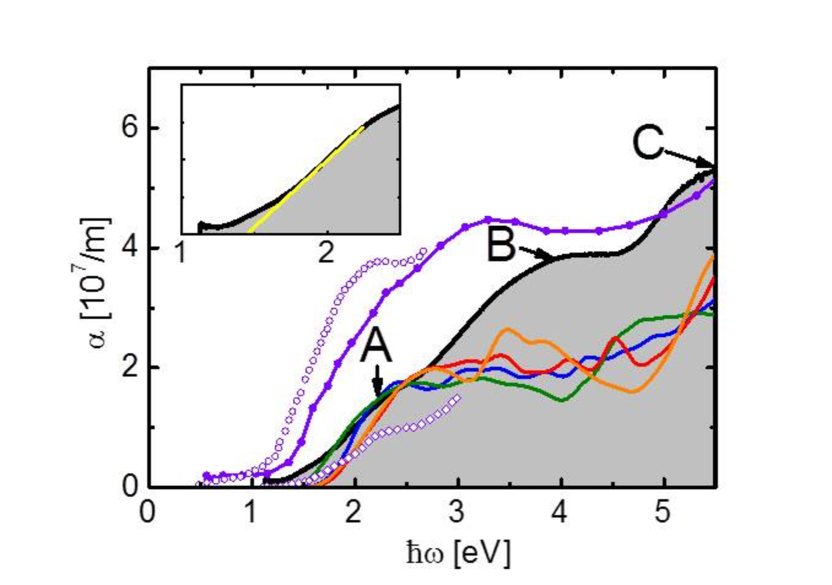
Measured absorption coefficients are compared with the calculated contributions of selected transitions in figure 7. This comparison provides a detailed interpretation of the observed features.
Our experimental spectrum in figure 7 exhibits three shoulders, namely shoulder (A) at 2.2 eV, shoulder (B) at 4 eV and shoulder (C) at 5.5 eV. The spectrum by Jung et al.80 show the same qualitative behavior. The analysis of Asanuma et al.81 indicates that changes in the oxidation state have a considerable impact on the intensity of the spectra and the energetic position of the main features, which we will discuss in the next section.
The calculated spectra exhibit, for all magnetic orders, a sharp rise from the conduction band edge to a shoulder at about 2.5-3 eV, which we identify with shoulder (A) of the measured spectrum. The shoulder is followed by a quasi plateau that rises sharply again beyond 5 eV. We attribute this rise with shoulder (C). Shoulder (B) in the experimental spectrum can be attributed to the corresponding peak in the calculated spectrum at 3.5 eV for the G-type magnetic order.
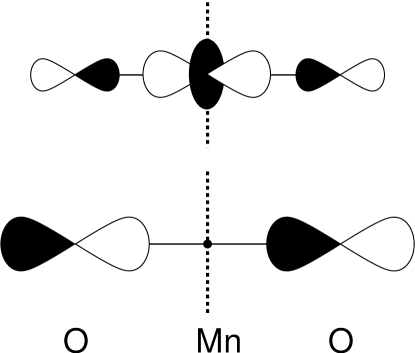
The optical absorption in CaMnO3 is due to charge-transfer transitions from O-p orbitals in the oxygen valence band into Mn- states. The spectra are calculated as described in appendix B. The participating orbitals responsible for the absorption are sketched in figure 8.
The feature (B) at 3.5 eV is present only in the calculated spectra for CaMnO3 with the G-type magnetic order. Like shoulder (A), the absorption is due to a transition into the lower band of the Mn-d states dominated by the majority-spin -states and minority-spin states. The subsequent depletion in the absorption at 4.7 eV has two origins: firstly, it is due to the band gap in the final state DoS at 4 eV in figure 1, which separates minority-spin from majority-spin states; secondly, it reflects the quasi gap in the initial state DoS at -5 eV in figure 1. The absorption spectrum can be considered as two replicas of the broadened final density of states, scanned once by the upper part of the oxygen valence band and then, separated by 2-3 eV, a replica scanned by the lower part of the oxygen valence band. Consequently, the rise in the absorption coefficient above 5 eV is due to transitions into the minority-spin and the majority-spin states. While this assignment is consistent with that of Jung et al.80, it also accounts for the structure in the initial-state DoS.
Most conspicuous is that the peak (B) and the minimum in the calculated absorption for G-type CaMnO3 at 4.7 eV is represented only as a plateau in the experiment. While it is absent in our absorption spectra and very weak in the photoconductivity by Jung et al.80, it is clearly seen in the photoconductivity spectra of Loshkareva et al.79 shown in figure 9.
A possible explanation for the different shapes of the experimental spectra is that not only the G-type antiferromagnetic order, but also other antiferromagnetic orders such as C- and A-type magnetic order contribute considerably to the thermal ensemble. Due to the increased band width of the Mn- states in the C and A-type order, the depletion in the calculated absorption spectrum at 4.7 eV is completely washed out and a shoulder occurs instead. Given the small energy difference between magnetic orders of CaMnO3, also other effects such as strain and preparation-induced point defects in the thin films can influence the distribution of magnetic orders and thus cause different absorption spectra. An improved understanding of the spectra may thus provide better control of the samples.
In our samples 5 % of Ca ions on the A-site are substituted by Pr ions. Thus they have a certain number of electron polarons. Electrons in CaMnO3 favor an environment with ferromagnetically aligned Mn ions, because this lowers the kinetic energy of electron polarons. Thus, a small doping of CaMnO3 shifts the stability away from the G-type towards the C- and A-type antiferromagnetic orders. Therefore, the remaining doping in our probes with enhances the other antiferromagnetic orders and thus washes out the trough in the spectrum at 4.7 eV.
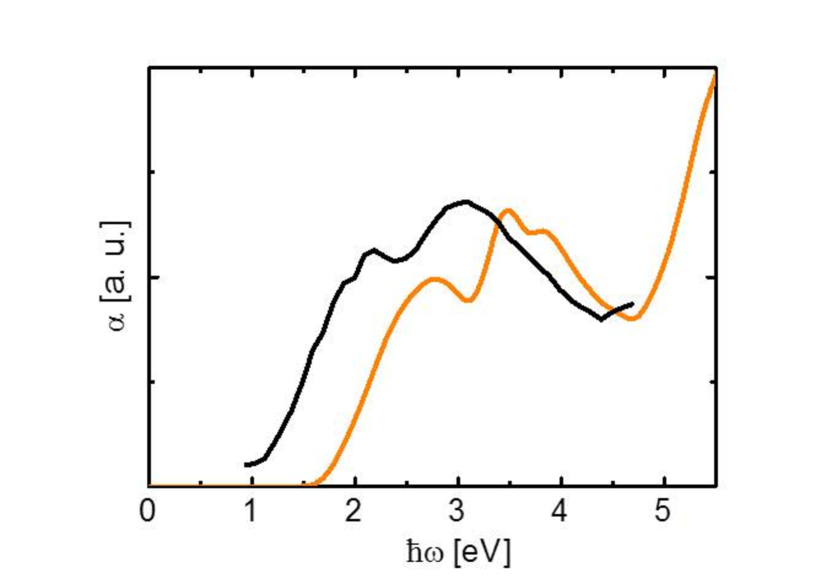
The agreement of the shape of our calculated optical absorption spectra of G-type CaMnO3 with the optical conductivity measured by Loshkareva et al.79, shown in figure 9 is striking. Given that these structures are not present in calculated spectra of the other magnetic orders investigated, it may indicate a stronger contribution of G-type antiferromagnetic ordering to the thermal average in these experimental probes.
V.2 PrMnO3
The optical gap of 1.25 eV for PrMnO3 extracted from our measured optical conductivity in figure 10 is well reproduced by our calculated direct gap of 1.30 eV for the A-type magnetic order. The calculated fundamental band gap is smaller, namely 1.05 eV.
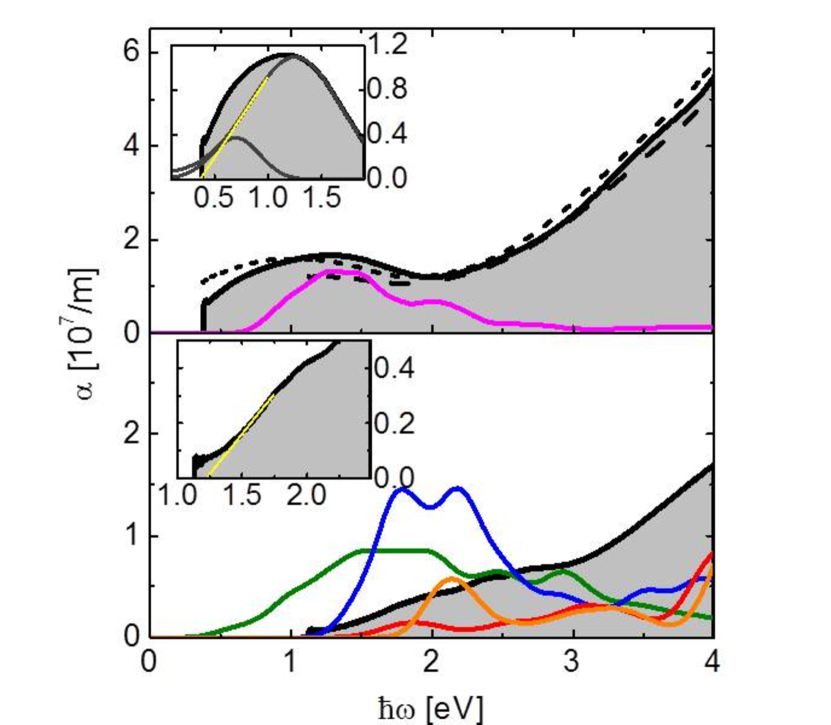
The center of the calculated absorption band at 2 eV for the A-type order shown in figure 10 is lower than that of the measured absorption band of 2.4 eV.43 Furthermore, our calculations for the A-type magnetic order overestimate the measured optical absorption. For the other antiferromagnetic orders, the absorption is considerably smaller. In particular, the absorption of the G-type magnetic order agrees better in peak position and magnitude. We therefore conclude that the A-type magnetic order is not dominant under the experimental conditions. Conceivable is that a fluctuating antiferromagnetic order is present.
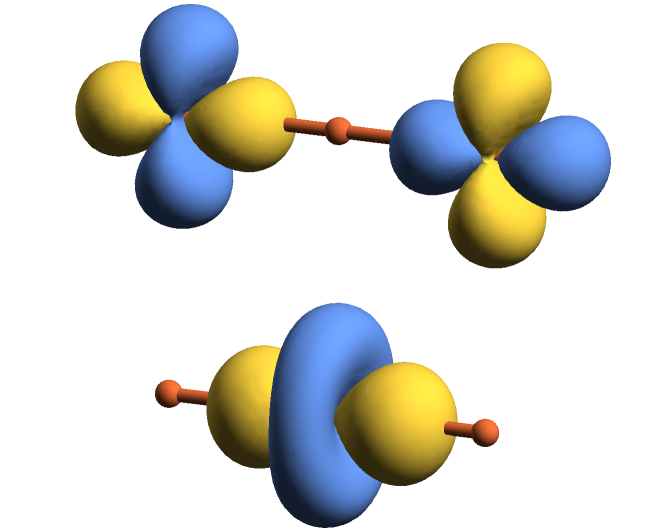
The optical-absorption line centered at 2.4 eV43 has been attributed to the transition from the lower to the upper Jahn-Teller band,82 as sketched in figure 11. While the onsite d-to-d transition is dipole forbidden, a transition between two orbitals centered at different sites is dipole allowed.
Let us investigate the electronic structure in greater detail: The lower, filled states of PrMnO3 can be expressed in terms of cubic harmonics as
| (75) |
where our calculations yield an mixing angle in A-type PrMnO3.
The corresponding upper, unoccupied orbitals are of the form
| (76) |
The orbitals on nearest-neighbor Mn sites are rotated by 90∘ about the local z-axis, which is accomplished by changing the sign of in Eq. 75 and 76. The orbital-mixing angle angle is close to for which filled and empty orbitals have the same shape except for translations and rotations about the z-axis. The orbital-mixing angle is the same for all antiferromagnetic orders, A-, C-, and G-type. For the ferromagnetic B-type order it is, with , slightly larger.
In figure 2, the DoS of PrMnO3 is shown alongside with the DoS projected separately onto each of the two Jahn-Teller-split orbitals. This figure shows how well the filled and empty Jahn-Teller bands can be represented by a single orbital each.
The dominant excitation in the near-infrared (NIR) region at about 2 eV is from an occupied orbital, Eq. 75, to an antisymmetric combination of the empty orbitals, Eq. 76, on the neighboring Mn-sites. The two orbitals are shown in figure 11.
The matrix elements calculated as described in appendix B are largest along the extended axis of the octahedron. The matrix element along the -direction is about half this value. The matrix element for a polarization in the -plane orthogonal to the extended axis of the octahedron practically vanishes.
As discussed by Kim et al.,82 the transition is only considerable between ferromagnetically coupled Mn sites, while the transition between antiferromagnetically coupled Mn sites, i.e. along the -axis, requires to overcome Hund’s-rule splitting, which places the absorption energy into the high-energy region of 3-6 eV. Its contribution to the low-energy features has been considered negligible.
Our quantitative calculations show that the picture is more subtle. The measured absorption near 2 eV is smaller than expected for excitations between neighbors of equal spin orientation: the absorption for A-type and B-type magnetic order at 2 eV is much larger than the experimental spectra, while the results for the G-type order are in reasonable good agreement, in terms of both, energetic position and weight. While the dominant absorption of the G-type structure is related to the Hund’s-rule splitting and occurs above 4 eV, tunneling of the upper Jahn-teller band into neighboring sites contributes to the DoS of the minority-spin direction. It is these wave-function tails that dominate the optical absorption in the NIR region. This interpretation gains further support from the comparison of absorption for PrMnO3 and Pr1/2Ca1/2MnO3. The optical absorption in Pr1/2Ca1/2MnO3 is considerably larger, despite the smaller number of optically active orbitals.
| Compound | Magnetic order | [Å] | [Å] | Energy/ (meV) | Band gap (eV) | ||||
| CaMnO3 | G | 1.927 | 0.016 | 151.0∘ | 150.3∘ | 2.837 | 4.791 | 0 | 1.47 |
| C | 1.927 | 0.012 | 150.4∘ | 150.4∘ | 2.853 | 4.793 | -1 | 1.42 | |
| A | 1.928 | 0.018 | 151.5∘ | 149.6∘ | 2.884 | 4.793 | 7 | 1.41 | |
| B | 1.929 | 0.014 | 150.4∘ | 149.7∘ | 2.922 | 4.794 | 20 | 1.33 | |
| Pr1/2Ca1/2MnO3 | G | 2.003/1.933 | 0.056/0.100 | 148.6-156.0∘ | 147.5-153.2∘ | 3.686/2.717 | 4.887/4.811 | 104 | 0 |
| C | 1.940/1.997 | 0.098/0.122 | 150.5-154.1∘ | 148.9-151.5∘ | 2.885/3.636 | 4.818/4.884 | 96 | 0 | |
| A | 1.954/1.979 | 0.056/0.100 | 151.5-154.4∘ | 149.8-152.5∘ | 3.299/3.487 | 4.835/4.869 | 54 | 0 | |
| B | 1.966/1.966 | 0.020/0.016 | 150.6-153.7∘ | 150.5-153.0∘ | 3.474/3.481 | 4.856/4.857 | 29 | 0 | |
| CE | 1.991/1.943 | 0.259/0.053 | 156.0-147.8∘ | 146.6-157.1∘ | 3.526/3.125 | 4.880/4.823 | 0 | 0.57 | |
| E | 2.014/1.951 | 0.244/0.044 | 149.5-153.8∘ | 146.5-154.9∘ | 3.634/2.975 | 4.880/4.813 | - | - | |
| PrMnO3 | G | 2.044 | 0.470 | 148.3∘ | 146.3∘ | 3.662 | 3.662 | 22 | 1.31 |
| C | 2.045 | 0.460 | 147.7∘ | 146.5∘ | 3.702 | 4.903 | 29 | 0.90 | |
| A | 2.039 | 0.406 | 148.2∘ | 147.8∘ | 3.772 | 4.903 | 0 | 1.05 | |
| B | 2.039 | 0.392 | 147.7∘ | 148.0∘ | 3.819 | 4.902 | 10 | 1.33 |
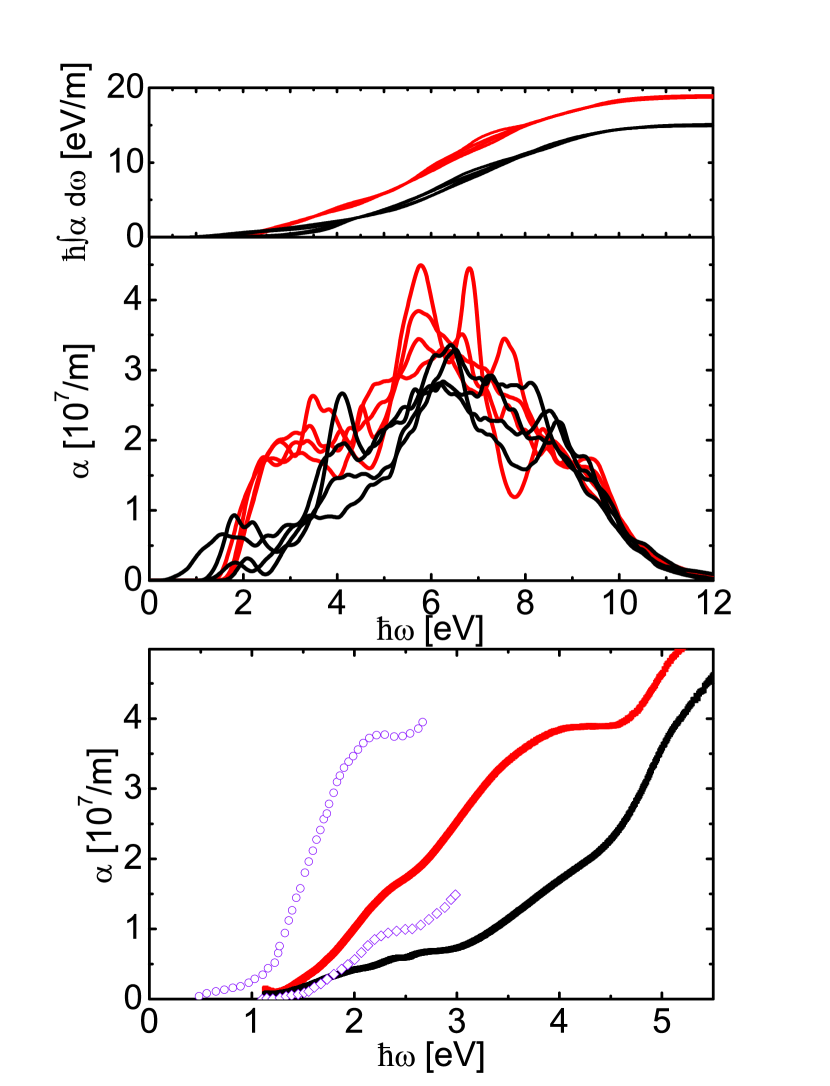
The absorption edge of the charge-transfer transitions in PrMnO3 exhibit a considerable shift towards higher energies as compared to CaMnO3. Only part of this effect can be attributed to a Coulomb shift. Comparing the calculated absorption spectra of PrMnO3 and CaMnO3, there is a marked loss of absorption intensity between 2 eV and 4 eV, as shown in figure 12. This finding does not depend on the magnetic order considered. The loss of intensity can be attributed to reduction of the number of empty Mn- states by one quarter from CaMnO3 to PrMnO3. As states become occupied due to doping, they become unavailable as final states for an optical excitation. The states in the lower part of the Mn- spectrum are the ones that are filled, which explains, why this part disappears from the spectrum. Thus, rather than a shift of the d-states, what is observed is a depletion of the lower part of the spectrum due to charge-transfer transitions.
This analysis sheds light onto the large variation of the magnitude of the measured spectra of CaMnO3. Experimentally obtained spectra differ by a factor 2-4. In a careful analysis Asanuma et al.81 has shown that the intensity of the absorption spectra of CaMnO3 differ considerably for oxidized and reduced samples. Reduced samples contain oxygen vacancies, which introduce electrons into the Mn-d shell. As in PrMnO3, these electrons occupy the lower Mn-d states and, thus, make them unavailable as final states for charge-transfer transitions. Thus, the apparent variation of the absorption intensity can be traced back to a microscopic picture.
V.3 Half-doped manganite Pr1/2Ca1/2MnO3
In the half-doped Pr1/2Ca1/2MnO3, the Jahn-Teller polaron, which dominates the electronic structure of PrMnO3, is replaced by a Zener polaron, which is characterized by an electron shared by two ferromagnetically coupled Mn neighbors.
Characteristic for a Zener polaron are two neighboring Mn sites, both having a Jahn-Teller expansion along the axis of the pair. This is opposite to the orbital ordering in PrMnO3, which exhibits an alternating series of prolate and oblate octahedral distortions in the -plane direction.
While the band gap in PrMnO3 is mostly due to Jahn-Teller splitting, in Pr1/2Ca1/2MnO3 the lower Jahn-Teller band is itself split into two, of which only one is occupied.
These two bands can be attributed to bonding and antibonding states with respect to the oxygen bridge. More precisely, a three-center bond is formed between two neighboring Mn-sites and a bridging oxygen ion. A three-center bond consists of a lower, bonding orbital, non-bonding orbital in the middle and an upper antibonding orbital. The bonding state is energetically located at the bottom of the oxygen valence band. The non-bonding state is the filled state of the Zener polaron and the antibonding state of the three-center bond remains unoccupied in the half-doped material.
The prototypical order of Zener polarons at half filling is related to the E-type magnetic structure shown in figure 13. We find this magnetic order higher in energy than the CE-type magnetic structure. In the CE-type magnetic structure the Zener-polarons polymerize so that the material exhibits one-dimensional zig-zag chains of ferromagnetically coupled Mn ions.
V.3.1 CE-type magnetic order
In order to understand the orbital ordering in the CE-type structure it is helpful to consider a set of symmetry-adapted orbitals constructed from majority-spin orbitals. Their schematic sketches are shown in figure 14.
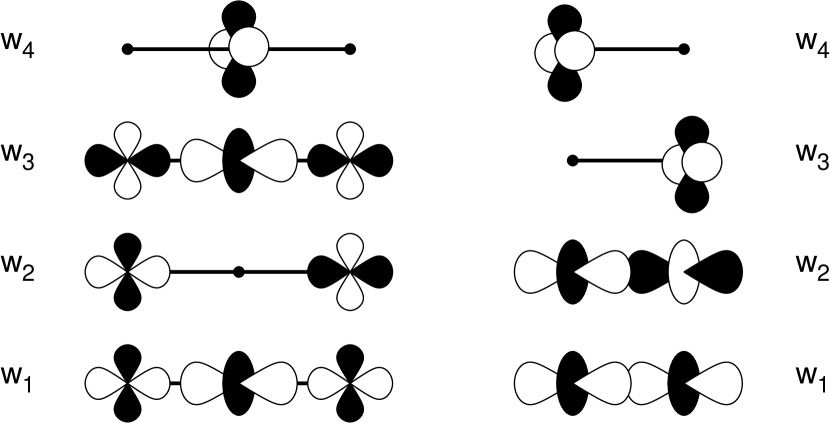
The first orbital is a Wannier orbital for the occupied band. It is localized on the three Mn ions forming one segment of the ferromagnetically aligned zig-zag chain of CE-type Pr1/2Ca1/2MnO3.
| (77) |
For a three Mn-ion segment oriented in -direction, the central axial orbital is the orbital on the central atom. The second, equatorial orbital on the central site with character is denoted as .
The -orbitals at the corners of the segment are transformed into a set of two orthonormal orbitals, and , each of which is oriented along one of the two segments of the zig-zag chain. The resulting orbitals for the segment oriented along the -direction are
| (78) |
The orbital rotated by 90∘ is obtained by flipping the sign of the -contribution in Eq. 78.
The cubic harmonics are not aligned with the cartesian coordinates, but are chosen consistent with the orientation of the corresponding octahedron.
The remaining Hilbert space of orbitals of one segment of the zig-zag chain is spanned by the following three orthonormal orbitals
| (79) |
shown in figure 14.
The value of the orbital-mixing angle has been extracted from the ab-initio DoS. The best description of the valence band by the orbital alone is obtained with an orbital-mixing angle . This implies that the probability for the electrons to reside on the central site is as opposed to on the corner sites.
The Jahn-Teller distortion of the central Mn ion with perfect orbital polarization is expected to scale about linearly with charge. This is a direct consequence of Eq. 45. For the calculated Jahn-Teller distortion of 0.259 Å, Eq. 45 yields a net occupation of 0.63 electrons on the central site. A third, independent measure for the charge disproportionation is the variation of the calculated magnetic moments, which indicate that 0.7 electrons reside on the central atom versus 0.3 electrons on the corner sites. Thus, our calculations indicate charges with a charge-disproportionation parameter in the range from 0.13 e to 0.25 e.
The measured charge disproportionation is even smaller than the calculated ones. EELS line scan along the ordering axis in Pr1/2Ca1/2MnO3 reveal that the variation of the Mn valence state is below the measurement resolution, i.e. . However, a pronounced variation of the O pre-edge intensity is found 4. Valence-sum analysis using the refined structure reveals a charge difference on two Mn sites below 0.04. XANES studies of a full Pr1-xCaxMnO3 doping series reveal that the Mn spectra for can not be described as a superposition of Mn3+ and Mn4+ spectra.42 For Pr0.6Ca0.4MnO3, no charge disproportionation has been found albeit with fairly large error bars,36 that are consistent with the calculated values.
The origin of the charge order in the CE-type structure has been attributed previously83 to the onsite Coulomb interaction between electrons in the shell. The origin of this effect is that the Coulomb interaction, more precisely the exchange term, favors orbital polarization. Because the -orbitals on the corner sites exhibit no orbital polarization, while the central orbital does, the effective one-particle orbital on the central site is lowered in energy. As a consequence it assumes a larger weight as compared to the corner site.
A second effect, which acts in a similar fashion, has, however, not been considered,83 namely the electron-phonon-interaction, respectively the Jahn-Teller distortions. On the corner sites, both orbitals are equally occupied, so that the orbital polarization is fully suppressed. In contrast, the central site has complete orbital polarization, which results in a pronounced Jahn-Teller distortion.
We estimate the resulting alternation of energy levels along the chain from Eq. 69 using our parameters. Using occupations of for the central site and for a corner site in the onsite model, we obtain an alternation of the energy levels by 0.06 eV from the Coulomb interaction and 1.08 eV from the Jahn-Teller effect. The estimate clearly attributes the charge disproportionation to the Jahn-Teller effect. The Coulomb interaction plays a minor role, because in the manganites the two Coulomb parameters cancel each other to a large degree.
Within the manifold of states, only the transition from to has a non-vanishing dipole matrix element. Transitions from the occupied orbital to other orbitals, on the same or other segments of the zig-zag chain, are zero. The optically active transition can thus be identified with a dipole oscillation between two corner Mn ions. The spectrum is shown in figure 10 alongside the experimental data.
The peak position at 1.5 eV is in agreement with the measured peak position of 1.25 eV at 80 K of the optical conductivity due to the near-infrared (NIR) absorption.43
Interestingly, there is a fundamental difference in the nature of the NIR absorption in the undoped manganite PrMnO3 and the one in the half-doped material Pr1/2Ca1/2MnO3. Whereas the former can be attributed to an excitation from the lower to the upper Jahn-Teller band of two neighboring Mn sites,82 the other is an excitation of a Zener polaron. To be precise, it is an excitation within a ferromagnetic chain of polymerized Zener polarons. The orbital order in -plane of PrMnO3 results in a small delocalization of the bands and thus a small matrix element. The dipole matrix element in the half-doped manganite on the other hand is large in comparison. This is in accord with the measured doping dependence of the optical conductivity.43 The spectral weight increases from 125 eV/(cm) to 300 eV/(cm) from to .43
We obtain a fundamental band gap of 0.57 eV for the Pr1/2Ca1/2MnO3 in the CE-type structure, and a direct band gap of 0.72 eV. All simple magnetic orders, namely G-type, C-type, A-type and the ferromagnetic B-type order are energetically unfavorable and do not exhibit a finite band gap in our calculations.
The calculated band gap of 0.57 eV for the half-doped material is about 0.2 eV larger than experiment: Mildner et al.43 obtained a band gap of 0.37 eV at 80 K for doping . These values have been obtained from the extrapolated onset of the optical conductivity of transitions between Jahn-Teller split states (peak B in Mildner et al.43). The onset of optical conductivity at reduced energy may be due to electronic transitions from phonon excited states. The band gap due to Jahn-Teller splitting is larger than the charge order gap at x=0.5, which has been estimated to be 0.15 eV at 80 K84 and 0.18 eV obtained at 10 K for .85
VI Conclusion
The electronic, magnetic and atomic structure of Pr1-xCaxMnO3 have been investigated with first-principles calculations and experimental spectroscopy studies. With the compositions , and , we cover the entire doping range. The comparison of experimental data with calculated spectra provided additional insight far beyond the capabilities of the individual techniques.
We use local hybrid functionals in our calculations that avoid the well known deficiencies of density-functional calculations, which do not account explicitly for the strong Coulomb interaction in the Mn-d shell. By adjusting a small set of free parameters to Mn-XPS data, good agreement with experimental spectra has been obtained for a large spectral range. The parameter, we obtain for the admixture of the Fock-term is substantially smaller than the value suggested on the basis of perturbation theory.56
Specifically, the features in the low-energy spectral range of the XANES and ELNES spectra, which is dominated by Mn- states responsible for the correlation effects, could be assigned to specific features of the calculated DoS. This opens new potential for analyzing future high-resolution XANES and ELNES spectra with sub-100 meV energy resolution.
Calculated band gaps lie within few tenths of an eV of the experimental data. A local analysis of the calculated absorption spectra attribute the NIR absorption band in PrMnO3 to a transition from the lower to the upper Jahn-Teller band, where the electron is excited into neighboring sites. For the half-doped material the absorption is due to an internal excitation of a Zener polaron.
The large variation of the magnitude of the absorption coefficient for upon reduction of CaMnO3 and the difference of the spectrum due to charge-transfer transitions between CaMnO3 and PrMnO3 has been traced back to the loss of spectral weight from the Mn- states, which become unavailable as final states for an optical transition as they become occupied.
The measured optical absorption due to the NIR band in PrMnO3 is substantially smaller than that in Pr1/2Ca1/2MnO3. Our calculations show that the NIR band in PrMnO3 depends strongly on the magnetic order. For the A-type order the intensities for PrMnO3 and Pr1/2Ca1/2MnO3 should be comparable. The smaller optical absorption of PrMnO3 can be explained by stronger antiferromagnetic correlations, such as in the G-type and C-type structures. We anticipate that the observed state is a thermal ensemble of several magnetic orders.
A detailed understanding of the absorption spectra and their composition dependence is expected to guide the controlled preparation of manganites.
Using the first-principles results we parameterized a model total-energy functional. An important ingredient has been a consistent description of the Coulomb interaction, because two independent Coulomb parameters lead to a near-cancellation of the electron interaction. This casts doubts on results based solely on one of the Coulomb parameters. Coulomb interaction and electron-phonon coupling, i.e. the Jahn-Teller effect, can lead to similar consequences in the electronic structure. Our calculations indicate a dominance of the Jahn-Teller effect over the Coulomb interaction within the Mn- orbital shell.
We find a considerable spatial variation of the hopping parameters, which may be due to local variations of the Mn-O tilt angles in the charge-ordered state. Compared to models developed for PrMnO3, we find rather small values for the antiferromagnetic coupling , which we extract from CaMnO3. The aggregate antiferromagnetic coupling in PrMnO3 includes the super-exchange between the electrons, which in the present model is treated explicitly through the electronic wave functions.
The individual findings on the electronic structure and the excitations provide a sound basis for the understanding of energy conversion, optically driven phase transitions, and of the doping induced changes of properties, for example in the context of electrocatalysis.
Acknowledgements
We thank Dr. Rosa Arrigo and Dr. Axel Knop-Gericke for fruitful collaboration and support at ISISS beamline. We further thank Dr. Ulrich Vetter, Prof. Hans Hofsäss and Prof. Simone Techert for providing technical equipment and support concerning the optical absorption measurements. We thank Michael Ten Brink for carefully reading the manuscript. Financial support from the Deutsche Forschungsgemeinschaft (SFB 1073) through Projects B02, B03, C02 and C03 is gratefully acknowledged.
Appendix A Hamilton matrix elements from the generalized DoS
Here we show how the hamilton matrix elements can be obtained from the generalized DoS of a first-principles calculation.
A.1 Hamiltonian of a non-orthonormal basis set
Let be the Kohn-Sham states of a density-functional calculation and let be their occupation. The Kohn Sham states are eigenstates of the Kohn-Sham Hamiltonian with energies .
We construct a basisset of local orbitals by projecting the projector functions onto the Kohn-Sham states in a given energy window . We denote the set of states with energies in the window by .
| (80) |
Hamilton and overlap matrix for this basisset can be expressed by the generalized DoS, which has matrix elements
| (81) |
The matrix elements of the Hamiltonian and those, , of the overlap matrix elements are
| (82) | |||||
| (83) |
A.2 Hamiltonian of an orthonormal basis set
In the model calculation, an orthonormal basisset is assumed. Here, we perform an approximate orthonormalization.
| (84) |
The new Hamiltonian in the orbital basis is evaluated to first order in the off-diagonal elements of Hamiltonian and overlap matrix. This yields
| (85) | |||||
where
| (86) |
The diagonal elements of the matrix of the hopping parameters vanishes.
A.3 Splitting of onsite orbitals
In order to extract the hopping parameters, we represent the orbitals in a local coordinate system suitable for a particular oxygen bridge. We consider the orbitals with the local z-axis directed towards the bridging oxygen atom.
The three onsite energies obtained from the onsite energies of the three octahedral axes contain the full information for the onsite Hamiltonian of a given Mn-site. The quantity of interest for the parameterization is the energy separation of the two onsite levels, which enters the parameter determination as and , respectively.
For each site we thus obtain the onsite hamiltonian expectation values for three non-orthonormal orbitals , , aligned with the three octahedral axes from the corresponding level energies . The bar ontop of the symbol shall avoid confusion with the matrix elements in the basis .
Appendix B Optical absorption expressed in local orbitals
In order to relate the measured optical absorption spectra to specific features in the DoS, it is desirable to express the optical absorption in terms of local orbitals. This expression is developed here.
Using second order perturbation theory in the limit of a nearly monochromatic perturbation, we obtain the transition probability from an initial state with energy to a final state at energy as
where the perturbation of the hamiltonian is with a pulse shape . The pulse shape is normalized . is the Fermi function.
The electromagnetic vector potential and the scalar potential of a light pulse are described in the Coulomb gauge as
| (89) |
where , is a normalized polarization vector and is the dominant wave vector of the light pulse. Some caution is needed due to the units we use for and , namely for and for .
The perturbation to first-order in the vector potential is
We use to introduce the commutator with the unperturbed Hamiltonian . After removing all but the leading-order terms in the size of the wave vector, we obtain
| (91) |
We express the wave functions in Eq. LABEL:eq:transprobability in terms of orthonormal local orbitals using
| (92) |
and we use the DoS matrix
| (93) |
The matrix elements of the perturbation , Eq. 91, between local orbitals can be evaluated using the hamilton matrix from Eq. 85 as
| (94) |
as
| (95) | |||||
The absorption coefficient is the ratio of absorbed versus incident energy per unit thickness of the absorbing material,
| (96) |
with the Poynting vector . For the light pulse of Eq. 89, the Poynting vector obeys
| (97) |
The sums over initial and final states are performed over all states in the region with volume .
Putting Eq. 96 together with Eq. 97, LABEL:eq:transprobability, 92, 93, and 95, we obtain the absorption coefficient as
| (98) | |||||
where we used and the value of the dimension-less fine-structure constant . Eq. 98 is valid in the limits of low intensity, large wave-length and slow variation of the pulse shape.
Now, we specialize the result to the Mn- orbitals. Assuming a pure angular-momentum character and vanishing spatial overlap of orbitals centered at different sites , the matrix elements simplify to
| (99) |
In practice, it will be convenient to form a new basisset as superposition of Mn- orbitals, so that
| (100) |
We obtain the final result
| (101) | |||||
As the last step, we introduce the diagonal approximation by including only contributions from the diagonal matrix elements of the DoS. That is, we only consider the diagonal elements of the DoS in the new basisset.
This expression allows one to estimate the absorption probability from a joint DoS.
Note, however, that the diagonal approximation is accurate for a basisset that already separates filled and empty states. If this requirement is violated, a reasonable approximation would be to perform again a sum over all orbital pairs, that is over all bonds, but to include all contributions from that pair. The additional terms depend on the off-diagonal terms of the DoS, i.e. the COOPs. In the present paper this term is omitted, based on a careful choice of the orbital basis.
The main approximations are
-
•
the underlying independent-particle picture,
-
•
the assumption in Eq. 99 that the orbitals have a pure angular momentum character of -type and no spatial overlap, and
-
•
the diagonal approximation for the DoS matrix in Eq. LABEL:eq:absonsite.
The main caveat of this local analysis of optical absorption is the violation of momentum conservation, which is responsible for the allowing transitions that preserve the Bloch vector. This, however, turns into an advantage in strongly correlated materials, where inhomogeneous fluctuations of the charge, orbital, spin, or lattice degrees of freedom break translational symmetry, respectively provide the momentum required for otherwise forbidden transitions. If the long-range translational symmetry is broken, the coherence length of the electrons is small, so that the local picture becomes valid.
References
- Tokura 2006 Y. Tokura, Rep. Prog. Phys. 69, 797 (2006).
- Imada et al. 1998 M. Imada, A. Fujimori, and Y. Tokura, Rev. Mod. Phys. 70, 1039 (1998).
- Jirak et al. 1985 Z. Jirak, S. Krupicka, Z. simsa, and M. D. nd S. Vratislav, J. Magn. Magn. Mat. 53, 153 (1985).
- Jooss et al. 2007 C. Jooss, L. Wu, T. Beetz, R. F. Klie, M. Beleggia, M. A. Schofield, S. Schramm, J. Hoffmann, and Y. Zhu, Proc. Natl. Acad. Sci. USA 104, 13597 (2007).
- Tomioka et al. 1996 Y. Tomioka, A. Asamitsu, H. Kuwahara, Y. Moritomo, and Y. Tokura, Phys. Rev. B 53, R1689 (1996).
- Salamon and Jaime 2001 M. Salamon and M. Jaime, Rev. Mod. Phys. 73, 583 (2001).
- Dagotto et al. 2001 E. Dagotto, T. Hota, and A. Moreo, Phys. Rep. 344, 1 (2001).
- Dagotto 2002 E. Dagotto, Nanoscale Phase Separation and Colossal Magneto-resistance (Springer, 2002).
- Goodenough 1955 J. B. Goodenough, Phys. Rev. 100, 564 (1955).
- Mannella et al. 2005 N. Mannella, W. L. Yang, X. J. Zhou, H. Zheng, J. F. Mitchell, J. Zaanen, T. P. Devereaux, N. Nagaosa, Z. Hussain, and Z.-X. Shen, Nature 438, 474 (2005).
- Rozenberg et al. 2006 M. Rozenberg, I. Inoue, and M. Sánchez, Appl. Phys. Lett. 88, 033510 (2006).
- Molinari et al. 2014 M. Molinari, D. A. Tompsett, S. C. Parker, F. Azough, and R. Freer, J. Mater. Chem. A 2, 14109 (2014).
- Dho 2010 J. Dho, Solid State Commun. 150, 2243 (2010).
- Saucke et al. 2012 G. Saucke, J. Norpoth, C. Jooss, D. Su, and Y. Zhu, Phys. Rev. B 85, 165315 (2012).
- Raabe et al. 2012 S. Raabe, D. Mierwaldt, J. Ciston, M. Uijttewaal, H. Stein, J. Hoffmann, Y. Zhu, P. Blöchl, and C. Jooss, Adv. Funct. Mater. 22, 3378 (2012).
- Ferreira et al. 2004 K. Ferreira, T. Iverson, K. Maghlaoui, J. Barber, and S. Iwata, Science 303, 1831 (2004).
- Rossmeisl et al. 2007 J. Rossmeisl, Z.-W. Qu, H. Zhu, G.-J. Kroes, and J. Nørskov, J. Electroanal. Chem. 607, 83 (2007).
- Man et al. 2011 I. C. Man, N. G. Inoglu, J. Kitchin, T. F. Jaramillo, J. K. N rskov, and J. Rossmeisl, ChemCatChem 3, 1159 (2011).
- Suntivich et al. 2011 J. Suntivich, K. J. May, H. A. Gasteiger, J. B. Goodenough, and Y. Shao-Horn, Science 334, 1383 (2011).
- Hong et al. 2015 W. T. Hong, M. Risch, K. A. Stoerzinger, A. Grimaud, J. Suntivich, and Y. Shao-Horn, Energy and Environmental Science 8, 1404 (2015).
- Ramirez 1997 A. Ramirez, J. Phys.: Condens. Matter 9, 8171 (1997).
- Stankiewicz et al. 2000 J. Stankiewicz, J. Sesé, J. García, J. Blasco, and C. Rillo, Phys. Rev. B 61, 11236 (2000).
- Satpathy et al. 1996 S. Satpathy, Z. S. Popovic, and F. R. Vukajlovic, Phys. Rev. Lett 76, 960 (1996).
- Anisimov et al. 1991 V. I. Anisimov, J. Zaanen, and O. K. Andersen, Phys. Rev. B 44, 943 (1991).
- Becke 1993 A. D. Becke, J. Chem. Phys. 98, 1372 (1993).
- Heyd et al. 2003 J. Heyd, G. Scuseria, and M. Ernzerhof, J. Chem. Phys. 118, 8207 (2003).
- Hedin 1965 L. Hedin, Phys. Rev. 139, A796 (1965).
- Franchini et al. 2012 C. Franchini, R. Kovacik, M. Marsman, S. S. Murthy, J. He, C. Ederer, and G. Kresse, J. Phys.: Condens. Matter 24, 235602 (2012).
- Kovacik et al. 2016 R. Kovacik, S. S. Murthy, C. E. Quiroga, C. Ederer, and C. Franchini, Phys. Rev. B 93, 075139 (2016).
- Franchini 2014 C. Franchini, J. Phys.: Condens. Matter 26, 253202 (2014).
- Ederer et al. 2007 C. Ederer, C. Lin, and A. J. Millis, Phys. Rev. B 76, 155105 (2007).
- Kováčik and Ederer 2010 R. Kováčik and C. Ederer, Phys. Rev. B 81, 245108 (2010).
- Kováčik and Ederer 2011 R. Kováčik and C. Ederer, Phys. Rev. B 84, 075118 (2011).
- He et al. 2012 J. He, M.-X. Chen, X.-Q. Chen, and C. Franchini, Phys. Rev. B 85, 195135 (2012).
- He and Franchini 2012 J. He and C. Franchini, Phys. Rev. B 86, 235117 (2012).
- Grenier et al. 2004 S. Grenier, J. P. Hill, D. Gibbs, K. J. Thomas, M. v. Zimmermann, C. S. Nelson, V. Kiryukhin, Y. Tokura, Y. Tomioka, D. Casa, T. Gog, and C. Venkataraman, Phys. Rev. B 69, 134419 (2004).
- Daoud-Aladine et al. 2002 A. Daoud-Aladine, J. Rodriguez-Carvajal, L. Pinsard-Gaudart, M. T. Fernández-Diaz, and A. Revcolevschi, Phys. Rev. Lett. 89, 097205 (2002).
- Wu et al. 2007 L. Wu, R. F. Klie, Y. Zhu, and C. Jooss, Phys. Rev. B 76, 174210 (2007).
- Efremov et al. 2004 D. V. Efremov, J. van den Brink, and D. I. Khomskii, Nature Materials 3, 853 (2004).
- Colizzi et al. 2010 G. Colizzi, A. Filippetti, and V. Fiorentini, Phys. Rev. B 82, 140101 (2010).
- Giovannetti et al. 2009 G. Giovannetti, S. Kumar, J. van den Brink, and S. Picozzi, Phys. Rev. Lett. 103, 037601 (2009).
- Mierwaldt et al. 2014 D. Mierwaldt, S. Mildner, R. Arrigo, A. Knop-Gericke, E. Franke, A. Blumenstein, J. Hoffmann, and C. Jooss, Catalysts 4, 129 (2014).
- Mildner et al. 2015 S. Mildner, J. Hoffmann, P. E. Blöchl, S. Techert, and C. Jooss, Phys. Rev. B 92, 035145 (2015).
- Hohenberg and Kohn 1964 P. Hohenberg and W. Kohn, Phys. Rev. 136, B864 (1964).
- Kohn and Sham 1965 W. Kohn and L. J. Sham, Phys. Rev. 140, A1133 (1965).
- Blöchl 1994 P. E. Blöchl, Phys. Rev. B 50, 17953 (1994).
- Blöchl and Först 2012 P. E. Blöchl and C. Först, arXiv 1210.5937 (2012), arXiv:1210.5937 [physics.chem-ph] .
- Poeppelmeier et al. 1982 K. R. Poeppelmeier, M. E. Leonowicz, J. C. Scanlon, J. M. Longo, and W. Yelon, J. Solid State Chem. 45, 71 (1982).
- Alonso et al. 2000 J. A. Alonso, M. J. Martínez-Lope, M. T. Casais, and M. T. Fernández-Díaz, Inorg. Chem. 39, 917 (2000).
- Wollan and Koehler 1955 E. Wollan and W. Koehler, Phys. Rev. 100, 545 (1955).
- Adamo and Barone 1999 C. Adamo and V. Barone, J. Chem. Phys. 110, 6158 (1999).
- Perdew et al. 1996a J. P. Perdew, K. Burke, and M. Ernzerhof, Phys. Rev. Lett 77, 3865 (1996a).
- Novák et al. 2006 P. Novák, J. Kunescaron, L. Chaput, and W. E. Pickett, Phys. Status Solidi B 243, 563 (2006).
- Tran et al. 2006 F. Tran, P. Blaha, K. Schwarz, and P. Novák, Phys. Rev. B 74, 155108 (2006).
- Blöchl et al. 2011 P. E. Blöchl, C. F. J. Walther, and T. Pruschke, Phys. Rev. B 84, 205101 (2011).
- Perdew et al. 1996b J. P. Perdew, M. Ernzerhof, and K. Burke, J. Chem. Phys. 105, 9982 (1996b).
- Blöchl et al. 2013 P. E. Blöchl, T. Pruschke, and M. Potthoff, Phys. Rev. B 88, 205139 (2013).
- Andersen and Jepsen 1984 O. K. Andersen and O. Jepsen, Phys. Rev. Lett 53, 2571 (1984).
- Wooten 1972 F. Wooten, Optical Properties of Solids (Academic Press, 1972).
- Egerton 2007 R. Egerton, Ultramicroscopy 107, 565 (2007).
- Seah and Dench 1979 M. Seah and W. Dench, Surf. Interface Anal. 1, 2 (1979).
- Laskowski and Blaha 2010 R. Laskowski and P. Blaha, Phys. Rev. B 82, 205104 (2010).
- Davoli et al. 1986 I. Davoli, A. Marcelli, A. Bianconi, M. Tomellini, and M. Fanfoni, Phys. Rev. B 33, 2979 (1986).
- Savitzky and Golay 1964 A. Savitzky and M. J. E. Golay, Analytical Chemistry 36, 1627 (1964).
- Knop-Gericke et al. 2009 A. Knop-Gericke, E. Kleimenov, M. Hävecker, R. Blume, D. Teschner, S. Zafeiratos, R. Schlögl, V. I. Bukhtiyarov, V. V. Kaichev, I. P. Prosvirin, A. I. Nizovskii, H. Bluhm, A. Barinov, P. Dudin, and M. Kiskinova (Academic Press, 2009) pp. 213 – 272.
- Shirley 1972 D. A. Shirley, Phys. Rev. B 5, 4709 (1972).
- Hotta 2006 T. Hotta, Rep. Prog. Phys. 69, 2061 (2006).
- Kurash et al. 2000 I. Kurash, L. Fengqin, Q. Haijie, G. Lin, X. Dingchang, X. Guangcheng, and W. Sicheng, Mat. Sci. Eng. B 76, 14 (2000).
- Wadati et al. 2007 H. Wadati, A. Maniwa, I. Ohkubo, H. Kumigashira, A. Fujimori, M. Oshima, M. Lippmaa, M. Kawasaki, and H. Koinuma, J. Magn. Magn. Mat. 310, 963 (2007).
- Luo et al. 2007 W. Luo, A. Franceschetti, M. Varela, J. Tao, S. J. Pennycook, and S. T. Pantelides, Phys. Rev. Lett. 99, 036402 (2007).
- Kanamori 1960 J. Kanamori, J. Appl. Phys 31, S14 (1960).
- Janak 1978 J. Janak, Phys. Rev. B 18, 7165 (1978).
- Hotta and Dagotto 2002 T. Hotta and E. Dagotto, eprint arXiv:cond-mat/0212466 (2002), cond-mat/0212466 .
- Kanamori 1963 J. Kanamori, Prog. Theor. Phys. 30, 275 (1963).
- Kugel and Khomskii 1973 K. Kugel and D. Khomskii, Sov. Phys.-JETP. 37, 725 (1973).
- Pavarini et al. 2008 E. Pavarini, E. Koch, and A. I. Lichtenstein, Phys. Rev. Lett. 101, 266405 (2008).
- Flesch et al. 2012 A. Flesch, G. Zhang, E. Koch, and E. Pavarini, Phys. Rev. B 85, 035124 (2012).
- Millis et al. 1996 A. J. Millis, R. Mueller, and B. I. Shraiman, Phys. Rev. B 54, 5405 (1996).
- Loshkareva et al. 2004 N. N. Loshkareva, L. V. Nomerovannaya, E. V. Mostovshchikova, A. A. Makhnev, Y. P. Sukhorukov, N. I. Solin, T. I. Arbuzova, S. V. Naumov, N. V. Kostromitina, A. M. Balbashov, and L. N. Rybina, Phys. Rev. B 70, 224406 (2004).
- Jung et al. 1997 J. H. Jung, K. H. Kim, D. J. Eom, T. W. Noh, E. J. Choi, J. Yu, Y. S. Kwon, and Y. Chung, Phys. Rev. B 55, 15489 (1997).
- Asanuma et al. 2009 S. Asanuma, H. Akoh, H. Yamada, and A. Sawa, Phys. Rev. B 80, 235113 (2009).
- Kim et al. 2006 M. W. Kim, S. J. Moon, J. H. Jung, J. Yu, S. Parashar, P. Murugavel, J. H. Lee, and T. W. Noh, Phys. Rev. Lett. 96, 247205 (2006).
- van den Brink et al. 1999 J. van den Brink, G. Khaliullin, and D. Khomskii, Phys. Rev. Lett. 83, 5118 (1999).
- Ebata et al. 2007 K. Ebata, M. Hashimoto, K. Tanaka, A. Fujimori, Y. Tomioka, and Y. Tokura, Phys. Rev. B 76, 174418 (2007).
- Okimoto et al. 1998 Y. Okimoto, Y. Tomioka, Y. Onose, Y. Otsuka, and Y. Tokura, Phys. Rev. B 57, R9377 (1998).