Delineating the role of ripples on thermal expansion of honeycomb materials: graphene, 2D-h-BN and monolayer(ML)-MoS2
Abstract
We delineated the role of thermally excited ripples on thermal expansion properties of 2D honeycomb materials (free-standing graphene, 2D h-BN, and ML-MoS2), by explicitly carrying out three-dimensional (3D) and two-dimensional (2D) molecular dynamics simulations. In 3D simulations, the in-plane lattice parameter (a-lattice) of graphene and 2D h-BN shows thermal contraction over a wide range of temperatures and exhibits a strong system size dependence. The 2D simulations of the very same system show a reverse trend, where the a-lattice is expanding in the whole computed temperature range. Contrary to graphene and 2D h-BN, the a-lattice of ML-MoS2 shows thermal expansion in both 2D and 3D simulations and their system size dependence is marginal. By analyzing the phonon dispersion at 300 K, we found that the discrepancy between 2D and 3D simulations of graphene and 2D h-BN is due to the absence of out-of-plane bending mode (ZA) in 2D simulations, which is responsible for thermal contraction of a-lattice at low temperature. Meanwhile, all the phonon modes are present in 2D phonon dispersion of ML-MoS2, which indicates that the origin of ZA mode is not purely due to out-of-plane movement of atoms and also its effect on thermal expansion is not significant as found in graphene and 2D h-BN.
I Introduction
Graphene has got enormous attraction due its fascinating electronic, thermal and mechanical propertiesGeim and Novoselov (2007); Balandin (2011); Lee et al. (2008), and it is proposed as a promising candidate for next generation electronic industryGeim and Novoselov (2007); Schwierz (2010); Castro Neto et al. (2009). The major pitfall in graphene based electronics is the absence of finite band gap in its electronic band structure. After successful isolation of graphene, the search for other 2D honeycomb materials were geared up in past few years. The 2D hexagonal (h)-BN, which is isostructural to graphene, is an insulator with a finite band gap ~5-6 eV Golberg et al. (2010), and exhibits intriguing electronic propertiesGolberg et al. (2010); Shi et al. (2010); Watanabe et al. (2004). The family of 2D materials are getting richer day by dayGeim and Grigorieva (2013). Apart from graphene and h-BN, monolayer(ML)-MoS2 is another high interesting 2D honeycomb materialChhowalla et al. (2013); Huang et al. (2013). ML-MoS2 is a direct band gapChhowalla et al. (2013) (1.9 eV) semiconductor, and it exhibits high photoluminescence yieldSplendiani et al. (2010), which puts this material in the front-end of optoelectronic industry. The ML-MoS2 based field effect transistors (FETs) shows high carrier mobilityRadisavljevicB et al. (2011) and on/off ratiosRadisavljevicB et al. (2011); Min et al. (2013); Na et al. (2014).
Structural stability of the 2D crystals was an old dispute in condensed matter theory. According to Mermin-Wagner theoremMermin (1968), the long wavelength thermal fluctuations will destroy the long-range order in 2D crystals. But in the case of graphene and 2D h-BN, these fluctuations are suppressed by strong anharmonic coupling between in-plane stretching and out-of-plane bending modes, leading to height fluctuations on the surface, known as ripplesFasolino et al. (2007). These intrinsic ripples are inevitable in 2D crystals, and they stabilizes the 2D membranes Fasolino et al. (2007); Anees et al. (2015, 2016a). Transmission electron microscopic study reveals that, the suspended graphene sheets are not perfectly flat, they exhibits out-of-plane deformationsMeyer et al. (2007). Recent experiments using high resolution atomic force microscopy, shows sinusoidal ripples of periodicity 3 to 6 nm and amplitude of 10 to 100 pm on the surfaces of graphene and 2D h-BN layer of supported flakesGallagher et al. (2015). The ripples structure in graphene could be manipulated to sketch devices based on local strainPereira and Castro Neto (2008) and band gap engineeringElias et al. (2009).
For aforementioned applications of 2D materials, knowledge of linear thermal expansion coefficients (LTECs) is essential. Several studies has been reported the LTEC of graphene both from simulationsMounet and Marzari (2005); Zakharchenko et al. (2009); Pozzo et al. (2011); Sevik (2014); Anees et al. (2015) and experimentsBao et al. (2009); Singh et al. (2010); Yoon et al. (2011); Pan et al. (2012). Mounet and Marzari Mounet and Marzari (2005) predicts that the LTECs of graphene remains to be negative upto 2300 K using quasi-harmonic calculations. Zakhrchenko et alZakharchenko et al. (2009) performed Monte-Carlo (MC) simulations and found that in-plane lattice parameter (a-lattice) contracts with temperature upto T = 900 K and further it expands. Ab initio molecular dynamics (MD) simulations by Pozzo et alPozzo et al. (2011) shows that the C-C distance increases with an increase in temperature for both supported and free-standing graphene; meanwhile the a-lattice is found to be contracting with an increase in temperature (upto 2000 K) in free-standing graphene. The above discrepancies among the various simulations arises due to the difference in the incorporation of anharmonicity in those calculations, its effects are very strong in 2D crystalsAnees et al. (2015). From the experimental front, Bao et alBao et al. (2009), reported the negative thermal expansion of graphene in the temperature range 200 K - 400 K. Later, Yoon et alYoon et al. (2011), also found that thermal expansion coefficient of graphene is negative in the above temperature range using temperature dependent Raman spectroscopy. The authors also observed the strain effect induced by substrate-layer interaction can alter the physical properties of graphene.
In quasi-harmonic approximation (QHA) the 2D sheets are considered to be flat, hence the effects of ripples cannot be incorporated in a direct manner. Moreover, within the ab initio frame work we cannot include more than few hundreds of atoms in the simulation cell, which seems to be in-adequate to incorporate the long wavelength ripples. From the experimental perspective, most of the measurements are made on graphene supported on a substrate or over a trench, such measurements are extremely challenging due to the strain effects, and may not be able to capture the intrinsic thermal expansion properties of free-standing graphene with ripples. Classical MD simulations can incorporate millions of atoms and also computation can be done with free-standing sheets contains all rippling effects, hence it will be an ideal choice to overcome the above limitations. The thermal expansion of graphene has been reported in various studies as mentioned above. However, the thermal expansion of 2D h-BN and ML-MoS2 are not studied in detail, which is essential to devise hybrid nano-devices and hetero-structures Geim and Grigorieva (2013). The objective of the present paper is to understand the the role of ripples on thermal expansion properties of honeycomb materials explicitly. To delineate the role of ripples, we studied the the thermal expansions of very same system using three-dimensional (3D) and two-dimensional (2D) molecular dynamics (MD) simulations, the later cannot incorporate the effects ripples.
II Computational methods
All simulations are done using classical MD simulation package LAMMPSPlimpton (1995). To understand the role of ripples, we explicitly carried out 2D and 3D simulations of very same system at different temperatures. In 2D simulations, we arrested the motion of atom along the direction normal to the sheet and prevent the formation of thermally excited ripples using fix enforce2d commandPlimpton (1995). Ripples are naturally included in 3D simulations and leads to a corrugated surface instead of flat 2D sheet. Simulation cell of different sizes are used to incorporate the effects of long wavelength ripples. Periodic boundary conditions (PBC) are employed in all the three directions. To avoid the un-physical interactions between the periodic images, the sheets are stacked one above another with an additional vacuum separation of 15 Å. In this study, we employed empirical interatomic potentials (EIP) to model the interactions in honeycomb structures. We followed the same algorithm for both 2D and 3D simulations which is given below. Inorder to eliminate any residual stresses that could be present in the initial configuration, the geometry is relaxed using conjugate gradient algorithm. The system is then equilibrated for 500 picoseconds (ps) in isobaric-isothermal (NPT) ensemble at desired temperatures and ambient pressure. After ensuring the proper equilibration and thermalization, we monitored the variation of lattice parameters as a function temperatures. The whole simulations are done for 3.2 nanoseconds. The linear thermal expansion coefficients (LTECs) are obtained by direct numerical differentiation (equation 1) of above data.
| (1) |
III Results and Discussions
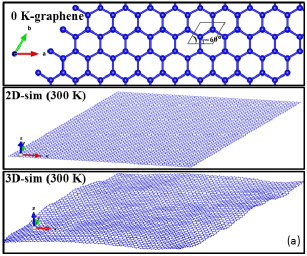
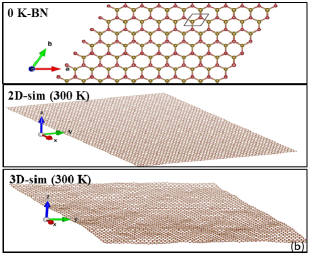
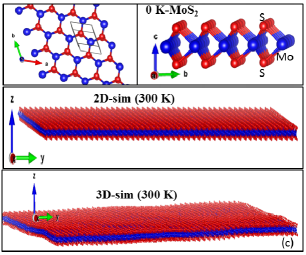
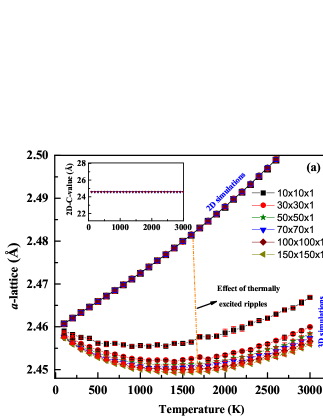
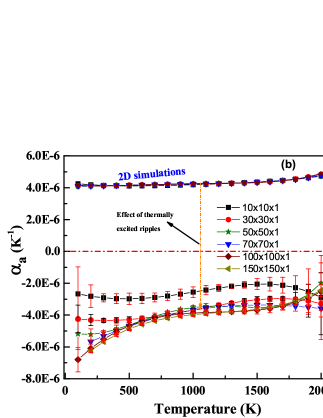
Figure 1 displays the configuration of graphene, 2D h-BN and ML-MoS2 at 300 K. In 2D simulation, we obtained a flat 2D sheet without any ripples, while 3D simulation shows corrugations on the surface due to the formation of ripples. The interactions between C-C atoms in honeycomb lattice of graphene is modeled using a bond-order potential (LCBOP)Los and Fasolino (2003). The LCBOP potential predict the equilibrium in-plane lattice parameter (a-lattice) a0= 2.459 Å, shows an excellent agreement with experiment (a0= 2.463 Å). We used simulation cells of various sizes (10×10×1, 30×30×1, 50×50×1, 70×70×1, 100×100×1, 150×150×1) to incorporate the effect of long wavelength ripples. Figure 2 displays the temperature dependence of a-lattice and linear LTEC of free-standing graphene. In 3D simulations, we found that the a-lattice decreases with an increase in temperature. Fourth order polynomial fit to the above data shows that minima occurs in the temperature range 1300 K - 1400 K, and further it expands with an increase in temperature, this is consistent with our previous studyAnees et al. (2015).
Noteworthy, the temperature evolution of a-lattice is system size dependent (Figure 1). For simulation cell of size 10×10×1 (contains only 200 atoms) a-lattice shows relatively less contraction with respect to bigger cells and minima occurs around T = 1100 K. As we increase the system size size, a-lattice shows a convergence from 70×70×1 (9800 atoms) onwards, and the minima falls in the temperature range 1300 K - 1400 K (dependence on system size). The similar system size dependence was reported by Pozzo et alPozzo et al. (2011), where they used simulation cells of sizes 8×8×1, 10×10×1 and 16×16×1 contains 128, 200 and 512 atoms, respectively. Fasolino et alFasolino et al. (2007) observed fluctuations with wavelength of the order of 80 Å at 300 K from their Monte Carlo simulations. To incorporate such long wave length fluctuations bigger simulation cells are required, which makes ab initio Car-Parinello simulations prohibitive. In the present study, we used a simulation cell of size 150×150×1 (45000 atoms), which is capable of incorporating all long-wavelength rippling effects.
| simulation cell size | 2D simulation | 3D simulation | expt. |
|---|---|---|---|
| 10×10×1 (200 atoms) | 5.178 | -2.499 | |
| 30×30×1 (1800 atoms) | 5.226 | -4.095 | |
| 50×50×1 (5000 atoms) | 5.235 | -4.100 | -5.500a, -7.000b,c, -8.000d |
| 70×70×1 (9800 atoms) | 5.230 | -4.380 | |
| 100×100×1 (20000 atoms) | 5.243 | -4.350 | |
| 150×150×1 (45000 atoms) | 5.241 | -4.524 |
In 3D simulations, the LTEC are negative for all simulation cells. The LTEC also shows a system size dependence and its value for 10×10×1 simulation cell is roughly half of the value of 150×150×1 cell (table 1). The value of LTEC at 300 K is in qualitative agreement with previous calculationsMounet and Marzari (2005); Zakharchenko et al. (2009); Sevik (2014). All simulations predict the LTEC roughly half of the experimental valueBao et al. (2009); Yoon et al. (2011) (table 1). Unlike DFPT calculations, present study incorporated the full anharmonicity of interatomic potential, hence the disagreement with experimental data may not be due to the strong anharmonic nature of graphene. Though the above experiments Bao et al. (2009); Yoon et al. (2011) has taken care to eliminate the strain effect induced by substrate, more accurate analysis is needed to get a clear picture. To support the above arguments, we can see the previous observation of Pozzo et alPozzo et al. (2011), when the graphene sheet was supported on Ir (111) substrate, it shows thermal expansion instead of thermal contraction. Jiang et alJiang et al. (2009) used Green’s function technique and reported that the LTEC is very sensitive to substrate layer interaction, a weak substrate-layer interaction can cause a significant change in the value of LTEC, and if the substrate effects are strong enough, the LTEC can become positive in the whole computed temperature range. Later, Pan et alPan et al. (2012), used temperature dependent Raman spectroscopy and measured a lower bound of LTEC (at 300 K of graphene which was supported on BN, while Bao et alBao et al. (2009) and Yoon et alYoon et al. (2011) used Si and SiO2 substrates to support their graphene sheet, respectively; this may be one of the reason to have different LTEC in these experiments. Our results, along with the earlier theoretical predictionsMounet and Marzari (2005); Zakharchenko et al. (2009); Sevik (2014) are in qualitative agreement with Pan et alPan et al. (2012).
The temperature dependence of a-lattice obtained from 2D simulations is shown in Figure 1. In contrast to 3D simulations, a-lattice increases with an increase in temperature, and it does not show any system size dependence. Unlike 3D simulations, the LTEC obtained from 2D simulations are all positive in sign and does not have any system size dependence (table 1). Since there is no movement of atoms along Z direction, rippling effects are absent in 2D simulations, hence a-lattice shows a thermal expansion, and the sign of LTEC is positive in the whole computed temperature range. From above observations, it can be concluded that, the long wavelength ripples are responsible for thermal contraction of free-standing graphene over a wide range of temperatures.
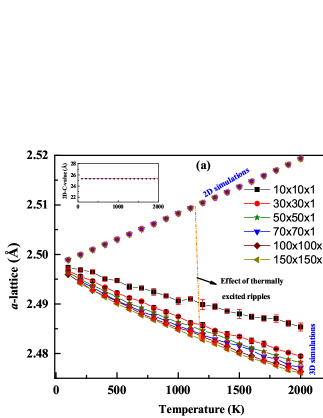
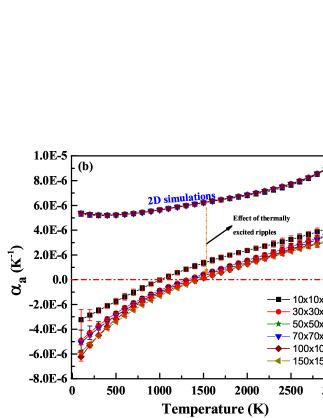
2D h-BN is another one-atom thick material, being 2D crystal, ripples are un-avoidable in 2D h-BN also; hence we extended the above analysis to 2D h-BN to understand its thermal expansion behaviour. The interaction between the B and N atom is modeled using a Tersoff type potential parametrized by Sevik et alSevik et al. (2011). The present potential predicts the structural and mechanical properties of 2D h-BN reasonably accurately. The equilibrium a-lattice obtained with present potential shows an excellent matching with experiments (a0= 2.500 Å)Pacilé et al. (2008); Nag et al. (2010). Figure 3 displays the temperature dependence of a-lattice. In 3D simulation, a-lattice decreases with an increase in temperature in the whole computed range and matching with our previous study Anees et al. (2016a). Similar to graphene, a-lattice shows a system size dependence in 2D h-BN also, and again we found a convergence from the simulation cell of size 70×70×1 (9800) onwards. Paszkowicz et alPaszkowicz et al. (2002) measured the thermal expansion (10 K - 297.5 K) of bulk h-BN using synchrotron X-ray diffraction technique, and they found that a-lattice shows a flat variation at low temperatures (10 K - 100 K), above 100 K it falls with an increase in temperatures upto 300 K. In 2D simulation, the a-lattice increases with an increase in temperature and shows thermal expansion in the whole computed temperature range. The a-lattice does not show any system size dependence in 2D simulations and it is consistent with our observations in graphene. The LTEC obtained at 300 K are shown in table 2, the system size dependence of LTEC is discernible. The LTEC at 300 K is matching with previous quasi-harmonic predictionsSevik (2014). The LTEC obtained from 2D simulations all are positive in sign and does not have any system size dependence. Like graphene, the effect of ripples are quite strong in 2D h-BN also, since the empirical potential used to study 2D h-BN and graphene are different, we are not attempting a direct comparison among their data.
| simulation cell size | 2D simulation | 3D simulation |
|---|---|---|
| 10×10×1 (200 atoms) | 4.145 | -2.940 |
| 30×30×1 (1800 atoms) | 4.130 | -4.272 |
| 50×50×1 (5000 atoms) | 4.124 | -5.151 |
| 70×70×1 (9800 atoms) | 4.129 | -5.508 |
| 100×100×1 (20000 atoms) | 4.114 | -5.509 |
| 150×150×1 (45000 atoms) | 4.107 | -5.670 |
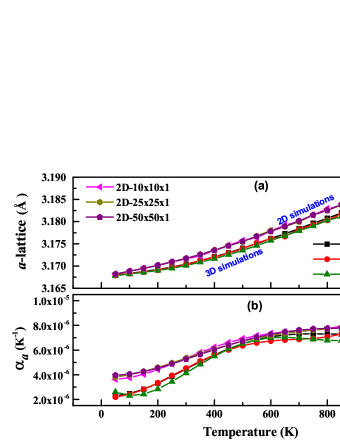
Apart from graphene and 2D-h-BN, ML-MoS2 is another high interesting honeycomb material. The Mo atom layer sandwiched in between two S atom layers (S-Mo-S sandwich structures) in a trigonal prismatic fashion (Figure 1). Liang et alLiang et al. (2009) parametrized a many body reactive empirical bond order (REBO) potential for Mo-S system. This potential could successfully model the structural and mechanical properties of Mo-S and MoS2 systems. Later, Stewart and Spearot Stewart and Spearot (2013) refined the parametrization and implemented it into MD simulation package LAMMPS. We used the parametrization of Stewart and SpearotStewart and Spearot (2013) to model the interaction between the Mo and S atoms in ML-MoS2. The present potential predicts the equilibrium a-lattice, a0 = 3.17 Å which is close to the experimentally reported value (3.16 Å)Ataca et al. (2011). Figure 4 displays the thermal expansion of a-lattice and LTEC. The a-lattice is expanding in the whole computed temperature range in both 2D and 3D simulations, and its system size dependence is marginal. The LTECs of ML-MoS2 is positive in both 2D and 3D simulations (table 3), and their magnitudes are slightly higher in 2D simulations at low temperatures (T < 300 K). The LTEC obtained from 3D simulation at 300 K (4.140) matches with previous experimental data (4.922Murray and Evans (1979). Though ML-MoS2 possess the same hexagonal honeycomb lattice structure of graphene and 2D h-BN, the a-lattice shows a positive thermal expansionHuang et al. (2014); Sevik (2014); Anees et al. (2016b) and it has been measured earlier in bulk-MoS2 using X-ray powder diffractionEl-Mahalawy and Evans (1976); Murray and Evans (1979). This contradiction with graphene and 2D h-BN can be visualized as an effect of S-Mo-S sandwich structure in ML-MoS2, which reduces the rippling behavior considerablySingh et al. (2015). The Mo-Mo distance in Mo layer is higher than that of C-C atom in graphene, hence the Mo-S interaction is responsible for lower height fluctuation of Mo atom in ML-MoS2Singh et al. (2015). This difference in thermal expansion property among the above mentioned honeycomb materials can be utilized to make future hybrid nano-devices.
| simulation cell size | 2D simulation | 3D simulation |
|---|---|---|
| 10×10×1 (300) | 5.340 | 4.469 |
| 25×25×1 (1875 atoms) | 5.343 | 4.530 |
| 50×50×1 (7500 atoms) | 5.261 | 4.140 |
Inorder to understand the underlying mechanism behind the thermal contraction or expansion of solids, Grüneisen theory has been widely usedSchelling and Keblinski (2003); Mounet and Marzari (2005); Sevik (2014). According to Grüneisen theory, modes with positive Grüneisen parameters will encourage the thermal expansion, while modes with negative Grüneisen parameter will aid thermal contraction. A solid will undergo thermal expansion or contraction is determined by the balance between the modes with positive and negative Grüneisen parametersSchelling and Keblinski (2003). For graphene, the Grüneisen parameters of low lying bending mode (ZA) become large negative (as low as -80). At low temperature only low frequency acoustic modes will be excited, (high frequency optic modes with positive Grüneisen parameters are frozen) and contributes to thermal contractionMounet and Marzari (2005); Sevik (2014). The negative Grüneisen parameter of ZA mode is due to the membrane effect, predicted by LifshitzLifshitz (1952). Apart from graphene, Sevik et alSevik (2014) extended Grüneisen theory analysis to 2D h-BN and ML-MoS2, and they observed a large negative Grüneisen parameter of ZA modes in 2D h-BN also, and it is responsible for thermal contraction. For ML-MoS2, the Grüneisen parameter associated with ZA mode is relatively small (~ -10), and leads to thermal contraction only at very low temperature (T < 20 K)Huang et al. (2014). MD simulations are not meaningful at very low temperatures, due to the manifestation of quantum effects. Hence, we performed simulations for temperatures T >100 K, so we couldn’t observe above thermal contraction effects in ML-MoS2. The Grüneisen parameter of ZA is fully negative in grapheneMounet and Marzari (2005), while in ML-MoS2 it is negative only near the point and becomes positive along K-M direction in the Brillouin zoneHuang et al. (2014) . This negative-to-positive change attributes to phononic hybridization and finite thickness effects of ML-MoS2 which counteracts the membrane effects in 2D systemsHuang et al. (2014).
The mode dependent Grüneisen parameters are computed by strain derivative of phonon frequencies which obtained using quasi-harmonic approximation (QHA)Mounet and Marzari (2005). One drawback of above method is that, under certain compressive strain, it is difficult to keep the crystal stable. When compressive strain is large enough, it leads to imaginary frequencies around the point which cannot be used to compute the mode Grüneisen parameters. Due to above limitation, wavevectors are computed with less accurate finite difference algorithm around the pointKarssemeijer and Fasolino (2010). Moreover in QHA we are using a flat 2D sheet, which is devoid of ripples. Despite the above limitations, Grüneisen theory predicts the thermal expansion of honeycomb structures reasonably well .
Instead of Grüneisen theory, here we analyzed the role of different phonon modes on thermal expansion behavior by computing the phonon dispersion at finite temperatures. Inorder to understand the effect of ripples on phonon modes, one has to compute the phonon dispersion separately from 2D and 3D simulations. Lattice dynamics (LD) methodsDove (1993) predicts the phonon frequencies and polarizations from the second derivative of interatomic potential at 0 K, hence it won’t make any difference between 2D and 3D simulations, moreover anharmonic effects are completely absent in LD methods. To over come the above limitation, we developed a spectral energy density based method to compute the phonon frequencies directly from classical MD simulations Anees et al. (2015, 2016a), it will capture the true anharmonic behavior of all phonon modes without any approximations.
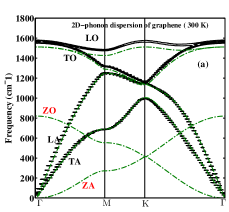
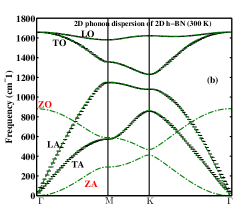
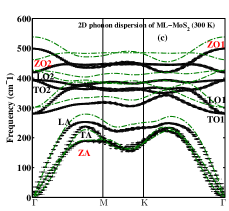
Figure 5 shows the 2D phonon dispersion of above mentioned honeycomb structures. The green dot-dash curve is obtained using LD method at 0K, the thick black curve is computed directly from MD simulation. The 3D phonon dispersions of graphene and 2D h-BN at finite temperatures are reported in our earlier papersAnees et al. (2015, 2016a), hence here we are focusing on 2D phonon dispersion at 300 K. The graphene and 2D h-BN unitcell contains 2 basis atom, which leads to six modes of vibrations, three of them are acoustic (A) and remaining three are optic (O) modes. The modes are labeled according to their polarizations, the letter ’L’, ’T’, and ’Z’ are used to denote longitudinal, transverse and out-of-plane modes respectively. The ZA mode shows a quadratic dispersion in graphene and 2D h-BN, which is a characteristic feature of layered compoundsLifshitz (1952), and it is due to point group symmetryR. Saito and Dresselhaus (1998). The Overall agreement of LD frequencies of graphene and h-BN with previous calculations are satisfactory Karssemeijer and Fasolino (2011); Sevik et al. (2011). In 2D dispersion, the in-plane acoustic modes LA and TA shows similar behavior as reported in 3D dispersionAnees et al. (2015, 2016a). The most interesting phenomena observed here is the absence of out-of-plane modes such as ZA and ZO in 2D phonon dispersions of both graphene and 2D h-BN. Since we arrested the motion of atoms along Z directions, the branches corresponding to out-of-plane motions are missing in phonon dispersion. This complete absence of ZA and ZO mode is the reason behind the continuous thermal expansion of a-lattice in 2D simulations, and this observation is completely agreeing with Grüneisen theory based analysis. The novelty of the present approach is that, it exposes the importance of out-of-plane modes (ZA) in determining the thermal expansion behavior, by computing the phonon dispersion from the typical dynamics of atoms, instead of symmetry based LD methods.
In ML-MoS2, due to the trigonal prismatic arrangement of Mo and S atoms, vibrational modes behaves quite differently from graphene and 2D h-BN. The unitcell of ML-MoS2 contains three basis atoms, hence there will be nine modes of vibrations (3 acoustic+6 optic). Figure 5c displays the phonon dispersion in h-MoS2. The LD calculations are in good agreement with previous reportsCai et al. (2014); Molina-Sánchez and Wirtz (2011). The gap between the acoustic and optic mode (TO1) is discernible, where three acoustic branches TA, LA and ZA are separated below the optic branch (TO1) by ~55 cm−1 at M point in the Brillouin zone, and it is in agreement with ab initio calculationsCai et al. (2014). The LA and TA modes show linear dispersion, while ZA mode exhibits quadratic dispersion around the point, analogous to graphene and h-BN. Unlike graphene and h-BN, all out-of-plane modes are present in 2D dispersion of ML-MoS2. Though we arrested the out-of-plane motion, the ZA and ZO branches are still persisting in ML-MoS2, and this can be ascribed to the finite thickness effect of ML-MoS2. The graphene and h-BN are one atom thick structure and have more flexibility along out-of-plane direction, the S-Mo-S sandwich structure of ML-MoS2 makes it a more rigid material along out-of-plane direction and leads to less rippling. The magnitude of thermally excited ripples can be quantified using the height-height correlation function , and its value is much smaller for ML-MoS2 in comparison with graphene, and it is an outcome of less rippling behaviour of ML-MoS2Singh et al. (2015). The finite thickness of ML-MoS2 counteracts the membrane effects, and hence the origin of bending mode (ZA) is not purely due to the out-of-plane vibrations as in graphene and h-BN.
IV Conclusions
Thermally excited ripples are inevitable in 2D crystals, and they can affect the thermo-physical properties of these materials significantly. Inorder to delineate the role of ripples on thermal expansion of 2D honeycomb materials (graphene, 2D h-BN and ML-MoS2) we performed three-dimensional (3D) and two dimensional (2D) molecular dynamics simulations, the later cannot incorporate the effects of ripples. The in-plane lattice parameter (a-lattice) of free-standing graphene calculated from 3D simulations shows a thermal contraction upto T = 1300 K - 1400 K (depend on system size) and expands thereafter. The linear thermal expansion coefficient (LTEC) changes its sign from negative to positive in the above temperature range. At the same time, the a-lattice of very same system obtained from 2D simulations shows continuous thermal expansion instead of thermal contraction and LTECs are positive for all system sizes. The above analysis was extended to 2D h-BN and found the similar discrepancy between 2D and 3D simulations. Contradicting to graphene and 2D h-BN, the a-lattice of ML-MoS2 shows thermal expansion in both 3D and 2D simulations, and the LTECs are positive and their system size dependence is marginal. The above discrepancy is analyzed by computing the 2D phonon dispersion at 300 K using spectral energy density method. The out-of-plane bending (ZA) mode is missing in 2D phonon dispersions of graphene and 2D h-BN. The ZA mode, which is responsible for thermal contraction of in-plane lattice parameter at low temperature is absent in 2D simulations, which leads to continuous thermal expansion. However, these modes are present in 2D dispersion of ML-MoS2, indicates that its origin is not purely due to the out-of-plane vibrations, and its effects on thermal expansion is not significant as found in graphene and 2D h-BN systems.
References
- Geim and Novoselov (2007) A. K. Geim and K. S. Novoselov, Nature materials 6, 183 (2007).
- Balandin (2011) A. A. Balandin, Nature materials 10, 569 (2011).
- Lee et al. (2008) C. Lee, X. Wei, J. W. Kysar, and J. Hone, Science 321, 385 (2008).
- Schwierz (2010) F. Schwierz, Nat Nano 5, 487 (2010).
- Castro Neto et al. (2009) A. H. Castro Neto, F. Guinea, N. M. R. Peres, K. S. Novoselov, and A. K. Geim, Rev. Mod. Phys. 81, 109 (2009).
- Golberg et al. (2010) D. Golberg, Y. Bando, Y. Huang, T. Terao, M. Mitome, C. Tang, and C. Zhi, ACS Nano 4, 2979 (2010).
- Shi et al. (2010) Y. Shi, C. Hamsen, X. Jia, K. K. Kim, A. Reina, M. Hofmann, A. L. Hsu, K. Zhang, H. Li, Z.-Y. Juang, et al., Nano Letters 10, 4134 (2010).
- Watanabe et al. (2004) K. Watanabe, T. Taniguchi, and H. Kanda, Nat Mater 3, 404 (2004).
- Geim and Grigorieva (2013) A. K. Geim and I. V. Grigorieva, Nature 499, 419 (2013).
- Chhowalla et al. (2013) M. Chhowalla, H. S. Shin, G. Eda, L.-J. Li, K. P. Loh, and H. Zhang, Nat Chem 5, 263 (2013).
- Huang et al. (2013) X. Huang, Z. Zeng, and H. Zhang, Chem. Soc. Rev. 42, 1934 (2013).
- Splendiani et al. (2010) A. Splendiani, L. Sun, Y. Zhang, T. Li, J. Kim, C.-Y. Chim, G. Galli, and F. Wang, Nano Letters 10, 1271 (2010).
- RadisavljevicB et al. (2011) RadisavljevicB, RadenovicA, BrivioJ, GiacomettiV, and KisA, Nat Nano 6, 147 (2011).
- Min et al. (2013) S.-W. Min, H. S. Lee, H. J. Choi, M. K. Park, T. Nam, H. Kim, S. Ryu, and S. Im, Nanoscale 5, 548 (2013).
- Na et al. (2014) J. Na, M.-K. Joo, M. Shin, J. Huh, J.-S. Kim, M. Piao, J.-E. Jin, H.-K. Jang, H. J. Choi, J. H. Shim, et al., Nanoscale 6, 433 (2014).
- Mermin (1968) N. D. Mermin, Phys. Rev. 176, 250 (1968).
- Fasolino et al. (2007) A. Fasolino, J. Los, and M. I. Katsnelson, Nature materials 6, 858 (2007).
- Anees et al. (2015) P. Anees, M. C. Valsakumar, and B. K. Panigrahi, 2D Materials 2, 035014 (2015).
- Anees et al. (2016a) P. Anees, M. C. Valsakumar, and B. K. Panigrahi, Phys. Chem. Chem. Phys. 18, 2672 (2016a).
- Meyer et al. (2007) J. C. Meyer, A. K. Geim, M. I. Katsnelson, K. S. Novoselov, T. J. Booth, and S. Roth, Nature 446, 60 (2007).
- Gallagher et al. (2015) P. Gallagher, M. Lee, F. Amet, P. Maksymovych, J. Wang, S. Wang, X. Lu, G. Zhang, K. Watanabe, T. Taniguchi, et al., ArXiv e-prints (2015).
- Pereira and Castro Neto (2008) V. M. Pereira and A. H. Castro Neto, ArXiv e-prints (2008).
- Elias et al. (2009) D. C. Elias, R. R. Nair, T. M. G. Mohiuddin, S. V. Morozov, P. Blake, M. P. Halsall, A. C. Ferrari, D. W. Boukhvalov, M. I. Katsnelson, A. K. Geim, et al., Science 323, 610 (2009).
- Mounet and Marzari (2005) N. Mounet and N. Marzari, Phys. Rev. B 71, 205214 (2005).
- Zakharchenko et al. (2009) K. V. Zakharchenko, M. I. Katsnelson, and A. Fasolino, Phys. Rev. Lett. 102, 046808 (2009).
- Pozzo et al. (2011) M. Pozzo, D. Alfè, P. Lacovig, P. Hofmann, S. Lizzit, and A. Baraldi, Phys. Rev. Lett. 106, 135501 (2011).
- Sevik (2014) C. Sevik, Phys. Rev. B 89, 035422 (2014).
- Bao et al. (2009) W. Bao, F. Miao, Z. Chen, H. Zhang, W. Jang, C. Dames, and C. N. Lau, Nat Nano 4, 562 (2009).
- Singh et al. (2010) V. Singh, S. Sengupta, H. S. Solanki, R. Dhall, A. Allain, S. Dhara, P. Pant, and M. M. Deshmukh, Nanotechnology 21, 165204 (2010).
- Yoon et al. (2011) D. Yoon, Y.-W. Son, and H. Cheong, Nano Letters 11, 3227 (2011).
- Pan et al. (2012) W. Pan, J. Xiao, J. Zhu, C. Yu, G. Zhang, Z. Ni, K. Watanabe, T. Taniguchi, Y. Shi, and X. Wang, Scientific Reports 2, 893 EP (2012).
- Plimpton (1995) S. Plimpton, Journal of Computational Physics 117, 1 (1995), URL http://lammps.sandia.gov.
- Los and Fasolino (2003) J. H. Los and A. Fasolino, Phys. Rev. B 68, 024107 (2003).
- Jiang et al. (2009) J.-W. Jiang, J.-S. Wang, and B. Li, Phys. Rev. B 80, 205429 (2009).
- Sevik et al. (2011) C. Sevik, A. Kinaci, J. B. Haskins, and T. Çağ ın, Phys. Rev. B 84, 085409 (2011).
- Pacilé et al. (2008) D. Pacilé, J. C. Meyer, Ç. Ö. Girit, and A. Zettl, Applied Physics Letters 92, 133107 (2008).
- Nag et al. (2010) A. Nag, K. Raidongia, K. P. S. S. Hembram, R. Datta, U. V. Waghmare, and C. N. R. Rao, ACS Nano 4, 1539 (2010).
- Paszkowicz et al. (2002) W. Paszkowicz, J. Pelka, M. Knapp, T. Szyszko, and S. Podsiadlo, Applied Physics A 75, 431 (2002).
- Liang et al. (2009) T. Liang, S. R. Phillpot, and S. B. Sinnott, Phys. Rev. B 79, 245110 (2009).
- Stewart and Spearot (2013) J. A. Stewart and D. E. Spearot, Modelling and Simulation in Materials Science and Engineering 21, 045003 (2013).
- Ataca et al. (2011) C. Ataca, M. Topsakal, E. Aktürk, and S. Ciraci, The Journal of Physical Chemistry C 115, 16354 (2011).
- Murray and Evans (1979) R. Murray and B. Evans, Journal of Applied Crystallography 12, 312 (1979).
- Huang et al. (2014) L. F. Huang, P. L. Gong, and Z. Zeng, Phys. Rev. B 90, 045409 (2014).
- Anees et al. (2016b) P. Anees, M. C. Valsakumar, and B. K. Panigrahi, Applied Physics Letters 108 (2016b).
- El-Mahalawy and Evans (1976) S. H. El-Mahalawy and B. L. Evans, Journal of Applied Crystallography 9, 403 (1976).
- Singh et al. (2015) S. K. Singh, M. Neek-Amal, S. Costamagna, and F. M. Peeters, Phys. Rev. B 91, 014101 (2015).
- Schelling and Keblinski (2003) P. K. Schelling and P. Keblinski, Phys. Rev. B 68, 035425 (2003).
- Lifshitz (1952) M. Lifshitz, Zh. Eksp. Teor. Fiz. 22, 475 (1952).
- Karssemeijer and Fasolino (2010) L. Karssemeijer and A. Fasolino, Master’s thesis, Theory of Condensed Matter, Institute for Molecules and Materials,Radboud University Nijmegen (2010).
- Dove (1993) M. T. Dove, Introduction to Lattice Dynamics (Cambridge University Press, 1993).
- R. Saito and Dresselhaus (1998) G. D. R. Saito and M. Dresselhaus, Physical Properties of Carbon Nanotubes (London: Imperial College Press, 1998).
- Karssemeijer and Fasolino (2011) L. Karssemeijer and A. Fasolino, Surface Science 605, 1611 (2011).
- Cai et al. (2014) Y. Cai, J. Lan, G. Zhang, and Y.-W. Zhang, Phys. Rev. B 89, 035438 (2014).
- Molina-Sánchez and Wirtz (2011) A. Molina-Sánchez and L. Wirtz, Phys. Rev. B 84, 155413 (2011).