Line-driven disk wind model for ultra-fast outflows in active galactic nuclei – Scaling with luminosity
Abstract
In order to reveal the origin of the ultra-fast outflows (UFOs) that are frequently observed in active galactic nuclei (AGNs), we perform two-dimensional radiation hydrodynamics simulations of the line-driven disk winds, which are accelerated by the radiation force due to the spectral lines. The line-driven winds are successfully launched for the range of and –, and the resulting mass outflow rate (), momentum flux (), and kinetic luminosity () are in the region containing 90% of the posterior probability distribution in the - plane, - plane, and - plane shown in Gofford et al., where is the black hole mass, is the Eddington ratio, and is the bolometric luminosity. The best-fitting relations in Gofford et al., , , and , are roughly consistent with our results, , , and . In addition, our model predicts that no UFO features are detected for the AGNs with , since the winds do not appear. Also, only AGNs with exhibit the UFOs when . These predictions nicely agree with the X-ray observations (Gofford et al.). These results support that the line-driven disk wind is the origin of the UFOs.
keywords:
accretion, accretion disks – galaxies: active – methods: numerical1 Introduction
Blueshifted absorption lines of highly ionized iron (FeXXV and/or FeXXVI) are observed in some active galactic nuclei (AGNs). The large blueshift of the iron lines indicates the outflows blown away toward an observer with velocity of –, where is the speed of light. Such high-velocity outflows, which are so-called ultra-fast outflows (UFOs), are detected in of Seyfert galaxies, although the number of samples is not so large (Tombesi et al., 2010, 2011; Gofford et al., 2013).
The UFOs are thought to be the disk winds, which are launched from the accretion disks around supermassive black holes, but the acceleration mechanism is still unknown. One plausible model is the line-driven wind model (Proga et al., 2000; Proga & Kallman, 2004; Risaliti & Elvis, 2010; Nomura et al., 2013), in which the acceleration mechanism is radiation force due to spectral lines (the absorbing the ultraviolet radiation through the bound-bound transition of metals). In this model, the line force becomes 10–1000 times larger than the radiation force due to Thomson scattering near the disk surface where the ionization state is low (Stevens & Kallman, 1990), leading to the launch of the high-velocity disk winds. At the region far from the disk surface, since the wind matter is highly ionized by the X-ray irradiation from the disk corona, the blueshifted absorption lines of highly ionized iron lines are produced. The magnetically driven wind model (e.g, Blandford & Payne, 1982; Konigl & Kartje, 1994; Everett & Murray, 2007; Fukumura et al., 2015), which is another theoretical model, can explain the large velocity of the outflowing matter, but this model requires an extra mechanism to adjust the ionization state of the wind matter to explain the absorption lines.
Radiation hydrodynamics simulations of the line-driven wind in AGNs have been developed by Proga et al. (2000) and Proga & Kallman (2004). They clearly show that the line force accelerates the matter and the funnel-shaped disk wind appears for the typical parameters, and , where and are the black hole mass and Eddington ratio of the disk luminosity respectively. In their simulations, the matter is launched from the disk surface and is accelerated toward the direction of , where is the polar angle measured from the rotational axis of the accretion disk. Based on their results, Schurch et al. (2009) and Sim et al. (2010) performed the spectral synthesis and revealed that the blueshifted absorption lines appear on the spectra transmitted through the line-driven disk winds.
In addition, in our previous work (Nomura et al., 2016, hereafter N16), we also performed the radiation hydrodynamics simulations of line-driven disk winds in a wide parameter space and explained the observational features of the UFOs. For and –, funnel-shaped disk winds appear, and dense matter is accelerated outward with an outflow velocity of and with an opening angle of –. The outward velocity, the column density, and the ionization state of the winds are consistent with those inferred from the X-ray observation of the UFOs. The UFOs could be statistically observed in about 13–28% of the luminous AGNs (), which is roughly comparable to the observed ratio ().
Recently, Gofford et al. (2015) (hereafter G15) surveyed the wind properties for 20 samples of UFOs in detail. They found that the mass outflow rate (), momentum flux (), and kinetic luminosity () are scaling with AGN bolometric luminosity () as , , and . The line-driven disk wind model should explain this scaling relation if this wind is the origin of the UFOs. However, the above scaling of the line-driven disk wind has not been investigated yet.
In this paper, by performing two-dimensional radiation hydrodynamics simulations of the line-driven disk winds, we research the dependence of the mass outflow rate, momentum flux, and kinetic luminosity on the disk luminosity (that corresponds to the bolometric luminosity). In Section 2, we explain the calculation method, which is basically the same as N16 except for the slight modification. Our results are shown in Section 3. We devote Section 4 to discussions and we present conclusions in Section 5.
2 Methods
In this section, we briefly describe our method, which is basically the same as that of N16, and mention changes from the previous simulations. We apply the spherical polar coordinate , where is the distance from the origin of the coordinate, is the polar angle, and is the azimuthal angle. We perform the two-dimensional simulations assuming the axial symmetry for the rotation axis of the accretion disk. We calculate the basic equations of the hydrodynamics, the equation of continuity,
| (1) |
the equations of motion,
| (2) |
| (3) |
| (4) |
and the energy equation,
| (5) |
where is the mass density, is the velocity, is the gas pressure, is the internal energy per unit mass, and is the gravitational acceleration of the black hole. The -component of the gravitational force is not null because the center of the coordinate and the plane are located at a distance of above the black hole and the mid-plane of the accretion disk. We assume an adiabatic equation of state with . In the last term of the equation (5), is the net cooling rate. Here we consider Compton heating/cooling, X-ray photoionization heating, recombination cooling, bremsstrahlung cooling, and line cooling (see N16).
In equations (2) and (3), the last term, , is the radiation force per unit mass including the line force, which is calculated as
| (6) |
where is the mass-scattering coefficient for free electrons, D is the radiation flux via the disk emission, and is the force multiplier proposed by Stevens & Kallman (1990). In addition, line is the radiation flux of the disk emission in a band of –, which largely contributes to the line force through the bound-bound transitions (line-driving flux, see Proga & Kallman, 2004). In N16, we roughly assume that the radiation from the high-temperature region of the disk, in which the effective temperature is larger than , contributes to the line force (see also Proga et al., 2000). The line force would be estimated more precisely by the present method.
We also modify the evaluation method of the velocity gradient when we estimate the force multiplier, . The force multiplier defined by Stevens & Kallman (1990) is the function of the ionization parameter,
| (7) |
and the local optical depth parameter,
| (8) |
where is the X-ray flux from the disk corona near the black hole, is the number density, is the thermal speed of hydrogen gas whose temperature is (), and is the velocity gradient along the light-ray. In this paper, we evaluate by the velocity gradient along the direction of the line-driving flux (), although we substituted for in N16. The present method would be better than the previous method, since the light-ray along the direction of the line-driving flux effectively contributes the line force. For instance, around the wind base, the matter is accelerated almost perpendicularly to the disk plane via the -component of the radiation force. Then, the present method () is more suitable than the previous method (). In the same way as for N16, the X-ray source is treated as a point source located at the origin. Also, the X-ray flux, the disk flux, and the line-driving flux are attenuated in the same manner as N16.
The size of the computational domain and the grid spacing are the same as those of N16. However, the distance from the equatorial plane to the plane, , is slightly modified. We set to be , which is the scale height of the standard disk model at (Shakura & Sunyaev, 1973), although was employed in N16.
The initial and boundary conditions are the same as those of N16, except for the density distribution at plane, . For , we employ the density at the surface of the standard accretion disk,
| (9) |
where is the vertically averaged density of the standard disk model (Shakura & Sunyaev, 1973; Kato et al., 2008) and is the energy conversion rate that is set to be , although we assumed to be constant in N16. Although we employ the above modifications, the wind structure does not change so much. The density of the wind slightly increases and the opening angle slightly decreases (see Section 3.1 for details).
3 Results
3.1 Overview of the wind structure
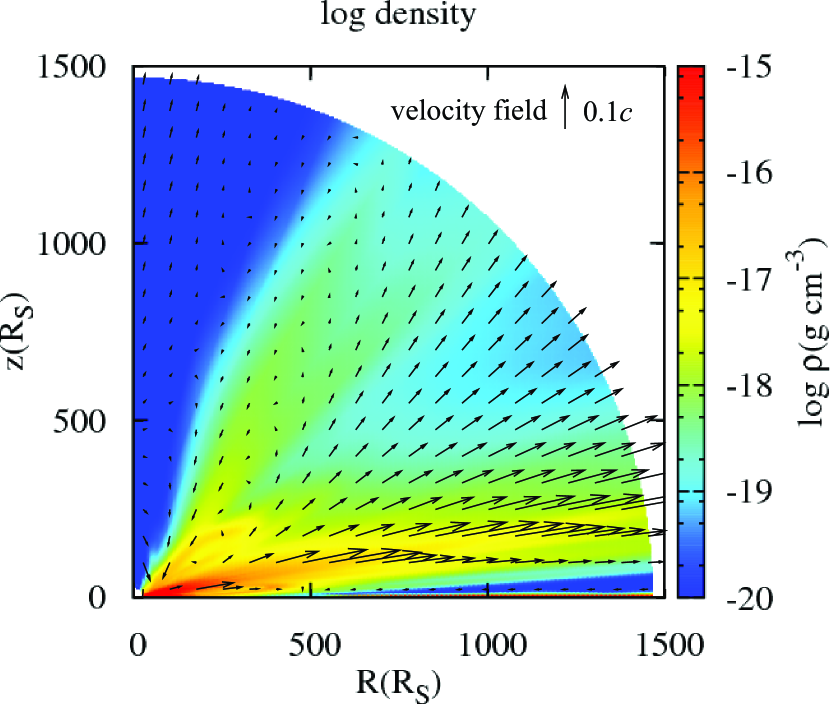
Here, we show the results of a model with and . We call this model a “fiducial model” because a large sample of UFOs is detected in AGNs with in G15. Fig. 1 shows the time-averaged wind structure for the fiducial model in the - plane. Here, -axis is the rotation axis of the accretion disk and is the distance from the rotation axis. The color contour shows the density map and arrows show the velocity vectors. The matter is launched from the accretion disk surface near the black hole (–) almost vertically. After the launching, the direction of acceleration bends in the -direction and the outflowing matter makes the funnel-shaped disk wind with an opening angle of –. These results are consistent with N16.
Here we note that the disk wind is slightly denser and faster than that of N16. The maximum velocity is 1.5–2.0 times larger and the density is 10–30 times larger than those of previous results. Such changes are mainly caused by the modification of the treatment of the velocity gradient (see Section 2). In the launching region, the matter is vertically accelerated by the -component (-component) of the radiation force. Therefore, the velocity gradient along the direction of the radiation flux is larger than that along the radial direction. Since the line force (force multiplier) increases as an increase in the velocity gradient, the velocity as well as the density of the wind increases in the present simulations.
In Fig. 2, the mass outflow rate (, top panel), momentum flux (, middle panel), and kinetic luminosity (, bottom panel) are plotted as a function of . Here they are evaluated as
| (10) |
| (11) |
and
| (12) |
at the distance . In order to avoid the influence of the boundary condition at , we set the range for the integration to be –. The high-density and high-velocity part of the wind, – (see Fig. 1), is responsible for , , and .
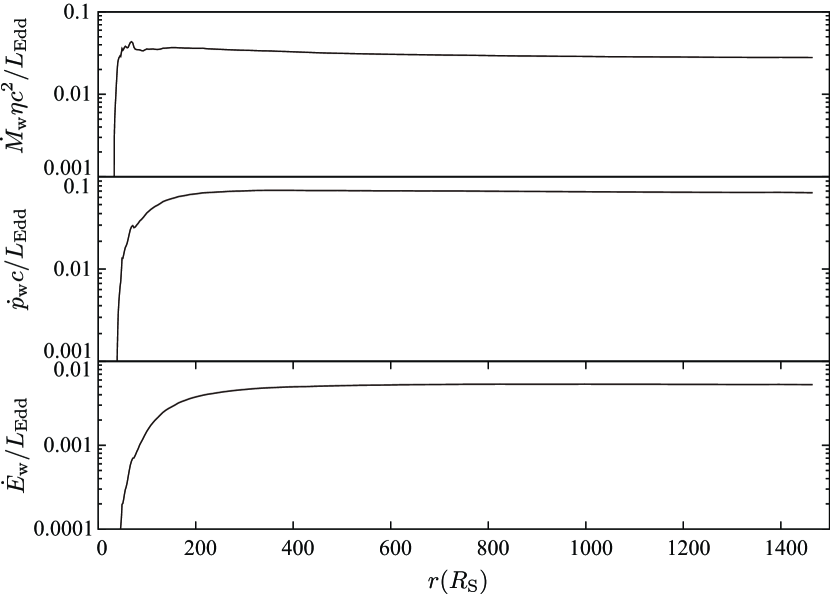
We find that all the profiles are steep in the region of and nearly constant in the region of , since the wind is efficiently accelerated within and since the acceleration of the wind is almost terminated at . Hereafter, we use the values at the outer boundary () as the mass outflow rate, momentum flux, and the kinetic luminosity of the disk wind. Fig. 2 indicates , , and in the fiducial model. We find that the mass outflow rate is of the mass accretion rate, , where is the Eddington luminosity. The kinetic luminosity is of the disk luminosity ().
3.2 Scaling with luminosity
Fig. 3 shows the mass outflow rate (top panel), momentum flux (middle panel), and kinetic luminosity (bottom panel) as a function of the disk luminosity. In each panel, the lines for fixed Eddington ratios, , 0.3, and 0.5, are shown by red solid lines. The lines for fixed black hole masses, , , , and , are shown by red dashed lines. Here, we note that the range of and employed in the present work ( and –) is roughly consistent with that of the sample of G15. The black dotted lines are functions of (top), (middle), and (bottom). The upper and lower boundary curves of the blue shaded area are the envelopes of the lines, and with being distributed in the range of (top panel), and with being distributed in the range of (middle panel), and and where (bottom panel). Using the black dotted lines and shaded areas, we can trace the best-fitting regression line and the region containing 90% of the posterior probability distribution, which are shown by the black lines and by the grey shaded area in Fig. 3 of G15. Here, we assume that the luminosity of the accretion disk corresponds to the bolometric luminosity of the AGN. In each panel, we find that our results nicely fit the shaded region, although only the case of and is slightly protruded. Also, our results are almost overlapped with the best-fitting lines. This implies that the line-driven wind model can explain the observations of UFOs.
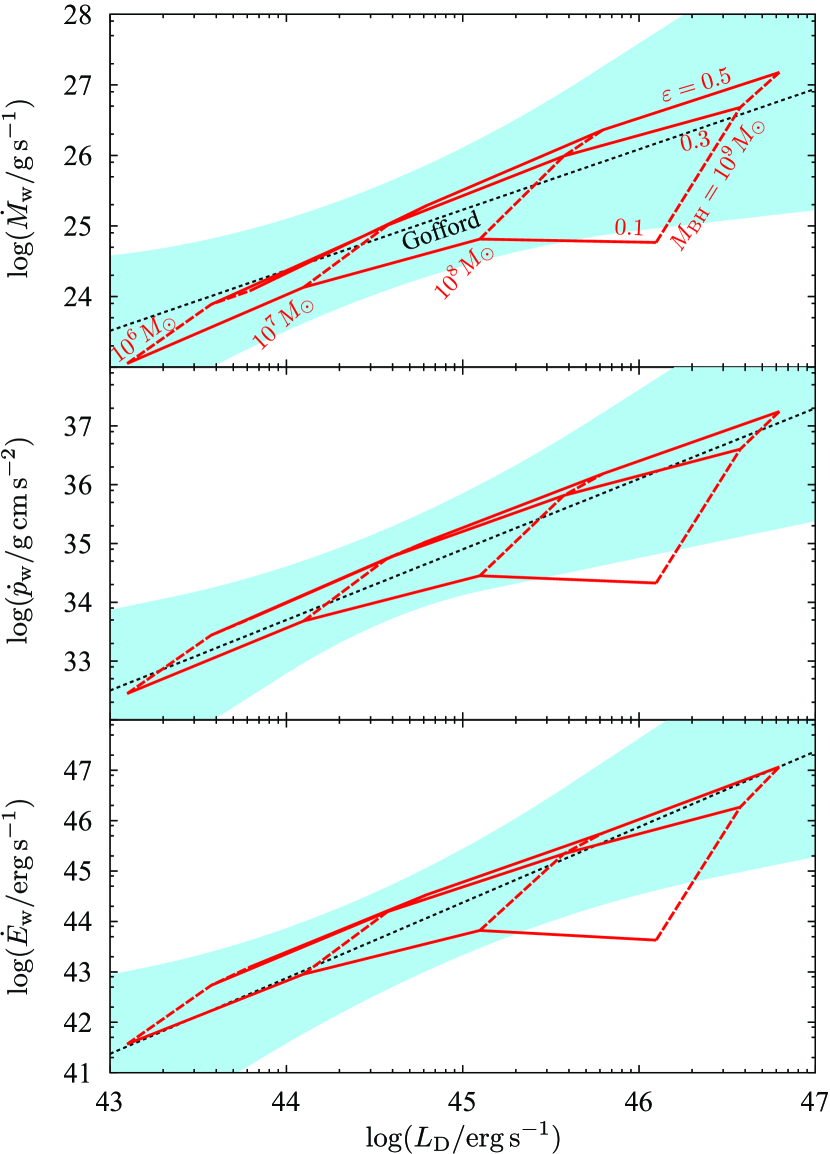
As shown in Fig. 3, the gradient of lines for fixed Eddington ratio ( and ) is very close to that of best-fitting line, while the red dashed lines are steeper than the black dotted lines. This means that the agreement between our model and the observations by G15 is mainly caused by the -dependency of , , and . Note that the gradient of the line of is mostly the same as that of and (), but much flatter when . We will discuss that (see below).
If we plot the results of and , the area in which our results are distributed slightly expands downward. The results for almost overlap with the red solid line of . When , the results of , , and for are comparable to or slightly smaller than the lower boundary of the blue shaded area, and the disk wind does not appear for . However, the scaling relation does not change so much. In addition, the sample of G15 is clustered at . Thus, we stress again that our model can nicely reproduce the observed scaling relation of , , and with the luminosity.
3.3 Reason for scaling
As we have mentioned above, the scaling relation with the bolometric luminosity is principally responsible for the black hole mass dependence. Thus, in this subsection, we discuss the black hole mass dependence of , , and .
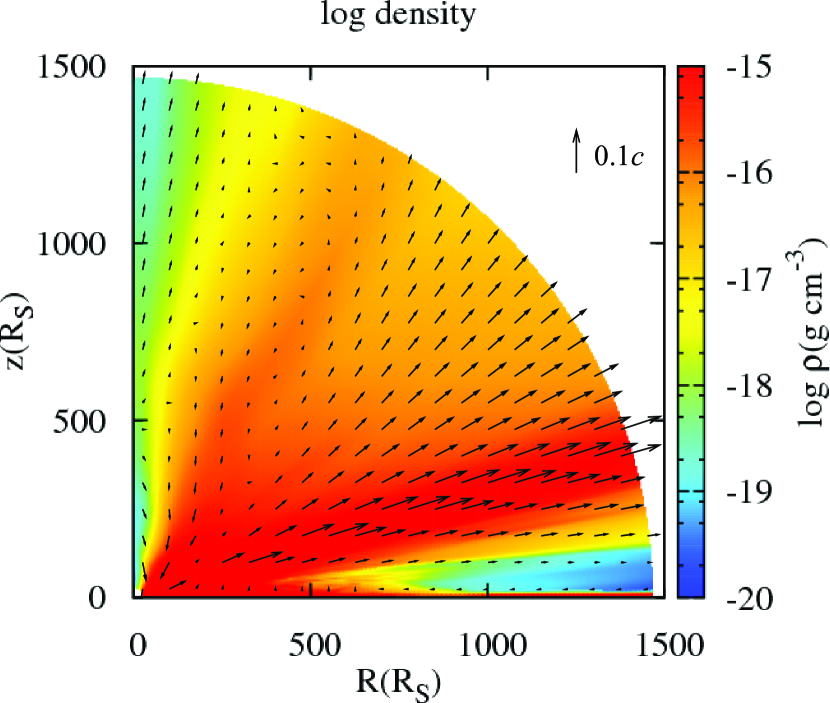
Fig. 4 is the same as Fig. 1 but for . Compared to the wind for , the density of the wind is large by two orders of magnitude and the outward velocity is slightly small. In addition, the opening angle of the wind is slightly smaller for than for .
Such differences are explicitly shown in Fig. 5, in which we plot the angular profiles of the density (top panel) and the radial velocity (bottom panel) at the outer boundary for (black solid lines), (red dashed lines), (blue dotted lines), and (green dashed-dotted lines). Here, the Eddington ratio is . This figure shows that the density and the radial velocity have peaks at for , for , for , and for .
The top panel of Fig. 5 shows that the density drastically decreases with the increase of the black hole mass. The peak density is for , for , for , and for . We find that the peak density is roughly proportional to . In the bottom panel of Fig. 5, we find that the peak velocity slightly increases with an increase in the black hole mass as in the range of . However, the case of is an exception. The peak velocity for is smaller than that for .
The inverse proportional relation between the density and the black hole mass is understood as follows: When the black hole mass changes while maintaining the Eddington ratio constant, the force multiplier in the launching region (–) is kept almost constant. This is because the gravity () and the radiation flux () have the same -dependency (). At the launching region, where the X-ray is effectively obscured (), the force multiplier is approximately a function of the local optical depth parameter, , although the force multiplier depends on and for . The distance is proportional to and the velocity is roughly evaluated by the escape velocity at the launching region (), so that the relation of is derived from constant.
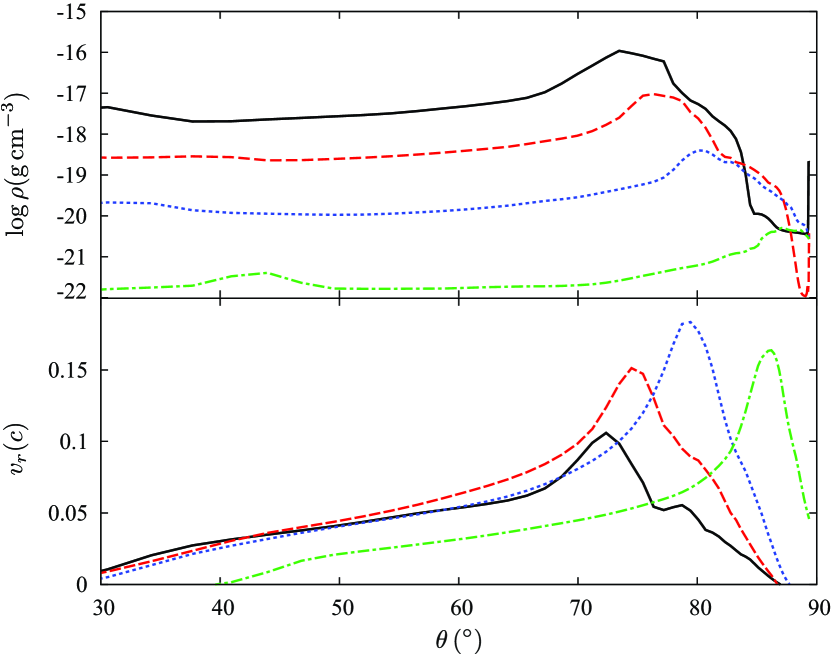
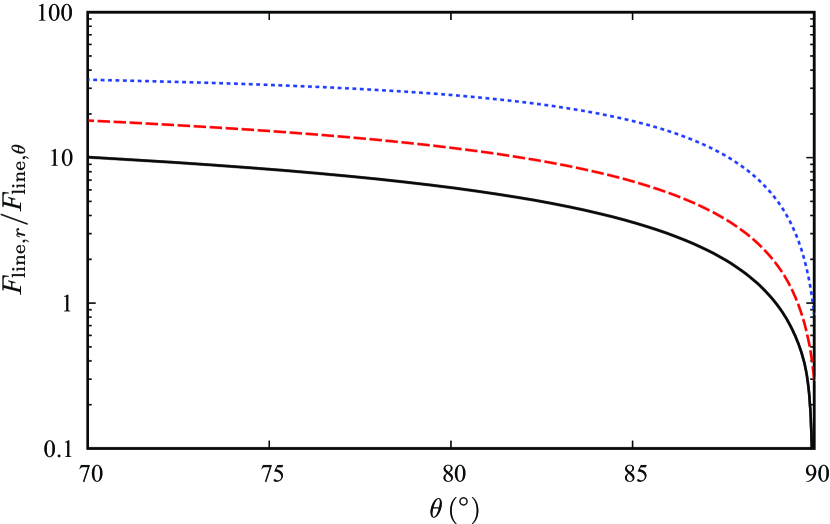
Next, we discuss the relation between the radial velocity and the black hole mass. Fig. 6 shows the angular distribution of for (black solid line), (red dashed line), and (blue dotted line) at , where the line-driving flux effectively contributes to the wind acceleration. We find that becomes large with the increase in the black hole mass. Since the effective temperature of the disk is proportional to , the emission region of the line-driving radiation (–) tends to concentrate near the black hole, as the black hole mass increases. As a result, for the large black hole mass, the acceleration in the -direction is more efficient than that in the -direction and the radial velocity slightly increases as . Also, such an enhanced causes the wind with a large opening angle (see the bottom panel in Fig. 5).
In the top panel of Fig. 5, we find that the peak density for and is smaller than expected from the relation of . This can be understood from the reduction in the effective temperature of the accretion disk. The effective temperature is proportional to , so that the line-driving luminosity decreases if the black hole mass is too large or the Eddington ratio is too small. Thus, the line force for and is too small to produce the powerful disk winds. As a result, the density for becomes one tenth or less in comparison with the case of . Here we note that, even , such a reduction of the wind density is not remarkable in the case of or , since the disk temperature is not significantly low. The bottom panel in Fig. 5 indicates that, in the case of , the radial velocity is smaller for than for . This is also caused by the reduction in the line force due to the decrease in the disk temperature. Hence, the mass outflow rate, the momentum flux, and the kinetic luminosity become small in the case of and (see Fig. 3).
From the resulting relations of and , the -dependence of , , and for given Eddington ratio roughly becomes , , and . They are not inconsistent with the observed scaling of , , and . This is why our model can explain the scaling relations of the UFOs.
4 Discussion
4.1 Comparison with observations
We successfully show that the line-driven disk wind explains the scaling relation of the mass outflow rate, momentum flux, and the kinetic luminosity with the AGN luminosity, which was discovered by G15. However, in Fig. 3, the result for and is located bellow the lower boundary of the blue shaded area. This is induced by the reduction of the disk temperature due to the large black hole mass and small Eddington ratio, as we have mentioned above. Such a discrepancy might disappear if the wind is launched from the region of , since the line-driving radiation, which is mainly emitted near the black hole, enhances the wind power. In the present simulations, we set the inner radius of the computational domain to be based on the assumption that the matter is fully ionized near the black hole (). However, the size of the ionization region is still unknown. If the ionized region shrinks for the case of and , , , and would increase and overlap with the blue shaded area.
In our model, it is difficult for the line-driven mechanism to accelerate the disk wind for small Eddington ratio, implying that the UFOs are not observed in the AGNs with the small Eddington ratio. This result is consistent with the observations of G15. In our simulations, the line-driven wind does not appear for . In G15, the large sample of UFOs is detected in AGNs with , and the UFOs are not detected in the AGN with . Although the Eddington ratio of NGC3227 is estimated to be , this sample is excluded when the scaling relation with the bolometric luminosity is discussed, since the outflow velocity () is much smaller than that of the typical UFOs () and it is unclear whether the absorber is the part of the disk wind. Also, UFOs are detected in the four AGNs with , which is the smallest Eddington ratio in the UFO sample of G15, and their black hole masses are distributed in . This is also consistent with our results, whereby the wind is launched only for the case of when .
Although our model can roughly reproduce the scaling relation of G15, the resulting dependence of the outflow velocity, , is different from that of G15, . Such a discrepancy might be caused by the difference of the measuring method. The wind velocity of the UFOs is estimated from the blueshifted absorption lines. On the other hand, in our simulations, the radial velocity of the main stream of the wind (peak velocity in the bottom panel of Fig. 5) is recognized as the wind velocity. However, the absorption lines via the main stream are not always observed. If the high-velocity part of the wind is highly ionized, the intrinsic outflow velocity of the wind cannot be observed. In addition, the observed wind velocity would depend on the observer’s viewing angle. As shown in Fig. 5, the wind velocity is sensitive to the angle. This problem should be solved by the calculation of the emergent spectra (see below).
Finally, the wide dispersion in the plot of -dependence of , , and (blue shaded area in Fig. 3) might originate from the Eddington ratio, the observer’s viewing angle, and the ionization degree of the wind matter. As we have already mentioned, the lines for fixed black hole mass (red dashed lines in Fig. 3) are not in parallel with respect to the best-fitting lines. Thus, the difference of the Eddington ratio works to make a scatter in the plot. In addition, the density as well as the velocity is sensitive to the polar angle as we have mentioned above, so that the estimated , , and are expected to depend on the observer’s viewing angle. If the X-ray luminosity varies, the ionization degree of the wind matter would vary. If this is the case, the observed absorption features change, leading the scatter in the plot. The calculation of the emergent spectra should make the point clear.
4.2 Radiation drag
In our simulations, the basic equations are non-relativistic and the radiation drag force, which is on the order of , is not taken into consideration. However, the agreement between our model and the observations does not change by the radiation drag. In order to make sure of that, we perform a simulation in which the radiation force is artificially reduced by 40%, since we find based on the numerical data of fiducial parameters that the maximum value of the radiation drag term is around 40% of the radiation flux force (the radiation force shown by the equation 6) at the region of the velocity with . Here we note that such a treatment overestimates the effect of the radiation drag. This is because the radiation drag force would be very inefficient in the launching region where the velocity of the wind is small, .
As a result of the case of the fiducial parameter set, we find that the velocity is not very different from the original value. The radial velocity of the main stream at the outer boundary is , which is almost the same as the original result (see the peak velocity in the bottom panel of Fig. 5). The peak density at the outer boundary slightly deceases from the original value of to . As a consequence, the mass outflow rate, momentum flux, and kinetic luminosity become , , and , which are slightly smaller than the original value, , , and . Here, the deviation would be smaller in reality, since the radiation drag is overestimated in this test calculation. Thus, we conclude that our results do not change so much even if the radiation drag is included in the simulations.
Although we simply investigate the effect of the radiation drag using the above method, the multi-color radiation hydrodynamics simulations would be necessary for the exact calculations. This is because the radiation drag via the line absorption would be sensitive to the spectral shape of the radiation as well as the Doppler shift.
4.3 Future works
The mass outflow rate estimated by our simulations is comparable to or slightly larger than the mass accretion rate for large Eddington ratio ( and 0.5). The mass ejection from the accretion disk reduces the mass accretion onto the black hole, and affects the disk luminosity as well as the effective temperature of the disk. Then, the wind structure might change. However, the impact on the disk due to the launching of the wind is not considered in our simulations. We treat the emission and the density at the disk surface as not changing with time. Our method might overestimate the mass outflow rate of the wind. In order to research the wind more realistically, it is important to perform the radiation hydrodynamics simulations in which the disk and wind are self-consistently solved. The numerical simulations of the near-Eddington disks and outflows are performed by Ohsuga (2006); Ohsuga et al. (2009); Ohsuga & Mineshige (2011), but the line force is not included. The simulations taking into account the line force are remain future work.
In this paper, we calculate the mass accretion rate, momentum flux, and kinetic luminosity, and show that their scaling relations with disk luminosity are consistent with the results by G15. However, for more precise verification of the model, it is necessary to investigate the absorption lines of FeXXV and/or FeXXVI based on our simulation data. The spectral synthesis based on the results of simulations is important future work. The synthetic spectra calculated based on the results of Proga & Kallman (2004) have been reported by Schurch et al. (2009); Sim et al. (2010); Higginbottom et al. (2014).
Recently, the time variation of the absorption lines is detected (e.g., Misawa et al., 2007; Capellupo et al., 2013; Tombesi et al., 2012b). This implies that the wind structure changes in time and/or the wind has a non-axisymmetrical structure. Although the density fluctuations of line-driven wind in one- or two-dimensional calculations have been reported by Owocki & Puls (1999); Proga et al. (2000), the non-axisymmetrical structure has not been investigated yet. To reveal the origin of the time variability of the absorption lines, we should perform time-dependent three-dimensional simulations.
5 Conclusions
We performed two-dimensional radiation hydrodynamics simulations of line-driven disk winds in AGNs. The resulting scaling relations of the mass outflow rate (), momentum flux (), and kinetic luminosity () with the disk luminosity are consistent with those obtained by X-ray observations (G15).
We found , , and for the range of and – with and being the black hole mass and the Eddington ratio. Since the Eddington ratio is limited within the narrow range of – for launching the winds, the above -dependence can be replaced with the scaling relation with the bolometric luminosity ( , , and ). They are roughly consistent with the scaling relations obtained by the X-ray observations, , , and . At least, since there is large scatter in the UFO sample, our results are in the region containing 90% of the posterior probability distribution in the - plane, - plane, and - plane (G15).
Our simulations also revealed that the line-driven winds do not appear for the AGNs with small Eddington ratio, . In addition, in the case of , the black hole mass is limited to be for launching the winds. These results are also consistent with G15. Indeed, in G15, the smallest Eddington ratio in the UFO sample is , and their black hole masses are . There are no AGNs with exhibiting UFO features in the sample of G15. In their sample, although NGC3227 has very small Eddington ratio (), the outflow velocity of this object is very small, , which is far from the UFOs.
The number of UFO samples is still small, but the line-driven disk winds successfully explain the scaling relations of the mass outflow rate, momentum flux, and the kinetic luminosity with AGN luminosity. We conclude that the line-driven disk wind is a plausible model for UFOs in AGNs.
Acknowledgements
We would like to thank Hiroyuki R. Takahashi for useful discussions. Numerical computations were carried out on Cray XC30 at the Center for Computational Astrophysics, National Astronomical Observatory of Japan. This work is supported in part by JSPS Grant-in-Aid for Scientific Research (C) (15K05036 K.O., 16K05309 K.E.). This work was supported in part by MEXT and JICFuS as a priority issue (Elucidation of the fundamental laws and evolution of the universe) to be tackled by using Post K Computer.
References
- Blandford & Payne (1982) Blandford, R. D., & Payne, D. G. 1982, MNRAS, 199, 883
- Capellupo et al. (2013) Capellupo, D. M., Hamann, F., Shields, J. C., Halpern, J. P., & Barlow, T. A. 2013, MNRAS, 429, 1872
- Everett & Murray (2007) Everett, J. E., & Murray, N. 2007, ApJ, 656, 93
- Fukumura et al. (2015) Fukumura, K., Tombesi, F., Kazanas, D., et al. 2015, ApJ, 805, 17
- Gofford et al. (2013) Gofford, J., Reeves, J. N., Tombesi, F., et al. 2013, MNRAS, 430, 60
- Gofford et al. (2015) Gofford, J., Reeves, J. N., McLaughlin, D. E., et al. 2015, MNRAS, 451, 4169
- Higginbottom et al. (2014) Higginbottom, N., Proga, D., Knigge, C., et al. 2014, ApJ, 789, 19
- Kato et al. (2008) Kato, S., Fukue, J., & Mineshige, S. 2008, Black-Hole Accretion Disks — Towards a New Paradigm —, 549 pages, including 12 Chapters, 9 Appendices, ISBN 978-4-87698-740-5, Kyoto University Press (Kyoto, Japan), 2008.,
- Konigl & Kartje (1994) Konigl, A., & Kartje, J. F. 1994, ApJ, 434, 446
- Misawa et al. (2007) Misawa, T., Eracleous, M., Charlton, J. C., & Kashikawa, N. 2007, ApJ, 660, 152
- Nomura et al. (2013) Nomura, M., Ohsuga, K., Wada, K., Susa, H., & Misawa, T. 2013, PASJ, 65, 40
- Nomura et al. (2016) Nomura, M., Ohsuga, K., Takahashi, H. R., Wada, K., & Yoshida, T. 2016, PASJ, 68, 16
- Ohsuga (2006) Ohsuga, K. 2006, ApJ, 640, 923
- Ohsuga et al. (2009) Ohsuga, K., Mineshige, S., Mori, M., & Kato, Y. 2009, PASJ, 61, L7
- Ohsuga & Mineshige (2011) Ohsuga, K., & Mineshige, S. 2011, ApJ, 736, 2
- Owocki & Puls (1999) Owocki, S. P., & Puls, J. 1999, ApJ, 510, 355
- Proga et al. (2000) Proga, D., Stone, J. M., & Kallman, T. R. 2000, ApJ, 543, 686
- Proga & Kallman (2004) Proga, D., & Kallman, T. R. 2004, ApJ, 616, 688
- Risaliti & Elvis (2010) Risaliti, G., & Elvis, M. 2010, A&A, 516, 89
- Shakura & Sunyaev (1973) Shakura, N. I., & Sunyaev, R. A. 1973, A&A, 24, 337
- Schurch et al. (2009) Schurch, N. J., Done, C., & Proga, D. 2009, ApJ, 694, 1
- Sim et al. (2010) Sim, S. A., Proga, D., Miller, L., Long, K. S., & Turner, T. J. 2010, MNRAS, 408, 1396
- Stevens & Kallman (1990) Stevens,I. R., & Kallman, T. R. 1990, ApJ, 436, 599
- Tombesi et al. (2010) Tombesi, F., Cappi, M., Reeves, J. N., et al. 2010, A&A, 521, A57
- Tombesi et al. (2011) Tombesi, F., Cappi, M., Reeves, J. N., et al. 2011, ApJ, 742, 44
- Tombesi et al. (2012b) Tombesi, F., Sambruna, R. M., Marscher, A. P., et al. 2012b, MNRAS, 424, 754