Very Long-period Pulsations before the Onset of Solar Flares
Abstract
Solar flares are the most powerful explosions occurring in the solar system, which may lead to disastrous space weather events and impact various aspects of our Earth. So far, it is still a big challenge in modern astrophysics to understand the origin of solar flares and predict their onset. Based on the analysis of soft X-ray emission observed by the Geostationary Operational Environmental Satellite (GOES), this work reported a new discovery of very long-periodic pulsations occurred in the preflare phase before the onset of solar flares (preflare-VLPs). These pulsations are typically with period of 8 - 30 min and last for about 1 - 2 hours. They are possibly generated from LRC oscillations of plasma loops where electric current dominates the physical process during magnetic energy accumulation in the source region. The preflare-VLP provides an essential information for understanding the triggering mechanism and origin of solar flares, and may help us to response to solar explosions and the corresponding disastrous space weather events as a convenient precursory indicator.
Online-only material: color figures
1 Introduction
Solar flare is a sudden, rapid, and violent magnetic-energy release and brightness enhancement in broad spectrum of emissions observed in the solar atmosphere near sunspots (Shibata and Magara 2011). Generally, solar flares are classified into A-, B-, C-, M-, and X-class according to their maximum flux at soft X-ray (SXR) wavelength of 1.0 - 8.0 Å measured by the standard Geostationary Operational Environmental Satellite (GOES, a satellite series initially deployed in 1974, GOES-14 and GOES-15 are inline during the present solar cycle 24) (Tandberg-Hanssen & Emslie 1988). A typical X-class flare may release magnetic-energy of more than J into the interplanetary space and impact greatly upon various aspects of our Earth (Nonweiler 1958, Scafetta and West 2003, Pick and Vilmer 2008, Gonzalez et al. 2014). Although there is a general agreement on the flares’ causes of magnetic-reconnection in solar atmosphere, there are still many big unclear problems: What is the trigger of magnetic-reconnection in the source region? How does the enormous magnetic-energy transform into kinetic energy carried by particles and plasmas? In particular, how do we predict a powerful solar flare and the related disastrous space weather event? Naturally, it is very important and convenient to find out the easily-obtained and confirmatory precursors of solar flares. So far, many clues are reported from multi-wavelength observations in preflare phases, including radio spectral fine structures (Zhang et al. 2015), filament activities (Chifor et al. 2006), weak SXR bursts (Tappin 1991), magnetic helicity accumulations (Zhang, Tan, & Yan, 2008), etc. However, some of them are very weak with remarkable uncertainties, and some of them are very complicated and difficult to recognize from the huge ocean of observation data (Martin 1980, Bloomfield et al. 2012).
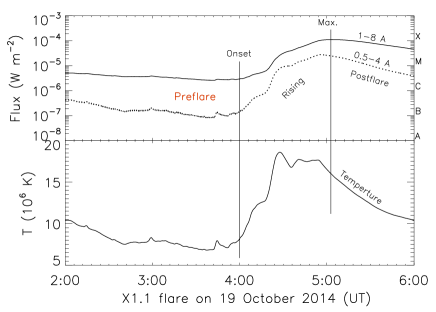
Generally, a solar flare can be partitioned into three phases according to its GOES SXR flux light curve at wavelength of 1.0 - 8.0 Å : preflare (before the flare onset), rising (from the flare onset to its maximum, the time interval is named rising-time of the flare) and postflare (after the flare maximum). A typical flare event and its phase partition is shown in Figure 1.
Because the GOES program consists of a series of geostationary satellites which overlap in time so that there are always one to three spacecrafts working in orbit, and this guarantees an essentially uniterrupted time series of recorded solar SXR fluxes (Thomas, Starr, and Crannell 1985, Garcia 1994, White, Thomas, and Schwarts 2005). In this work, we mainly investigated the GOES SXR observation data during preflare phase, and found that there were very long-period pulsations (VLPs) with typical period of 8 - 30 min and typical duration of about 1 - 2 hours occurring just before the onset of solar flares. We named this phenomenon as preflare-VLP. As we know that VLPs with similar timescales are frequently reported during flare processes or even non-flaring sun (Harrison 1987, Svestka 1994, Wang 2011, Tan et al. 2010, Yuan et al. 2011, etc.). However, the preflare-VLPs reported in this work are the first time observed just in the preflare phase of solar flares, and may be meaningful to reply the questions mentioned in the above paragraphs.
This paper is organized as following. Section 2 introduces the main properties of preflare-VLPs in several typical flare events and section 3 presents the statistic characteristics of solar flares in the solar cycle 24. The physical mechanism and the related theoretical discussions are presented in section 4, and finally, some conclusions are summarized in section 5.
2 Several Typical Flare Events Accompanying with Preflare-VLPs
In order to eliminate the influence of other flares, this work focused on analyzing the isolated flares in the solar cycle 24 observed by GOES at SXR wavelengths of 1.0 - 8.0 Å and 0.5 - 4.0 Å with cadence of 2 seconds, which in principle probe the dynamical process of energy release in flaring active regions (Tandberg-Hanssen & Emslie 1988, Georgoulis, Vilmer, and Crosby 2001). Here, an isolated solar flare is defined as that there is no same or higher class of flare event occurring in 2 hours before the flare onset, and no saturation or bad recorded data to disturb the analyzing results.
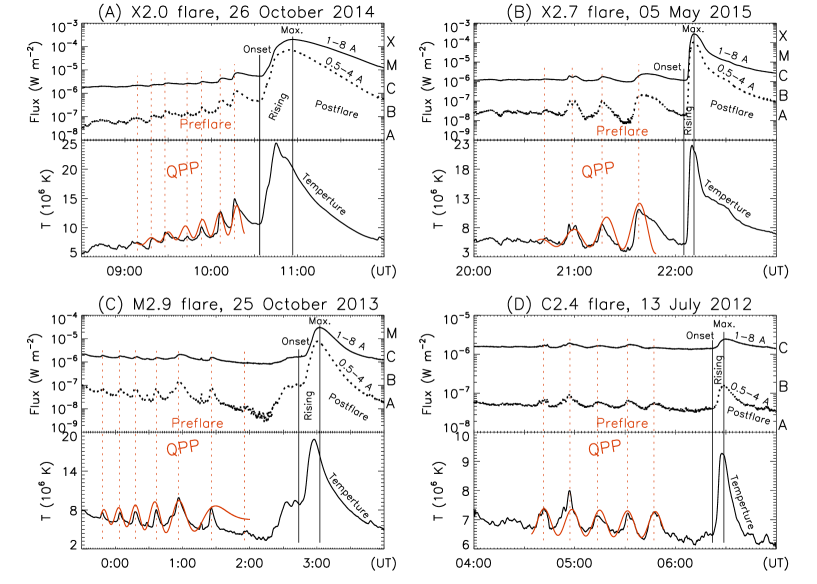
Figure 2 presents SXR light curves at 1.0 - 8.0 Å and 0.5 - 4.0 Å , and the related temperatures in 4 typical flare events. The temperature is derived from the ratio of SXR intensities at the above two wavelength bands (Thomas, Starr, and Crannell 1985, White, Thomas, and Schwarts 2005). All background emission is subtracted from SXR flux intensity. By a simple view, we find that there are trains of pulses with approximately equal time-intervals occurred before the onset of the corresponding flare event. We call such train of pulses as preflare very long-period pulsation (preflare-VLP). Here, it is necessary to define a detected criterion of preflare-VLP: (1) occurred during 2 hours before the flare onset, (2) lasted for more than 30 minutes (duration, 30 min) and composed of at least 4 pulses, (3) the maximum amplitude of each pulse is higher than 2 ( is the standard derivation of the background temperature before the train of pulses), and (4) the time-interval between adjacent pulses is called period (), and the maximum period is shorter than 2 times of minimum period () and 1 min. When there is a pulsation satisfying the above criterions in 2 hours before the flare onset, we say the flare accompanying with preflare-VLP, and when there is no such pulsation we say the flare is without preflare-VLP.
2.1 X2.0 flare on 26 October 2014
Figure 2A shows the process of an X2.0 flare occurred on 26 October 2014. The flare took place in a super active region NOAA12192 located S14W37 closed to the center of solar disk. The flare started at 10:35 UT, reached to maximum at 10:56 UT, and the rising-time was about 21 min. During the two hours preflare phase before the flare onset, from 08:30 UT to 10:35 UT, there was no flare stronger than M-class. Therefore the X2.0 flare is an isolated flare event.
During the preflare phase of the X2.0 flare, there is a preflare-VLP which contains 7 pulses and lasts for about 80 minutes. The pulse period is in the range of 9.5 - 13.0 min, and the average period is about 11.4 min (684 s). It is very interesting that the pulse amplitudes are increased slowly from about 1.0 MK to 4.0 MK at the temperature profile. The preflare-VLP can be fitted by a cosine function from a least-square method,
| (1) |
Here, T is the temperature in unit of K (MK), t is time in unit of second and start from 08:30 UT. The constant 5.0 MK is the average temperature of the background before the preflare-VLP. The second term represents the slow changes of the background during the preflare-VLP. The function in the third term shows the changes of the amplitude of the pulsation. Here, the period of the pulsation is near a constant (684 s).
2.2 X2.7 flare on 05 May 2015
Figure 2B shows an X2.7 flare occurred on 05 May 2015 in active region NOAA12339 located N15E79, very close to the east limb of solar disk. The flare started at 22:05 UT, rapidly reached to its maximum at 22:10 UT, and the rising-time was only 5 min. During the preflare phase from 20:00 UT to 22:05 UT, there was also no flare stronger than M-class. Therefore this flare is an isolated flare event.
During the preflare phase, there is a preflare-VLP which contains 4 pulses and lasts for about 70 min. The pulse period is in range of 16.0 - 20.0 min, and the average period is about 18.4 min (1104 s). Similarly, the pulse amplitudes are increased from about 0.5 MK to 5.5 MK at the temperature profile. We can also apply a cosine function from a least-square method to fit the preflare-VLP,
| (2) |
Here, t starts from 20:00 UT. This fitted function is very similar to Equation (1), its average temperature of the background before the preflare-VLP is only about 3.5 MK.
2.3 M2.9 flare on 25 October 2013
Figure 2C shows an M2.9 flare occurred on 25 October 2013 in active region NOAA11882 at S07E76 closed to the east limb of solar disk. The flare started at 02:48 UT, peak at 03:02 UT, and the rising-time is about 14 minutes. It is also an isolated flare.
Before the flare onset, there is a preflare-VLP containing 7 pulses and lasting for about 130 min. The pulse period is increased from 15 min up to 30 min, and the average period is about 21.2 min. The pulse amplitude increased in the first half and then decreased slowly in the second half of the preflare-VLP. The preflare-VLP can be also fitted by a complex cosine function,
| (3) |
t starts from 23:30 UT on 24 October 2013. Here, the average temperature of the background before the preflare-VLP is 7.0 MK, and the change of the background temperature during the preflare-VLP is negative, opposite to Equation (1) and (2). At the same time, the period and amplitude of the pulsation have more complicated changes with time.
2.4 C2.4 flare on 13 July 2012
Figure 2D shows a small C2.4 flare occurred on 13 July 2012 in active region NOAA11515 at S19E10 near the center of solar disk. The flare started at 06:22 UT, maximum at 06:29 UT. The rising-time is about 7 min. It is still an isolated flare event.
During the preflare phase, a preflare-VLP is occurred with 5 pulses and lasted for about 75 min. The pulse period is in the range of 15.0 - 17.0 min with average of 16.4 min (984 s). We can also use a cosine function to fit the preflare-VLP,
| (4) |
t starts from 04:00 UT on 13 July 2012. Similar to Equation (3), here, the average temperature of the background before the preflare-VLP is about 7.0 MK, and the change of the background temperature during the preflare-VLP is negative. Both the amplitude and period are near constant.
Furthermore, Figure 2 also shows that the preflare-VLP at 1.0 - 8.0 Å is fully in-phase with that at wavelength of 0.5 - 4.0 Å as well as at the corresponding temperature profiles. The amplitude of temperature variations is in the range of 0.5 - 5.5 MK. This fact indicates that the temperature of flaring region also experiences quasi-periodic variations before the flare onset.
In the above descriptions, we just presented the results derived directly from counting the pulses of preflare-VLP. It is displayed very simple and straightforward. Actually, in order to check the results, we also applied two mathematic analytic methods of fast Fourier transformation (FFT) and wavelet transformation (WLT) to the time-series data of temperature, and found the results are agree with each other.
3 Statistic Analysis of the Preflare-VLP in Solar Cycle 24
In order to demonstrate the universality of the preflare-VLP, we made a statistic investigation of isolated solar flares. By using the detected criterion described in Section 2, we distinguished totally 412 isolated flares in the Solar Cycle 24 (from October 2010 till to July 2016), including 39 X-class, 183 M-class, and 190 C-class flares. We applied three different methods to distinguish the emission periodicity in the preflare phase of the above flare events: (1) directly counting the pulses, (2) fast Fourier transformation, and (3) wavelet transformation, and authenticate each other in a secure manner.
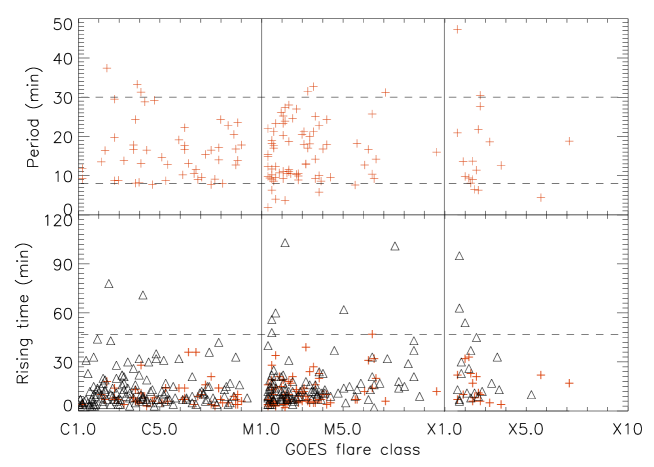
Among the 412 isolated flares, there are 144 flares ( 35%) having preflare-VLPs, including 18 X-class (46%), 76 M-class (42%), and 50 C-class (26%) flares. The other 268 flares have no obvious preflare-VLP. Table 1 presents the statistic results of the period and duration of preflare-VLP, and the rising-time of the isolated flares. Figure 3 presents their distributions with respect to the flare class.
| Type | parameter | X-class | M-class | C-class |
|---|---|---|---|---|
| with preflare-VLP | Number | 18(46%) | 76(42%) | 50(26%) |
| Period (min) | 4.4 - 47.3 (16.110.7) | 1.9 - 46.2 (16.27.9) | 7.7 - 33.3 (16.47.4) | |
| Duration (min) | 45 - 180 (85.633.7) | 17 - 200 (98.535.8) | 42 - 185 (97.433.2) | |
| Rising-time (min) | 4 - 33 (14.79.1) | 2 - 47 (11.79.5) | 3 - 36 (9.88.3) | |
| without preflare-VLP | Number | 21(54%) | 107(58%) | 140 (74%) |
| Rising-time (min) | 6 - 95 (25.223.0) | 2 - 103 (16.716.5) | 3 - 78 (13.211.8) |
Note. — The format of the numerical value of period, duration, and rising-time is: minimum - maximum (average mean square deviation). The percentage in the parentheses is the proportion in the same flare class.
From Table 1 and Figure 3, we can obtain several interesting conclusions:
(1) Each preflare-VLP lasts for about 30 - 200 min (the typical duration is in the range of 60 - 120 min, i.e. 1 - 2 hours) and contains 4 - 11 pulses. The typical pulsating period is in the range of 8 - 30 min. The longest period is 47 min (X1.0 flare, 11 June 2014) and the shortest one is 1.9 min (M1.0 flare, 5 November 2013). The averages are 16.47.4, 16.27.9, and 16.110.7 min in C-, M-, and X-class flares, respectively, just around a typical value of 168 min. Here, the values following the symbol are statistic mean square deviations.
(2) There is almost no obvious correlation between the timescales ( and ) of preflare-VLPs and the GOES SXR classes of the host flares. The difference of the average periods is very small between different flare classes.
(3) The stronger flares have higher probability to produce preflare-VLPs as well as the flares with shorter rising-time. For example, there are about 46% X-class flares have preflare-VLPs while the same percentage is only 26% in C-class flares. The average rising-times of C-, M-, and X-class flares with preflare-VLPs are 9.88.3, 11.79.5, and 14.79.1 min, while the same values for without preflare-VLPs are 13.211.8, 16.716.5, and 25.223.0 min, respectively. The longest rising-time of flare with preflare-VLP is shorter than 48 minutes, while all the flares with rising-time above 50 min are lack of preflare-VLP.
In fact, Figure 1 presents a typical example of long-rising X-class flare without preflare-VLP. The rising-time is 63 min. There is no obvious pulse during 2 hours in the preflare phase. Long-rising flares may release energy relatively slow in complex multi-loop system, and the plasma loops may disturb to each other, which drive the dynamic processes to become very complicated, obscure the signal of preflare-VLPs from the observations.
In section 2, we applied some cosine functions from the least-square method to fitting the preflare-VLP in Equation (1) - (4). In fact, we may summarize the fitted function into an unified format:
| (5) |
Here, is the average temperature of the background active region before the preflare-VLP.
is the growth rate of the average temperature of the background during preflare-VLP. It is positive () in most flare events, such as the X2.0 flare on 26 October 2014 and X2.7 flare on 05 May 2015. However, it is amazing that is negative in some events, such as the M2.9 flare on 25 October 2013 and C2.4 flare on 13 July 2013 (). Statistics indicates that there are about 20% flare events with decreasing mean temperature during the preflare phase .
is the pulse amplitude of the preflare-VLP which is generally a function of time. In the X2.0 flare on 26 October 2014, which is increasing with time. In the M2.9 flare on 25 May 2013 . But in the case of C2.4 flare on 13 July 2012, is approximated to a constant.
is the period of preflare-VLP which is generally a constant in most events, for example, s in the X2.0 flare on 26 October 2014, s in the X2.7 flare on 05 May 2015, and s in the C2.4 flare on 13 July 2012. However, in the case of M2.9 flare on 25 October 2013, is increasing with time.
4 Generation Mechanism of Preflare-VLP
Then, what is the cause of the formation of VLPs during the preflare phase?
As we know, it is ubiquitous that quasi-periodic pulsations (QPPs) with periods from sub-second to several minutes in multi-wavelength observations occur during the flare rising and postflare phases (Aschwanden 1987, Tan et al. 2010, Kupriyanova et al. 2010, Simoes, Hudson, and Fletcher 2015, etc.). The magnetohydrodynamic (MHD) oscillations are generally applied to explain the formation of QPPs. Because MHD oscillations can affect almost all aspects of the emission processes: magnetic reconnection and modulation of its rate, electron acceleration and dynamics, and plasma conditions. Periods and other parameters are linked with properties of emitting plasmas and morphology of magnetic fields (Roberts, Edwin, and Benz 1984, Aschwanden 1987, Nakariakov and Melnikov 2009). Foullon et al. (2005) reported long-period pulsations with timescale of 8 - 12 min of X-ray radiation during solar flares and interpreted them as a periodic pumping of electrons in a compact flaring loop modulated by MHD oscillation. Some people suggested that such pulsations might be related to the slow-mode oscillations in large scale coronal loops (Svestka 1994), while other work suggested that the long-period pulsations could be associated with gravity-driven solar interior modes and connected with the wave leakage of chromospheric oscillations (Yuan et al. 2011). Another possible explanation of VLPs is the thermal overstability of standing slow magnetoacoustic waves in the magnetic flux loops (Kumar, Nakariakov, and Moon 2016), such as the SUMER oscillations with periods in the range of 5 - 40 min and detected in long loops with lengths of 200 - 300 Mm (Wang 2011).
The MHD oscillation mode should be the most favorable candidate for explaining the formation of VLPs. However, when we utilize this mechanism to demonstrate the formation of preflare-VLPs we meet some serious questions: the flare explosion may be the trigger of VLPs during the flare, but what is the trigger of the oscillations before the flare onset without explosions? and how do we make a natural connection with the details of energy accumulation in preflare phase?
Actually, the preflare-VLP is much alike the quasi-periodic oscillations in precursor phase of a Tokamak s major disruption (Wesson 1997, Jiang et al. 2015). The precursor phase (similar to the preflare phase) lasts for typically 10 ms and the fast phase (similar to the flare rising phase) for about 1 ms at medium-sized Tokamaks. Because of electric currents and limited resistivity, the tearing-mode instability can produce the growth of magnetic oscillations of an m=2 mode in the precursor phase of Tokamak major disruptions (Jiang et al. 2015).
Similar to Tokamaks, the solar flaring loops also have longitudinal electric currents (Tan and Huang 2006, Tan et al. 2006). During the preflare phase, the flaring source region accumulates magnetic energy gradually through the photospheric convection. The photospheric convection can drive shearing, rotating and twisting motions around loop footpoints and drive electric currents in the plasma loop (Alfven and Carlqvist, 1967, Tobias and Cattaneo, 2013). The current-carrying plasma loop is analogous to a LRC-circuit with electric inductance and capacitance . Here, is the plasma density in unit of , is the plasma number density, , and are the cross-sectional area (), length of the plasma loop () and and electric current (), respectively. Such LRC-circuit will produce intrinsic oscillation (Zaitsev et al. 1998) with period,
| (6) |
LRC-oscillation can modulate both thermal and nonthermal emission. The thermal emission contributes to SXR emission while the nonthermal emission contributes to hard X-ray emission and energetic particles. The period of LRC oscillation is proportional to the cross-sectional area (S), and anti-proportional to the electric current (I) in the loop. Supposing typical values in the flaring coronal loop: , , and the cross-sectional radius is (Bray et al. 1991). Considering the period of preflare-VLPs is 1.9 - 47 min, the electric current will be about A.
Are these estimated electric currents reasonable? Many people obtained the maximum current is in magnitude of A in an active region during a solar flare derived from the vector magnetograph observations (Canfield et al. 1993, Tan et al. 2006, etc.). Reminding that an active region is always composed of several decades or hundreds of plasma loops, it is reasonable to suppose that the electric current will be in a magnitude of A or lower in a single flaring plasma loop, especially in the preflare phase.
Spangler developed a new method to observe the radio signal from a remote quasar 3C228 when the emission passes by the solar limb coronal loops, and obtained the electric current - A in the coronal loops (Spangler 2007). In fact, during the flare rising phase, QPPs are also existing frequently with period from several seconds up to about 2 min (Simoes, Hudson, and Fletcher 2015), which are shorter than the period of the above preflare-VLPs. If we apply the same LRC oscillation mechanism to explain them, a stronger electric current with magnitude of - A can be obtained. It is natural because the flaring plasma loop may become more unstable and generate stronger electric currents during the flare rising phase.
The long-rising flares tend to be lack of preflare-VLP. It is possible that the long-rising flare may have relatively slow energy release and the flaring loops may disturb each other. These mutual interferences make the dynamic processes become complex, obscure the evidence of preflare-VLPs from the observations.
5 Summary
In brief, based on the analysis of the standard GOES SXR recorded data, we discovered and confirmed that there were at least one-third solar flares accompanying with preflare-VLPs, whose typical periods were in the range of 8 - 30 min and durations in the range of 1 - 2 hours. It is possible that this kind of pulsations should be associated with some MHD oscillation modes, similar to other QPPs occurring in the flare rising and postflare phases. At the same time, the LRC-oscillation is also a favorable mechanism to interpret the formation of preflare-VLP, which is associated with current-carrying plasma loops. With LRC-oscillation, the preflare-VLP may provide two important information for understanding the solar explosions:
(1) The existence of preflare-VLPs indicates that electric currents are generated in flaring plasma loops before the onset of flares. The current-carrying loop may drive the plasma instabilities, modulate SXR emission, and produce preflare-VLPs. By studying the details of preflare-VLP, we may reveal the real triggering mechanism of solar flares, the energy release, and development of the source regions.
(2) The preflare-VLP can be regarded as a precursor of solar flares. It is very simple to distinguish and extract a signal of preflare-VLP from the GOES SXR observation data. And the duration with 1 - 2 hours is long enough for us to response to the influence of a powerful solar eruption. Therefore, preflare-VLP can be regarded as a convenient precursory indicator to predict the forthcoming of solar flares and the possibility of disastrous space weather events and make an early warning.
Actually, besides the GOES SXR observation data, it is possible that we can obtain much more information of the preflare-VLP from the new generation, long-term continuous observations. For example, the imaging observation of the Atmospheric Imaging Assembly onboard NASA’s satellite Solar Dynamic Observatory may provide abundance imaging information of thermal emission in the source regions with high spatial resolution (SDO/AIA, Lemon et al. 2012). Additionally, the Chinese Spectral Radioheliograph (CSRH, Yan et al. 2009, now renamed Mingantu Spectral Radioheliograph, MUSER) which can provide not only the nonthermal broadband spectral structures, but also the variations of location and shape in the source region with very high resolutions.
References
- Alfven (1967) Alfven, H. & Carlqvist, P.: 1967, SoPh, 1, 220
- Aschwanden (1987) Aschwanden, M. J.: 1987, SoPh, 111, 113
- Bloomfield (2012) Bloomfield, D. S., Higgins, P. A., McAteer, R. T. J, & Gallagher, P. T.: 2012, ApJL, 747, L41
- Bray (1991) Bray, R. J., Cram, L. E., Durrant, C. J., & Loughhead, R. E.: 1991, Plasma loops in the solar corona, New York: Cambridge University Press
- Canfield (1993) Canfield, R. C., de La Beaujardiere, J.-F., Fan, Y. H., et al.: 1993, ApJ, 411, 362
- Chifor (2006) Chifor, C., Mason, H. E., Tripathi, D., Isobe, H., & Asai, A.: 2006, A&A, 458, 965
- Foullon (2005) Foullon, C., Verwichte, E., Nakariakov, V. M., & Fletcher, L.: 2005, A&A, 440, L59
- Garcia (1994) Garcia, H. A.: 1994, SoPh, 154, 275
- Georgoulis (2001) Georgoulis, M. K., Vilmer, N., & Crosby, N. B.: 2001, A&A, 367, 326
- Gonzalez (2014) Gonzalez, H., I., Komm, R., Pevtsov, A., & Leibacher, J. W.: 2014, SoPh, 289, 437
- Harrison (1987) Harrison, R. A.: 1987, A&A, 182, 337
- Huang (2010) Huang, X., Yu, D. R, Hu, Q. H., Wang, H. N., & Cui, Y. M.: 2010, SoPh, 263, 175
- Jiang (2015) Jiang, M., Hu, D., Wang, X. G., et al.: 2015, Nucl. Fusion, 55, 083002
- Kumar (2016) Kumar, S., Nakariakov, V. M, & Moon, Y.-J.: 2016, ApJ, 824, 8
- Kupriyanova (2010) Kupriyanova, E.G., Melnikov, V.F., Nakariakov, V.M., & Shibasaki, K.: 2010, SoPh, 267, 329
- Lemen (2012) Lemen, J. R., Title, A. M., Akin, D.J., et al.: 2012, SoPh, 275, 17
- Martin (1980) Martin, S.: 1980, SoPh, 68, 217
- Nakariakov (2009) Nakariakov, V. M., & Melnikov, V. F.: 2009, SSRv, 149, 119
- Nonweiler (1958) Nonweiler, T.: 1958, Natur, 182, 468
- Pick (2008) Pick, M., & Vilmer, N.: 2008, A&ARv, 16, 1
- Roberts (1984) Roberts, B., Edwin, P. M., & Benz, A. O.: 1984, ApJ, 279, 857
- Scafetta (2003) Scafetta, N., & West, B. J.: 2003, PRL, 90, 8701
- Shibata (2011) Shibata, K., & Magara, T.: 2011, LRSP, 8, 6
- Simoes (2015) Simoes, P. J. A., Hudson, H. S., & Fletcher, L.: 2015, SoPh, 290, 3625
- Spangler (2007) Spangler, S. R.: 2007, ApJ, 670, 841
- Svestka (1994) Svestka, Z.: 1994, SoPh, 152, 505
- Tan (2006) Tan, B. L., & Huang, G. L.: 2006, A&A, 453, 321
- Tan (2006) Tan, B. L., Ji, H. S., Huang, G. L, Zhou, T. H., Song, Q. W., & Huang, Y.: 2006, SoPh, 239, 137
- Tan (2010) Tan, B. L., Zhang, Y., Tan, C. M., & Liu, Y. Y.: 2010, ApJ, 723, 25
- Tandberg-Hanssen (1988) Tandberg-Hanssen, E., & Emslie, A.: 1988, The Physics of Solar Flares (Chapter 1), Cambridge Uni Press
- Tappin (1991) Tappin, S. J.: 1991, Astron. Astrophys. Suppl. Ser., 87, 277
- Thomas (1985) Thomas, R. J., Starr, R., & Crannell, C. J.: 1985, SoPh, 95, 323
- Tobias (2013) Tobias, S. M., & Cattaneo, F.: 2013, Natur, 497, 461
- Wang (2011) Wang, T. J.: 2011, Space Sci. Rev., 158, 397
- Wesson (1997) Wesson, J.: 1997, Tokamak(Chapter 7), Clarendon Press, Oxford
- White (2005) White, S. M., Thomas, R. J., & Schwarts, R. A.: 2005, SoPh, 227, 231
- Yan (2009) Yan, Y. H., Zhang, J., & Wang, W., et al.: 2009, EM&P, 104, 97
- Yuan (2011) Yuan, D., Nakariakov, V. M., Chorley, N., & Foullon, C.: 2011, A&A, 533, 116
- Zaitsev (1998) Zaitsev, V. V., Stepanov, A. V., Urpo, S., & Pohjolainen, S.: 1998, A&A, 337, 887
- Zhang (2008) Zhang, Y., Tan, B. L., & Yan, Y. H.: 2008, ApJ, 682, L133
- Zhang (2015) Zhang, Y., Tan, B. L., & Karlicky, M., et al.: 2015, ApJ, 799, 30