Cell division and death inhibit glassy behaviour of confluent tissues
Abstract
We investigate the effects of cell division and apopotosis on collective dynamics in two-dimensional epithelial tissues. Our model includes three key ingredients observed across many epithelia, namely cell-cell adhesion, cell death and a cell division process that depends on the surrounding environment. We show a rich non-equilibrium phase diagram depending on the ratio of cell death to cell division and on the adhesion strength. For large apopotosis rates, cells die out and the tissue disintegrates. As the death rate decreases, however, we show, consecutively, the existence of a gas-like phase, a gel-like phase, and a dense confluent (tissue) phase. Most striking is the observation that the tissue is self-melting through its own internal activity, ruling out the existence of any glassy phase.
I Introduction
Simple epithelial tissues consist of a single layer of tightly connected cells. Especially during development, epithelial cells grow, divide and move, leading to a dynamic reorganisation of the entire tissue. This process is regulated by a complex set of chemical and mechanical signalling pathways Lecuit et al. (2011); Janmey and Miller (2011); Mammoto and Ingber (2010); Tenney and Discher (2009) that control cell shapes and cell-cell contacts. How the regulation of cell-cell interactions is transmitted to the tissue-level organisation is still a topic of active research. Mechanical signalling, i.e., a set of processes that control the cell response to mechanical stimuli in the form of externally applied or internally generated forces, is at present only partly understood. Janmey and Miller (2011) One well-known example of mechanics-influenced regulation is the density-dependent inhibition of proliferation in cell monolayers. Martz and Steinberg (1972); Alberts et al. (2007) A hallmark of cancerous tissues is the absence of this regulation, leading to uncontrolled tumour growth. Perturbations in the mechanical sensing of cells have been reported to be relevant in several diseases such as osteoporosis and atherosclerosis. Jacobs et al. (2013) Breast cancer, Paszek et al. (2005) cardiovascular Engler et al. (2008) and liver diseases Li et al. (2007) as well as renal glomerular disease Tandon et al. (2007) are all known to be accompanied by significant changes in the mechanical properties of relevant tissues.
Recent advances in microscopy techniques and powerful algorithms for automated cell tracking have enabled studies of collective cell migration for large cell numbers, over extended periods of time and with high spatial resolution, both in vitro and in vivo. Traction force microscopy Harris et al. (1980) measurements revealed that the collective motion of epithelial cell layers is far more complex than previously believed. Angelini et al. (2011); Tambe et al. (2011); Trepat and Fredberg (2011) Homogeneous cell sheets behave as a supercooled fluid at long time scales and as a glass at short time scales, showing large spatial fluctuations of the inter-cellular forces. These fluctuations cannot be pinpointed to a specific cell but extend over regions spanning several cells. Szabó et al. (2006); Trepat et al. (2009); Sadati et al. (2013) They strongly resemble the fluctuations observed in supercooled colloidal and molecular liquids approaching the glass transition Angelini et al. (2011) with evidence of dynamical heterogeneity, a hallmark of glassy dynamics that has been extensively studied in soft condensed matter physics.
In spite of the many interesting similarities to soft glasses, cell sheets viewed as active materials constitute a new class of non-equilibrium system in which the interplay between activity, long range elasticity and cell interactions give rise to novel phases with unusual structural, dynamical and mechanical properties. Fily and Marchetti (2012); Fily et al. (2014); Bi et al. (2016) Many recent works have shown that cell activity, for example in the form of self-propulsion, has the capability to fluidise a confluent tissue, but only above a critical level of activity. Fily et al. (2014); Berthier (2014); Bi et al. (2016); Mandal et al. (2016) At low enough activity all of these works report the existence of a glassy phase where cell diffusion ceases.
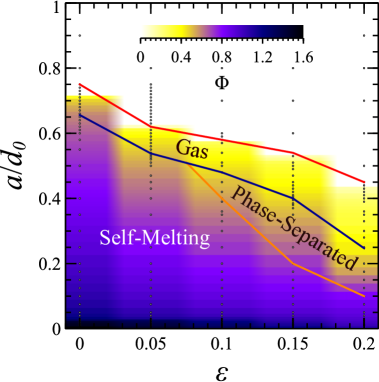
In contrast, in this paper we show that the simple presence of any finite rate of cell division and death completely destroys the glassy dynamics of the tissue. In agreement with Ranft et. al Ranft et al. (2010), we report that cell division and apopotosis always fluidises the confluent tissue. To systematically explore the effect of cell division and cell death as an active driver, we introduce a minimal particle-based model based on simplified cell and division dynamics. This allows us to fully explore the phase space of the model and enumerate its phases, from gaseous to gel-like and eventually confluent, as a function of the relative death to division ratio (Figure 2). We carefully characterise the lower-density transitions (absorbing to gaseous, phase separated to gel-like) to produce a phase diagram (Figure 6). In the confluent phase, we show the self-melting effect of a range of division and death rates, and their scaling limits (Figure 8). Finally, we compare division and death dynamics to active self-propulsion dynamics and show that at the long time scales relevant to glassy dynamics, the effect of division always dominates (Figure 9).
II Model
Cell shape is known to play an important role in tissue organisation, and it is controlled by a complex set of signalling pathways. Lecuit and Lenne (2007) Despite its complexity, a remarkable amount of information about collective behaviour at scales exceeding the size of a single cell can be gained from effective models that treat cells as soft elastic objects. Zimmermann et al. (2016) More generally, particle based tissue models have been successfully applied to a wide range of systems (for a complete review see Drasdo et al. and the references within Drasdo et al. (2007)). In this study we take a similar approach and consider a model where the cells are represented by soft spheres of radius . The tissue consists of a collection of such spheres with radii uniformly distributed in the range of to .
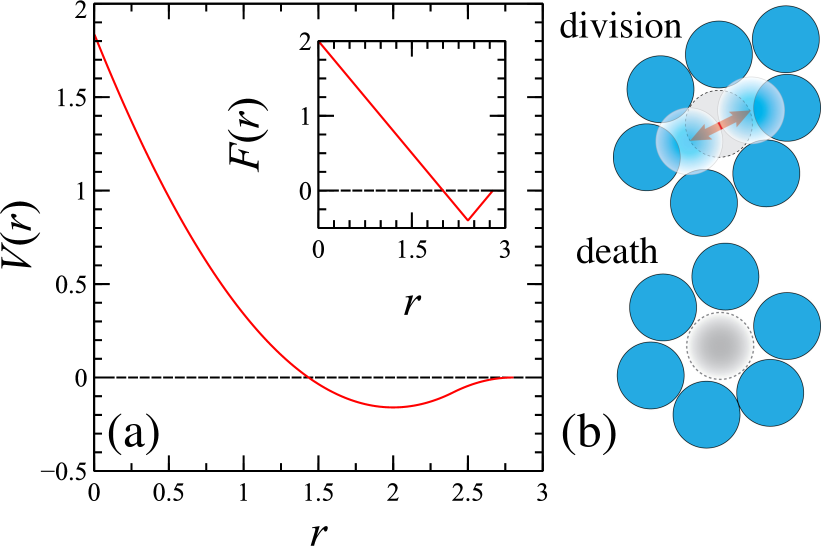
We model the contact forces between two cells and through a pair potential that includes short range repulsion to mimic volume exclusion, together with short range adhesion (see Figure 1(a)). Szabó et al. (2006); Drasdo et al. (2007) The potential is given by
| (1) |
where is the stiffness constant, is the sum of the particle radii, and is the adhesive force strength.
In accordance with micron-size scales for cell diameters, we neglect inertia effects and model the dynamics of the cell positions as fully overdamped Henkes et al. (2011)
| (2) |
where is the inverse friction coefficient and is the total force acting on particle exerted by its neighbours.
The only source of activity in the system is cell division and apoptosis, as schematically drawn in Figure 1(b). Apoptosis is included by removing cells randomly at constant rate . Note that this simplified approach can also model other removal mechanisms, such as sheet extrusion or ingression from the sheet into other tissues. Motivated by the well-known density-dependent inhibition of proliferation in cell monolayers, Martz and Steinberg (1972); Alberts et al. (2007) we model cell division as a density dependent mechanism with a division rate
| (3) |
where is the division rate amplitude, is the number of contact neighbours of the particle and is number of contact neighbours at which division ceases in the system. We fix the maximum value of nearest neighbours to , i.e. a full ring of nearest neighbours. Taking rearrangements into account, this allows for the neighbour distribution with mean typical of a two-dimensional confluent tissue, Sandersius et al. (2011); Gibson et al. (2006) see Figure 1(b). We replace the cell by the new mother-daughter pair located on top of each other, and then linearly fade in their mutual potential , therefore preventing jumps in the local forces.
Our model contains two microscopic time scales: the elastic interaction time scale and a much longer time scale introduced by the active division process . We fix the simulation time unit by setting .
Then the phase space can be explored varying only three control
parameters: the ratio of apoptosis to division rate, ,
the ratio of attraction to repulsion . (3) Furthermore,
we have established that the homeostatic properties of the system
(density, pressure, contact number) do not depend on (see SI,
section A). We study the dynamics of the model in a square box of size
with periodic boundary conditions to mimic the bulk dynamics
of the tissue. Depending on final density, this is equivalent to
particles. The simulations were carried out using both a
C GPU-parallel Molecular Dynamics code (see SI,
section D), and the multi-purpose active matter simulation code SAMoS
(Soft Active Matter on Surfaces). Barton et al. (2016)
III Results and Discussion
To study the interplay between activity and adhesion, we explore the phase space of and .
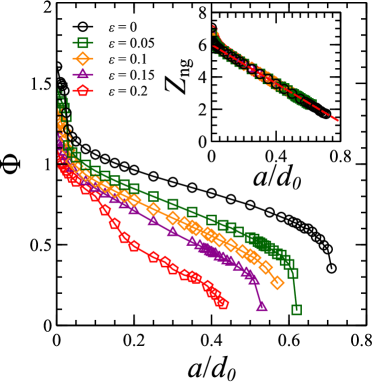
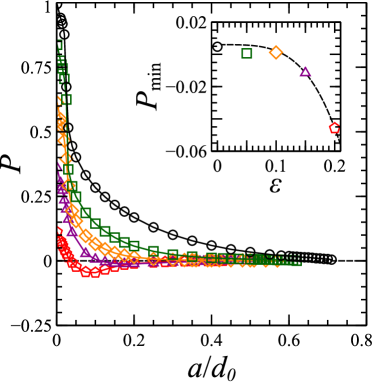
We monitor the state of the system by following the packing fraction , the number of contact neighbours and the virial pressure . The corresponding results are shown in Figures 3 and 4.
At high apoptosis rates , the system is unable to reach a steady state at non-zero density, i.e. the colony dies out. We find an -dependent critical where the cell division is first able to balance cell death and the system reaches a gas-like state (Fig. 2(a)). Since all of the values are below the expected threshold of stability, , it is clear that collective effects play a role. In the steady state, the rate of loss of particles and the actual division rate balance each other, i.e. , where the average takes local correlations into account. Intuitively, we can derive the following mean-field scaling for the contact number,
| (4) |
As shown in the inset to Fig. 3, the curves for all collapse, and deviations from the linear scaling occur only at the lowest .
What sets the critical value remains an open question. If we extend the mean-field argument to the mean density, , where is the packing fraction of a system with , we obtain a linear scaling that is consistent with much of the intermediate range. However, this argument overestimates when is increased.
Clustering is observed at in the absence of any adhesion force, simply due to the fact that cell divisions create new cells nearby. Houchmandzadeh (2002) Spatial heterogeneities lower the effective division rate since the typical number of neighbours increases, and hence the critical apoptosis rate also decreases. As we increase the adhesion force, we observe even stronger spatial heterogeneities and so the effective local division rate decreases more strongly, due to the contact number in the clusters reaching . We predict a decrease of the critical with , consistent with the numerical results in Fig. 6. The actual lowest achievable is in fact set by a first passage problem: no colony can recover once all cells have died. It is important to note that the finite size has a crucial effect in this situation. Further work is needed to explore this effect in more detail (see SI, section B).
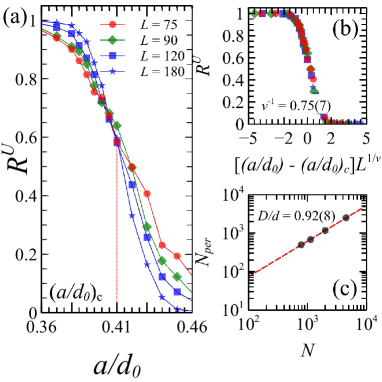
In addition, decreasing from its critical value causes a rapid increase in the density, leading to a gel-like percolated structure (Fig. 2(b)). We investigate the percolation threshold by using the probability of finding a system of size that percolates in any direction at a given ratio, Yonezawa et al. (1989). Using finite-size scaling theory, Binder (1997) we can obtain the percolation threshold for each value of , giving rise to the blue transition line in the phase diagram Fig. 6. The results for are shown in 5(a), and the data collapse of in Fig. 5(b) reveals that the critical exponent characerising the divergence of the correlation length observed in our system is consistent with ordinary random percolation. Stauffer and Aharony (1994)
In addition, we measure the fractal dimension by plotting the size of the percolation cluster, at at the critical point versus the size of the system , see Fig.5(c). The value is consistent with independent measures using the structure factor (see Fig. 10c). The presence of space-filling clusters can be understood from our division process: should any cluster with appear, its mean contact number will fall significantly below , leading to growth to fill in the holes.
Depending on the strength of the adhesion force , the final confluent tissue state, Fig. 2(c) is reached either directly or through phase separation mechanism where a gel-like structure appears in the system. In section III.1 we discuss the self-melting phase in more detail, and the gel phase in section III.2. Additionally, for large attraction , the central soft core repulsion can be overcome, and the system aggregates into an unphysical series of clumps.
We have constructed the phase diagram shown in Fig. 6 using the results discussed above, together with the methods described in the followings subsections.
III.1 Self-melting confluent tissue
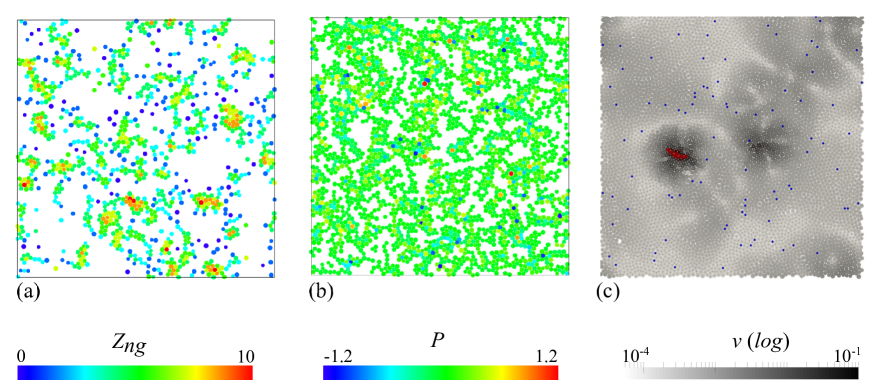
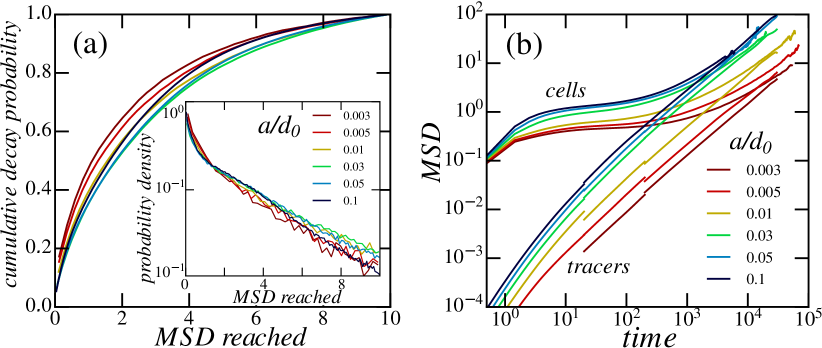
The key result here concerns the confluent tissue, where we observe a very slow dynamics, which is nevertheless fluidised by the presence of dividing and dying particles. We illustrate the dynamics of this state in Fig. 2(c), where particles are colour-coded by their velocity magnitude. Each individual death or division event is responsible for a displacement wave that propagates diffusively, and that, together with other events, leads to rearrangements in the system and eventually to a finite diffusive motion of cells. This dynamics leads to a liquid state at all values of the activity quantified by and . We measure the mean-square displacement by tracking cells directly from their birth from a division event until death (blue particles in Fig. 2(c)). In Figure 7, we first show that cells follow a characteristic displacement profile, consisting of a rapid push away from the mother, then a plateau period, and eventually diffusion (see panel b). While at first glance these resemble the MSD curves of a supercooled liquid, the origin of the behaviour is very different. In panel a, it becomes apparent that, regardless of the value of , more than half the cells reach the cage breaking threshold . There is also no sign of the gaussian displacement profiles expected from caging: the probability distribution of large displacements is exponential (see inset), which is consistent with a process combining a constant death rate with spatial diffusion.
To avoid the confounding influence of the inital division event, and the poor statistics at large times, we add of non-dividing but otherwise identical tracer particles to the system. Panel (b) shows that while at large times, the tracers follow the same diffusive curves as the cells, their behaviour remains diffusive down to very short length and time scales. We focus on the tracer particles in the following, as they represent the overall tissue flow.
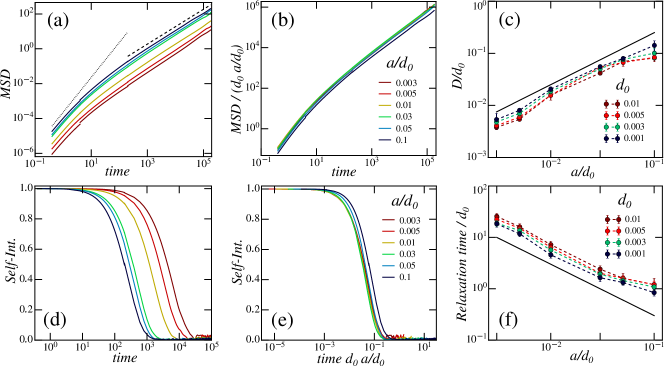
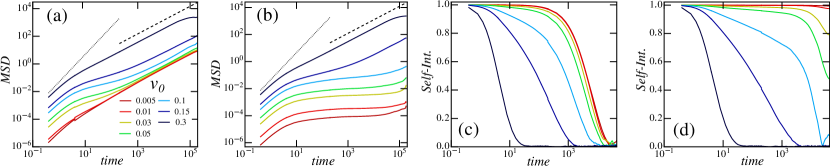
Figure 8(a) shows a typical set of MSD curves. We observe a ballistic scaling at short times and very small displacements, characteristic of the persistent motion due to individual division or death events and thus dependent on the internal relaxation dynamics characterised by the surface friction and the elastic stiffness of individual cells (see section D of the SI). The strain field caused by these events corresponds to classical long range elasticity Matoz-Fernandez et al. as a response to the changes in local structure. Signatures of this elastic response can be seen in the velocity field in Fig. 2(c). In the long time limit at times longer than a characteristic time , the dynamics become diffusive. From the long-time behaviour of the tracer motion we define a diffusion coefficient from . In addition, Fig. 8(c) shows the scaled diffusion coefficient as a function of the division/death ratio . As can be seen, the curves collapse consistently with a linear scaling , with some deviations for the largest values of the activity . This last result is in accordance with the theoretical description presented by Ranft et.al Ranft et al. (2010).
To better understand how cells decorrelate their positions in time, we compute the self-intermediate scattering function , for a value of . As in ordinary liquids and unlike in glassy or supercooled systems, we find a single decay time scale, as shown in Fig. 8(d). We fit the decorrelation time at which has decayed by half. As shown in panel (f), we observe a simple scaling collapse, as a very good approximation, with again deviations at the largest . In panel (e), we have rescaled time by the effective inverse time scale , i.e. the apoptosis rate. We observe collapse of the curves, and the same holds for the MSD curves (panel (b)). This means that the only relevant time scale for fluidisation is the division time scale proportional to in the stationary state. This fluidisation dynamics is independent of system size for (see section C of the SI), and there is no indication of a phase transition. We also emphasise that in this model at there is simply no motion whatsoever.
To show how the fluidisation time scale relates to other driving sources in cell sheets, we added individual motility to the particles. We use a standard form of active dynamics, Cristina Marchetti et al. (2016) a non-aligning active force term , where the unit vector diffuses with rotational diffusion coefficient . It has been shown that in the absence of division or death, this dynamics leads to a glassy phase at sufficiently high density and low . Berthier (2014); Fily et al. (2014) For high values of , the system can be mapped to a thermal system with effective temperature and mostly analogous glassy dynamics. Szamel et al. (2015) Here we consider the case of , which fits into this regime. In Fig. 9 we compare the system with only active motion (panels (b) and (d)) to a system with both active motion and a very small rate of division and death (panels (a) and (c)).
In the system with only active driving, we see a clear transition through the active glass transition as a function of . The MSD (panel (b)) shows an indefinite plateau at low which then increases quadratically with , until it reaches the cage breaking threshold. Panel (d) shows the self-intermediate scattering function characterising the decorrelation of cell positions. As expected for a system with glassy dynamics, does not decay significantly for the low systems, but decays at increasingly shorter time scales for larger . The actual shape of exhibits a stretched exponential decay visible over the whole time range. This is likely due to the active nature of the dynamics, and the known effects of on the detailed phenomenology of the glass transition. Flenner and Szamel (2015)
If we now add a small amount of cell division dynamics ( and ), we observe that the active dynamics of the system is fully dominated by cell division/apoptosis events. This leads to a complete decorrelation of the positions, i.e. a fluidised tissue (panel (c)), and purely diffusive dynamics of the MSD beyond the ballistic time scale (panel (a)). The decay of the intermediate structure factor (panel (c)) for dynamics with cell division is unaffected only for the largest , with a decay that is otherwise truncated by the rapid decay of the dividing contribution. In the same way, only the MSD for the largest that was already diffusive without the division is unaffected. The curves at low essentially collapse on top of the division-only curve. This remarkable results demonstrate that at long time scales, the division dynamic dominates for low values of the driving , therefore erasing any signatures of the glassy state.
III.2 Gel phase
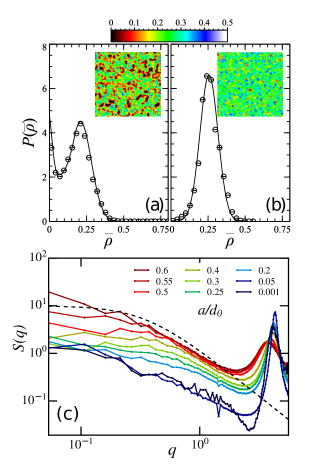
In the intermediate activity rate region, above the percolation point, we observe either a confluent tissue, or a phase separated system with strong density heterogeneities. This gel phase is absent at low adhesion strengths () and dominates at larger adhesion values. In order to quantify this gel phase we analyse the coarse-grained density field. Testard et al. (2014) First, we discretise space into boxes of length and define a discrete density field for discrete positions located at the centre of the boxes
| (5) |
where is the elementary volume, is the Heaviside function and is the mean particle radius. The coarse grained density field is smoothed over adjacent boxes:
| (6) |
where is the unit vector in the direction. As in Testard et. al Testard et al. (2014) we set .
In Fig. 10, we show typical density fields for and two rates on both sides of the transition. As can be seen from Fig. 10(a), for , the system is in a phase coexistence state characterised by a strongly heterogeneous coarse-grained density. On the other hand, for a very low apoptosis rate (Fig. 10(b)), the system is homogeneous. The probability distribution of the coarse-grained density gives us a systematic method to distinguish between the intermediate gel phase and the high density self-melting confluent tissue phase. As can be seen in Fig. 10, in the gel phase is characterised by two peaks reflecting phase coexistence. One peak is located at almost zero density representing the non-percolated phase (gas phase). A second peak is at intermediate density representing the cluster phase On the other hand, for the high density self-melting confluent tissue the probability distribution of the coarse-grained density is represented by a single peak as expected. We used the presence of a second peak to construct the Phase-separated - Self-melting transition line showed in Fig. 6. In Fig. 10c, we show the static structure factor for a cut through the phase diagram varying . In addition to a peak corresponding to the position of the nearest neighbours at all , we find an increase of ). This peak increases with decreasing right up to the absorbing boundary, and is consistent with a scaling , with increasing , cut off by the system size. This result agrees with the measured fractal dimension of the percolation clusters, and we conclude that the gel phase clusters also have .
Interestingly, the formation of the gel is accompanied by the build-up of a negative pressure in the system as demonstrated in Fig. 4. The source of this negative pressure is that the percolated network structure may exhibit tensile stresses due to the attractive forces when confined to a fixed volume. Therefore, the measurement of a global quantity like the pressure can already give some information on the underlying internal structure.
IV Conclusions
In summary, using a simple model that includes only three independent parameters, we have been able to explore active dynamics relevant to tissues. As we increase the apoptosis rate for a given adhesion force, we encounter, sequentially, a dense confluent tissue phase, a network forming phase, a low density clustering phase and a region where the tissue is dying. We observe that in confluent tissues, regardless of the level of active driving our model fluidises at long times, above the division time scale. Signatures of active glassy dynamics only exist at very short time scales, however they are already severely affected by the division dynamics. We emphasise that this behaviour is not solely a property of the model presented here. For example, in an active vertex model simulation, Barton et al. (2016) we have confirmed that adding cell division as only source of activity also fluidises the tissue. We have also carried out a full rheological analysis of this model, Matoz-Fernandez et al. (2016) and confirmed the fluid behaviour.
The absence of a glassy phase in a system with any level of division or death events is important for the biology of tissues. Our results suggests that in actual developmental epithelial tissues (e.g. drosophila, chick embryo and the mammalian cornea), where there is substantial division dynamics, active glassy dynamics does not play a fundamental role. Only in vitro systems that have suppressed division rates are more likely candidates to show true glassy features. A number of recent results Park et al. (2015); Bi et al. (2016) predict a glassy phase in confluent tissues, based on a shape parameter relating perimeter and area of cells. However, the associated models Bi et al. (2016); Farhadifar et al. (2007) all neglect cell division and death.
In further studies it will be important to also consider other biological processes that involve more complex collective processes. During organ development or tumour growth, the cells organise themselves in a collective manner by regulating proliferation rate (cell division) and cell death (apoptosis). Gene expression and tissue pattern formation can be highly influenced by the spatial distribution of mechanical stresses. Farge (2003); Fernandez-Gonzalez et al. (2009)
Acknowledgements
J.-L. B. and D. A. M.-F. acknowledge financial support from ERC grant ADG20110209. J.-L. B., D. A. M.-F. and K. M. thanks the NVIDIA Corporation for the hardware grant through the Academic Partnership Program. SH and RS would like to thank Prof Inke Näthke and Prof Kees Weijer for many illuminated discussion on biology of developing tissues. RS acknowledges support by the UK EPSRC (award EP/M009599/1) and BBSRC (award BB/N009789/1). SH acknowledges support by the CPTGA visiting researcher fund that allowed her to spend time in Grenoble and the BBSRC (award BB/N009150/1).
References
- Lecuit et al. (2011) T. Lecuit, P.-F. Lenne and E. Munro, Annu. Rev. Cell Dev. Biol., 2011, 27, 157–184.
- Janmey and Miller (2011) P. A. Janmey and R. T. Miller, J. Cell. Sci., 2011, 124, 9–18.
- Mammoto and Ingber (2010) T. Mammoto and D. E. Ingber, Development, 2010, 137, 1407–1420.
- Tenney and Discher (2009) R. M. Tenney and D. E. Discher, Curr. Opin. Cell Biol., 2009, 21, 630–635.
- Martz and Steinberg (1972) E. Martz and M. S. Steinberg, J. Cell Physiol., 1972, 79, 189–210.
- Alberts et al. (2007) B. Alberts, A. Johnson, J. Lewis, M. Raff, K. Roberts and P. Walter, Molecular Biology of the Cell, Garland Science, 5th edn, 2007.
- Jacobs et al. (2013) C. R. Jacobs, H. Huang and R. Y. Kwon, Introduction to Cell Mechanics and Mechanobiology, Garland Science, 2013.
- Paszek et al. (2005) M. J. Paszek, N. Zahir, K. R. Johnson, J. N. Lakins, G. I. Rozenberg, A. Gefen, C. A. Reinhart-King, S. S. Margulies, M. Dembo, D. Boettiger et al., Cancer Cell, 2005, 8, 241–254.
- Engler et al. (2008) A. J. Engler, C. Carag-Krieger, C. P. Johnson, M. Raab, H.-Y. Tang, D. W. Speicher, J. W. Sanger, J. M. Sanger and D. E. Discher, J. Cell Sci., 2008, 121, 3794–3802.
- Li et al. (2007) Z. Li, J. A. Dranoff, E. P. Chan, M. Uemura, J. Sévigny and R. G. Wells, Hepatology, 2007, 46, 1246–1256.
- Tandon et al. (2007) R. Tandon, I. Levental, C. Huang, F. J. Byfield, J. Ziembicki, J. R. Schelling, L. A. Bruggeman, J. R. Sedor, P. A. Janmey and R. T. Miller, Am. J. Physiol. Renal Physiol., 2007, 292, F701–F710.
- Harris et al. (1980) A. K. Harris, P. Wild and D. Stopak, Science, 1980, 208, 177–179.
- Angelini et al. (2011) T. E. Angelini, E. Hannezo, X. Trepat, M. Marquez, J. J. Fredberg and D. A. Weitz, Proc. Natl. Acad. Sci. USA, 2011, 108, 4714–4719.
- Tambe et al. (2011) D. T. Tambe, C. C. Hardin, T. E. Angelini, K. Rajendran, C. Y. Park, X. Serra-Picamal, E. H. Zhou, M. H. Zaman, J. P. Butler, D. A. Weitz et al., Nat. Mater., 2011, 10, 469–475.
- Trepat and Fredberg (2011) X. Trepat and J. J. Fredberg, Trends Cell Biol., 2011, 21, 638–646.
- Szabó et al. (2006) B. Szabó, G. J. Szöllösi, B. Gönci, Z. Jurányi, D. Selmeczi and T. Vicsek, Phys. Rev. E, 2006, 74, 061908.
- Trepat et al. (2009) X. Trepat, M. R. Wasserman, T. E. Angelini, E. Millet, D. A. Weitz, J. P. Butler and J. J. Fredberg, Nat. Phys., 2009, 5, 426–430.
- Sadati et al. (2013) M. Sadati, N. T. Qazvini, R. Krishnan, C. Y. Park and J. J. Fredberg, Differentiation, 2013, 86, 121–125.
- Fily and Marchetti (2012) Y. Fily and M. C. Marchetti, Phys. Rev. Lett., 2012, 108, .
- Fily et al. (2014) Y. Fily, S. Henkes and M. C. Marchetti, Soft Matter, 2014, 10, 2132–40.
- Bi et al. (2016) D. Bi, X. Yang, M. C. Marchetti and M. L. Manning, Phys. Rev. X, 2016, 6, 21011.
- Berthier (2014) L. Berthier, Phys. Rev. Lett., 2014, 112, 220602.
- Mandal et al. (2016) R. Mandal, P. J. Bhuyan, M. Raob and C. Dasgupta, Soft Matter, 2016, 12, 6268–6276.
- Ranft et al. (2010) J. Ranft, M. Basan, J. Elgeti, J.-F. Joanny, J. Prost and F. Jülicher, Proc. Natl. Acad. Sci. USA, 2010, 107, 20863–20868.
- Lecuit and Lenne (2007) T. Lecuit and P.-F. Lenne, Nat. Rev. Mol. Cell Biol., 2007, 8, 633–644.
- Zimmermann et al. (2016) J. Zimmermann, B. A. Camley, W.-J. Rappel and H. Levine, Proc. Natl. Acad. Sci. USA, 2016, 113, 2660–2665.
- Drasdo et al. (2007) D. Drasdo, S. Hoehme and M. Block, J. Stat. Phys., 2007, 128, 287–345.
- Henkes et al. (2011) S. Henkes, Y. Fily and M. C. Marchetti, Phys. Rev. E, 2011, 84, 84–87.
- Sandersius et al. (2011) S. A. Sandersius, M. Chuai, C. J. Weijer and T. J. Newman, PLoS ONE, 2011, 6, 1–11.
- Gibson et al. (2006) M. C. Gibson, A. B. Patel, R. Nagpal and N. Perrimon, Nature, 2006, 442, 1038–1041.
- Barton et al. (2016) D. L. Barton, S. Henkes, C. J. Weijer and R. Sknepnek, arXiv preprint arXiv:1612.05960, 2016.
- Houchmandzadeh (2002) B. Houchmandzadeh, Phys. Rev. E, 2002, 66, 052902.
- Yonezawa et al. (1989) F. Yonezawa, S. Sakamoto and M. Hori, Phys. Rev. B, 1989, 40, 636–649.
- Binder (1997) K. Binder, Reports on Progress in Physics, 1997, 60, 487.
- Stauffer and Aharony (1994) D. Stauffer and A. Aharony, Introduction To Percolation Theory, Taylor & Francis, 1994.
- (36) D. A. Matoz-Fernandez, F. Puosi, K. Martens and J. L. Barrat, In preparation.
- Cristina Marchetti et al. (2016) M. Cristina Marchetti, Y. Fily, S. Henkes, A. Patch and D. Yllanes, Curr. Opin. Colloid Interface Sci., 2016, 21, 34–43.
- Szamel et al. (2015) G. Szamel, E. Flenner and L. Berthier, Phys. Rev. E, 2015, 91, 062304.
- Flenner and Szamel (2015) E. Flenner and G. Szamel, Nature Comm., 2015, 6, 7392.
- Testard et al. (2014) V. Testard, L. Berthier and W. Kob, J. Chem. Phys., 2014, 140, 164502.
- Matoz-Fernandez et al. (2016) D. A. Matoz-Fernandez, E. Agoritsas, J.-L. Barrat, E. Bertin and K. Martens, Phys. Rev. Lett., 2017, 118, 158105.
- Park et al. (2015) J.-A. Park, J. H. Kim, D. Bi, J. A. Mitchel, N. T. Qazvini, K. Tantisira, C. Y. Park, M. McGill, S.-H. Kim, B. Gweon et al., Nat. Mater., 2015, 14, 1040–1048.
- Farhadifar et al. (2007) R. Farhadifar, J.-C. Röper, B. Aigouy, S. Eaton and F. Jülicher, Curr. Biol., 2007, 17, 2095–2104.
- Farge (2003) E. Farge, Curr. Biol., 2003, 13, 1365–1377.
- Fernandez-Gonzalez et al. (2009) R. Fernandez-Gonzalez, S. d. M. Simoes, J.-C. Röper, S. Eaton and J. A. Zallen, Dev. Cell, 2009, 17, 736–43.