Enhanced UV light detection using a p-terphenyl wavelength shifter
Abstract
UV-glass photomultiplier tubes (PMTs) have poor photon detection efficiency for wavelengths below due to the opaqueness of the window material. Costly quartz PMTs could be used to enhance the efficiency below . A less expensive solution that dramatically improves this efficiency is the application of a thin film of a p-terphenyl (PT) wavelength shifter on UV-glass PMTs. This improvement was quantified for Photonis XP4500B PMTs for wavelengths between and . The gain factor ranges up to 5.4 0.5 at a wavelength of , with a material load of (). The wavelength shifter was found to be fully transparent for wavelengths greater than . The resulting gain in detection efficiency, when used in a typical C̆erenkov counter, was estimated to be of the order of 40%. Consistent coating quality was assured by a rapid gain testing procedure using narrow-band UV LEDs. Based on these results, 200 Photonis XP4500B PMTs were treated with PT for the upgraded low-threshold C̆erenkov counter (LTCC) to be used in the CEBAF Large Acceptance Spectrometer upgraded detector (CLAS12) at the Thomas Jefferson National Accelerator Facility.
1 Introduction
During the 6 GeV maximum electron beam energy era of Jefferson Lab, a C̆erenkov Counter [1] (CC) has been used in several experiments in Hall B for electron/pion discrimination as part of the CLAS detector data acquisition trigger and particle identification systems. The CC has been refurbished to be used as a LTCC for pion/kaon discrimination in the new detector [2] for the upgrade of Jefferson Lab. Pions in the momentum region of interest produce significantly less C̆erenkov photons compared to electrons. Hence, a significant increase in the light-collection efficiency was essential in the CC upgrade.
The number density of C̆erenkov photons with a wavelength for a particle with velocity and charge passing through a unit of length of a radiator can be written as [3],
| (1) |
with the fine structure constant and the C̆erenkov cone half-angle . Due to the dependence of this distribution, a good sensitivity to photons in the UV region is required in order to maximize the efficiency of a C̆erenkov detector.
The detector efficiency for a C̆erenkov counter is proportional to the transparency of the C̆erenkov medium , the reflectivity of the mirrors and the quantum efficiency (QE) of the photomultipliers (PMTs), defined as the ratio of the number of photoelectrons emitted by the photocathode to the number of photons incident on the window, ,
| (2) |
For a typical C̆erenkov detector, the medium stops being transparent for light below to below , depending on the medium used, while mirror reflectivity commonly drops off below approximately . For PMTs with photocathodes of the bialkali family, the limiting factor of enhanced QE in the UV region is the transparency of the window material [4]. Borosilicate windows can be used to detect wavelengths as low as approximately , UV-glass windows down to , and only quartz windows can efficiently detect light down to .
While quartz windows maximize the UV-sensitivity of the PMT, and therefore the C̆erenkov detector performance, they are difficult and expensive to produce. In fact, most newer types of PMTs are only available with borosilicate and UV-glass windows111For example the H8500, H10966 and H12700 generations of multi-anode PMTs produced by Hamamatsu are only available with borosilicate and UV-glass windows..
A wavelength shifter (WLS) deposited on the face of a borosilicate or UV glass PMT provides an effective alternative to boost the efficiency of a C̆erenkov detector by converting UV photons with a wavelength below into two isotropically emitted photons with longer wavelengths. Additional requirements for a WLS material are a short decay time, a high transparency to its own emitted wavelength as well as longer wavelengths, and stability against evaporation and aging. Examples of such WLS materials include p-terphenyl (PT), p-quaterphenyl (PQ), tetraphenyl-butadiene (TPB) and diphenylstilbene (DPS) [5, 6, 7, 8]. PT in particular has been shown to provide the highest gain in photodetection efficiency for PMTs of the bialkali family as its emission spectrum matches the region of peak performance of the bialkali photocathode while having a short decay time near [6, 9, 10, 11, 12, 8].
2 The CLAS C̆erenkov Counter upgrade
Application of a WLS coating on UV-glass PMTs can enable a refurbished C̆erenkov detector to hit key performance goals in a more demanding experimental environment compared with the original detector. In fact, this was crucial for the upgrade of the CLAS CC to be used as the CLAS12 LTCC.
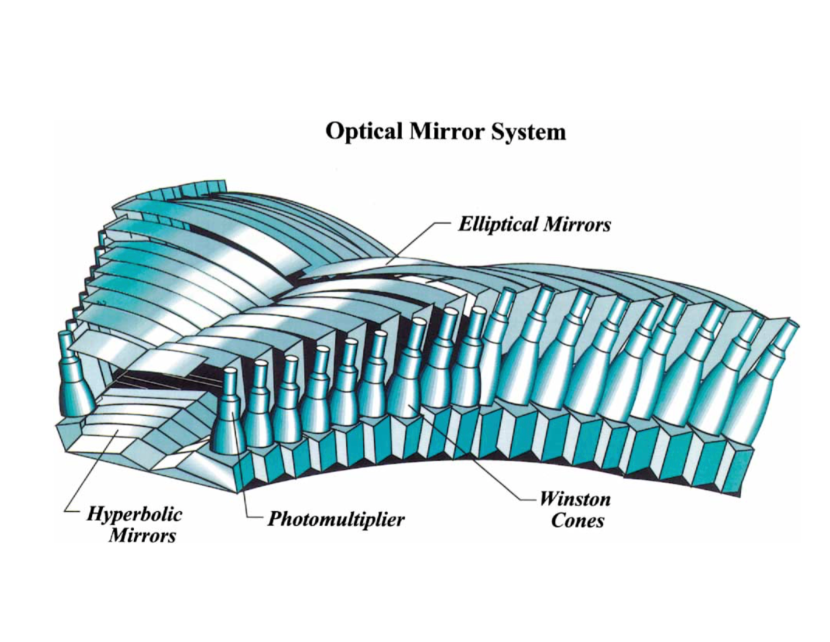
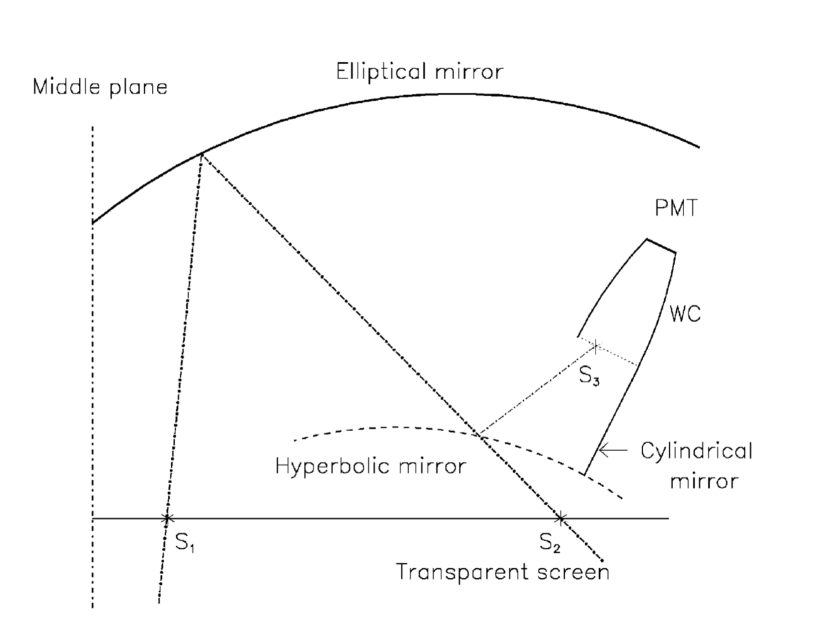
The CC consists of six sectors, each equipped with 36 elliptical and 36 hyperbolic mirrors focusing the C̆erenkov light onto 36 PMTs, as shown in Fig. 1. The sectors are filled with gas, with a refraction index of . Electrons cross through approximately of gas, while the produced C̆erenkov photons undergo between 3 and 4 bounces before they reach the PMT face. The average resulting light yield at the PMT face in the original CC was observed to be 20 photons. Without WLS, a small fraction of these photons are detected due to a poor PMT efficiency for UV light.
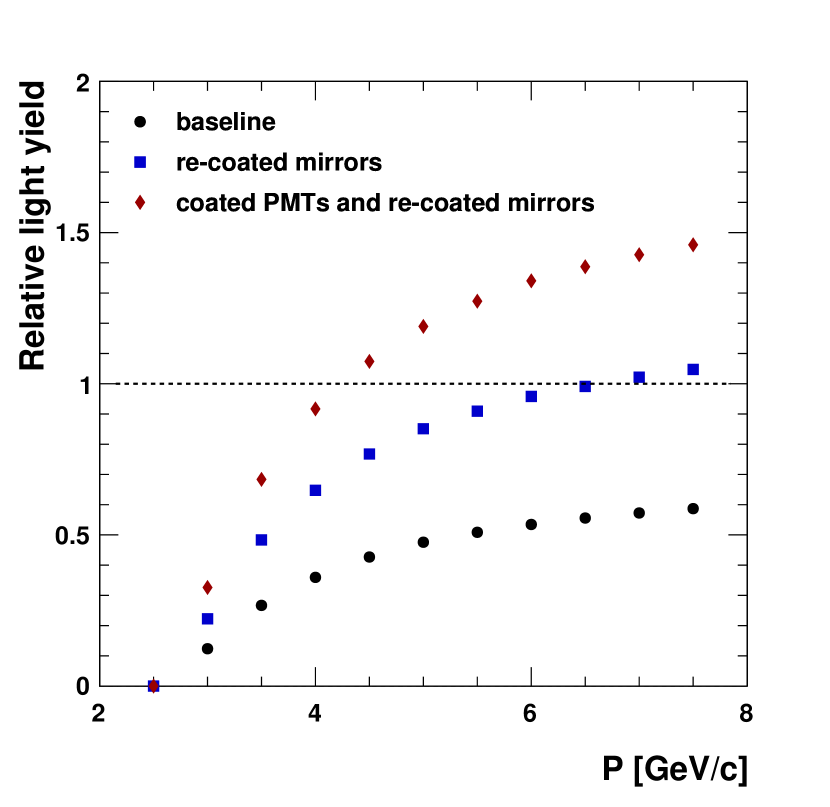
The pion C̆erenkov threshold in is , while the kaon threshold is . Hence, after a track is found not to be an electron or proton by the rest of the particle-identification system in CLAS12, it can be further identified as either a pion or kaon by the LTCC. To perform this pion/kaon separation function with a good efficiency, it is crucial that pions generate a sufficient number of C̆erenkov photons. It was found that pions in the momentum region of interest produce less than half the number of C̆erenkov photons compared to electrons, and the detector efficiency drops rapidly with a decreasing number of C̆erenkov photons. In order to maximize the LTCC light yield, the CC gas volume has been increased by , the mirror and Winston cone system has been refurbished with an improved reflective coating222The elliptical and hyperbolic mirrors were covered with aluminized Lexan strips, and the cylindrical mirrors and Winston cones were re-coated with by Evaporated Coating Inc. (ECI)., and the PMTs have been coated with a PT wavelength shifter. The results of this detector upgrade are shown in Fig. 2. The PT coating is necessary to ensure a pion light yield in the LTCC that is comparable (or better) then the original electron light yield in the CC. This increased light yield is required in order to reliably separate pions from kaons with the LTCC.
3 Wavelength Shifter Thickness
The ideal thickness of the PT film is determined by the minimum thickness required to ensure a good absorption in the WLS. Thicker layers will lead to a decline in optical transparency above the absorption region, as well as an increase in background due to scintillations excited directly by stray fast particles [6]. The ideal minimum thickness can be estimated by calculating the expected QE after application of the wavelength shifter film with thickness ,
| (3) |
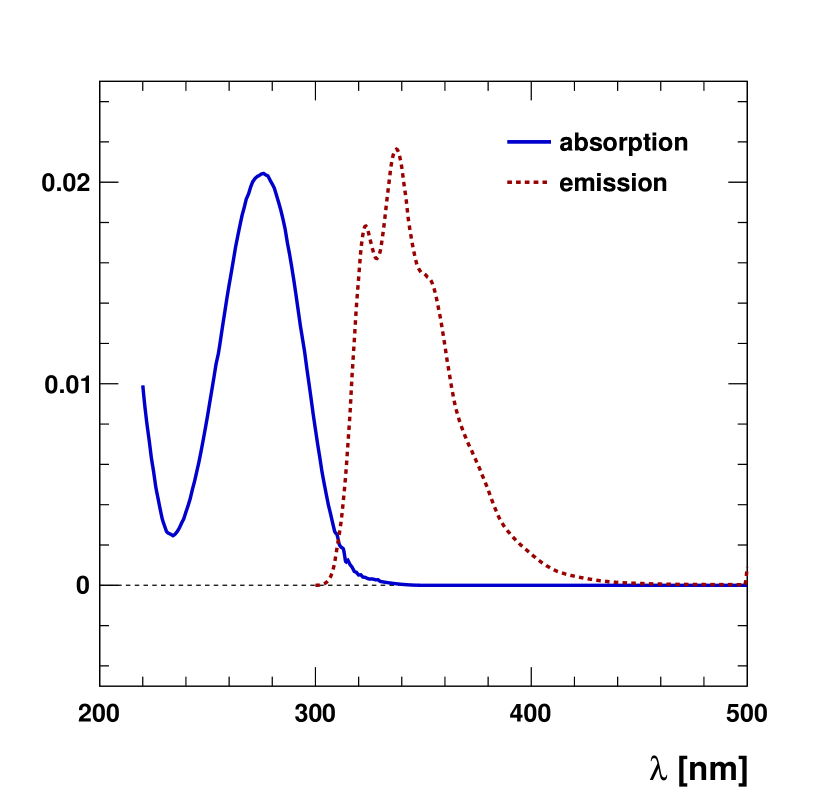
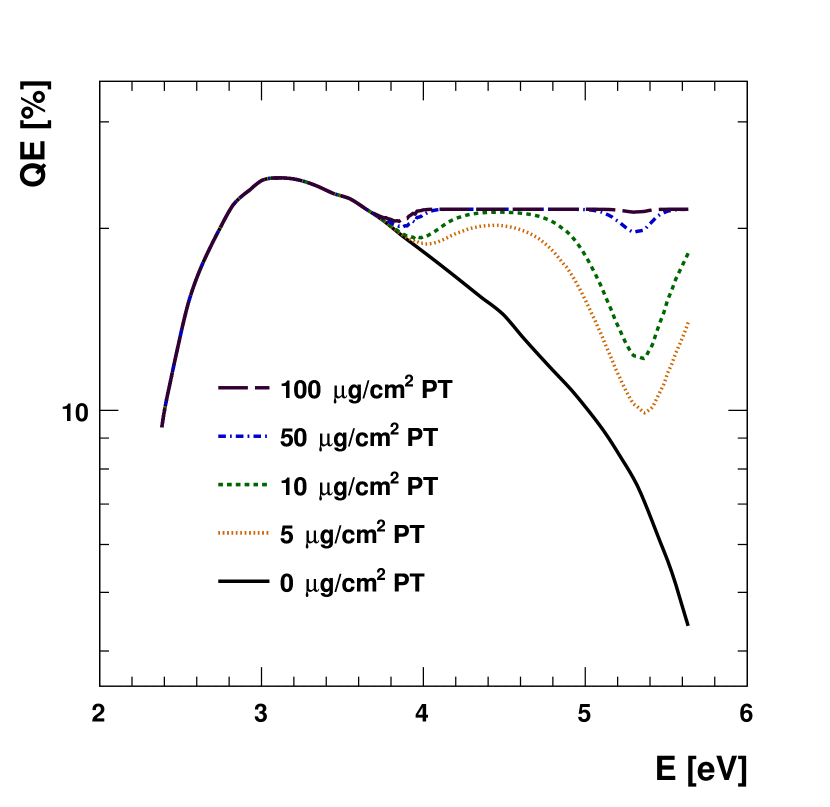
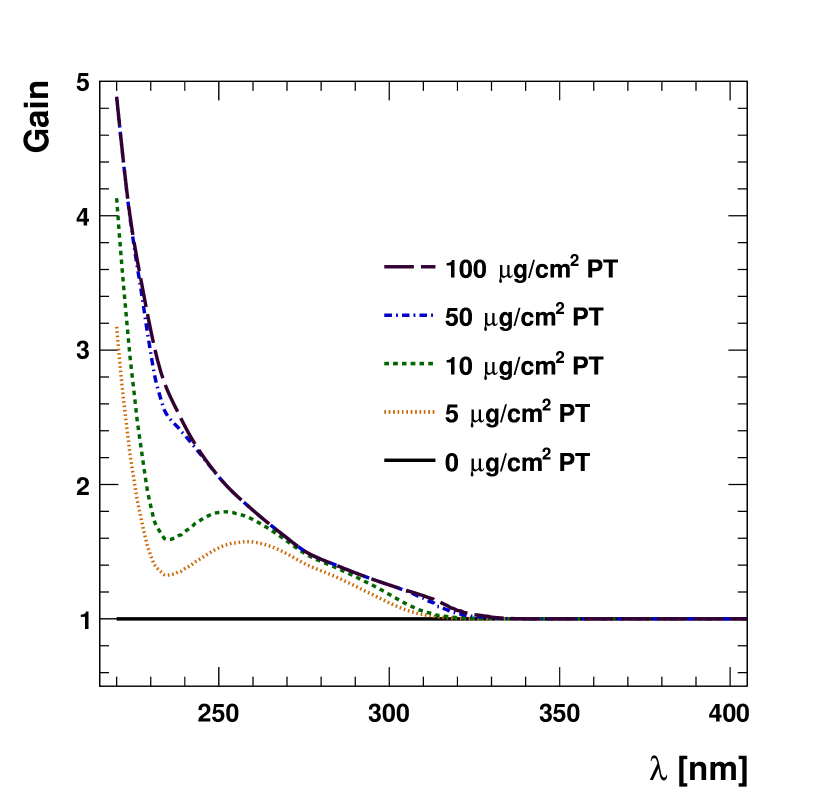
with the probability to absorb a photon with wavelength in a WLS with thickness and the distribution of emitted photons incident on the PMT window, and the QE of the WLS. In this paper, we consider the UV-glass Photonis XP4500B PMT, using the QE data from [4], PT absorption and emission data from [13] (shown in Fig. 3, a density of 1.23 and a molecular weight of 230.30376 g/mol. The results are shown in Fig. 4 and a nominal prediction of the gain () in Fig. 5. The absorption is starting to saturate at a material load of 50 , and around 100 a near-optimal level of saturation is reached. The potential increase in gain for higher material loads is minimal. The WLS optical transparency remains very good up to , resulting in a wide plateau region between - [6, 9, 8]. Due to this wide plateau region, the impact of small fluctuation in coating thickness is negligible.
4 Coating Procedure
PT deposition has been accomplished in the past through vacuum evaporation [6, 9, 8] or alternatively by means of a solution with a plastic binder in an organic solvent [10, 11, 12], both with varying degrees of success.
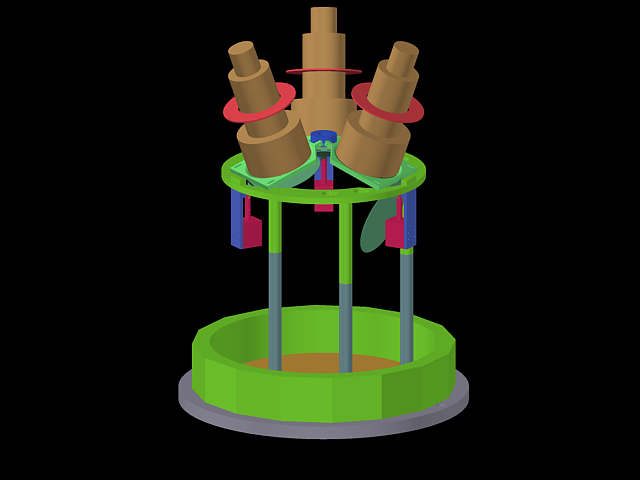
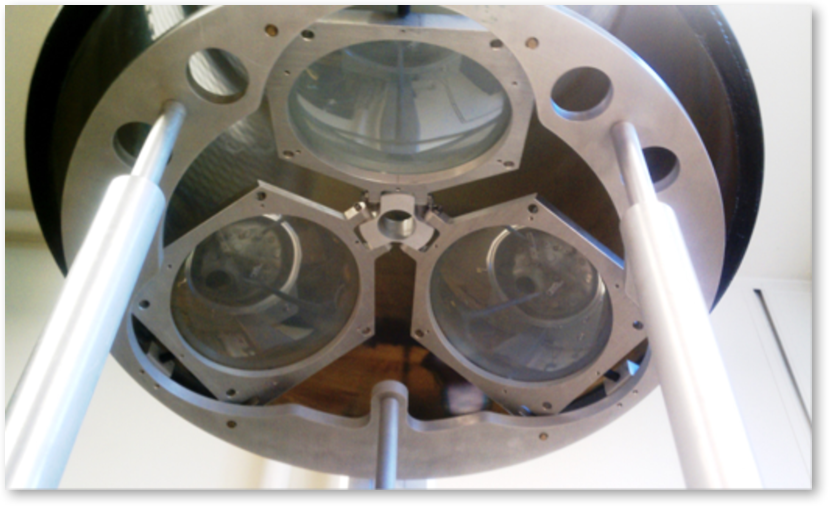
For this work, the PT WLS333p-Terphenyl powder with 99+% purity. was deposited directly on the UV-glass window of the Photonis XP4500B PMTs in a vacuum evaporator, which allows for the coating thickness to be precisely controlled. The setup is capable of coating three 5-inch PMTs simultaneously, as illustrated in Fig. 6.
4.1 Cleaning the PMT
To obtain a homogeneous coated PMT it is crucial that all impurities are removed from the PMT surface prior to coating. To accomplish this the PMT face is cleaned off using isopropanol and then immediately dried with a blast of compressed dry air or nitrogen. This procedure is repeated 3 to 5 times as needed. If the PMT was previously coated, this coating is first carefully removed with 3 to 5 cleaning cycles with acetone.
4.2 Evacuation phase
Three PMTs can be simultaneously loaded into the vacuum evaporator (see Fig. 6 top, bottom). The PT powder is loaded into a modified resistive heated boat at the center of the base of the evaporator. This boat is covered with a 200 mesh screen to prevent the PT powder from spilling. The air is evacuated using a mechanical pump and a turbo pump. The chamber is ready for deposition once vacuum reaches an absolute pressure of . This evacuation phase takes approximately 12 hours in our evaporator.
4.3 PT deposition
The boat is heated using a DC current of approximately for a temperature of , initiating the sublimation of the PT powder. A water-cooled quartz deposition monitor, mounted at the same radial distance from the boat as the PMT face, continuously measures the evaporation rate. The precise current is controlled to ensure a deposition rate of . The PMTs remain shuttered for approximately 6 minutes, until this target evaporation rate has been reached. Once evaporation conditions are optimal, the shutters are opened exposing the PMT faces to the evaporant. When the target thickness is reached, the shutters are closed and the power to the boat is shut off.
4.4 Material load calibration
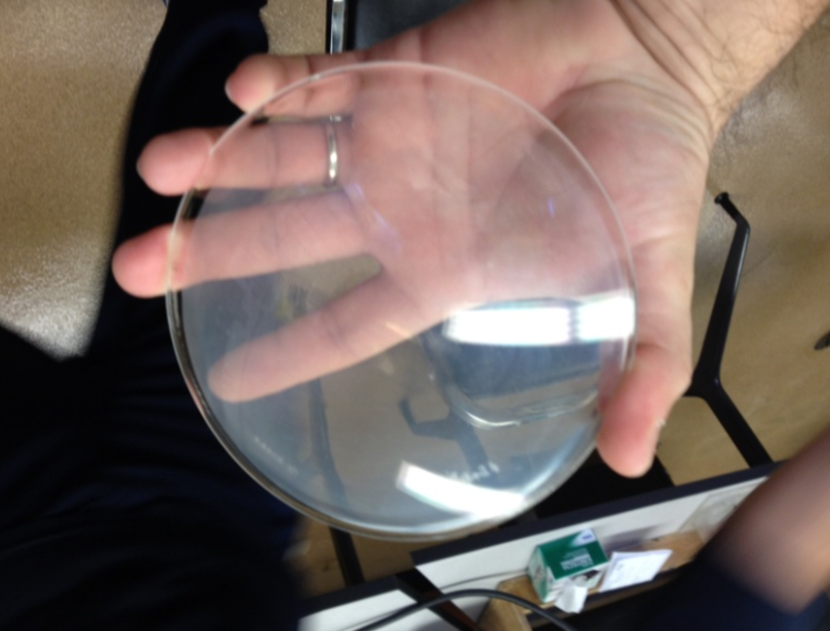
To precisely calibrate the material load on the PMT face, a series of evaporations was performed on a thin glass surface (”watch glass”) with an identical radius and curvature as the Photonis XP4500B PMT face. By weighing the before and after deposition, the exact material load on the PMT face could be linked to the amount of PMT powder in the evaporation boat. It was found that, for our setup, an optimal material load of () is obtained with of PT.
5 Wavelength Dependent Gain Measurement
The wavelength dependent gain in PMT efficiency was measured using a monochromator (Newport model CS260-USB-1-FH-A) with a deuterium light source with a reach between and . The sections below discuss the exact experimental setup as well as the measured results.
5.1 Experimental setup
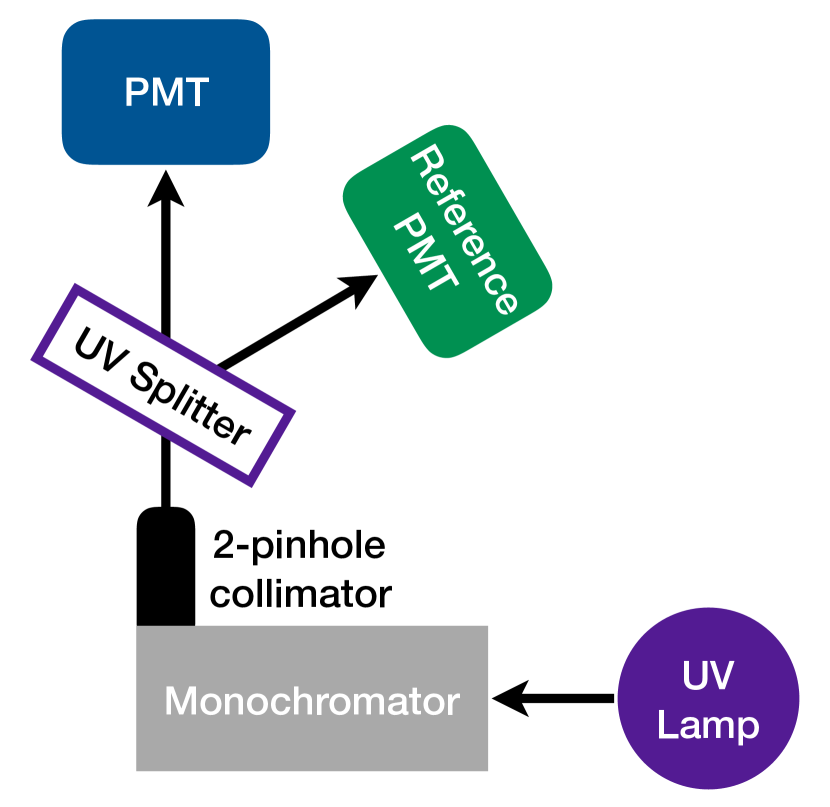
The deuterium light source fully covers the spectrum between and . The wavelength can be selected by the monochromator with a precision of [14]. The light beam of the selected wavelength is collimated using two pinholes. The beam is then split with a UV Grade fused silica beam splitter in two separate beams, as shown in Fig. 7. Each light beam illuminates the face of a single PMT: the PMT to be tested, and a calibration PMT. The beam at the face of the PMT consists of single photons at a rate of to depending on the wavelength. Note that the monochromator is not placed in a vacuum, and therefore shorter wavelengths (close to ) undergo losses due to absorption by the air.
The observed photon rate was read out by a scaler with a threshold. Each PMT was measured while coated and then again after the coating had been removed using acetone and isopropanol. The measurement was performed on two separate PMTs. For each PMT, the measurement was performed in the standard configuration and in a configuration where the calibration PMT and the test PMT position were switched. In all cases, the calibration PMT rates were found to be stable between measurements.
The background was determined by an additional measurement with the light source switched off. This background rate is subtracted from the observed rate.
5.2 Monochromator Results
The results from 2 different PMTs each at 2 different positions were found to be consistent. Fig. 8 shows the average measured gain from these four measurements. The observed gain was found to be consistent with the nominal prediction for a perfectly saturated coating. Note that these results do not show any signs of a decline in WLS gain below , in contrast with the previous results from Refs. [10, 12], consistent with the more recent results from Ref. [8].
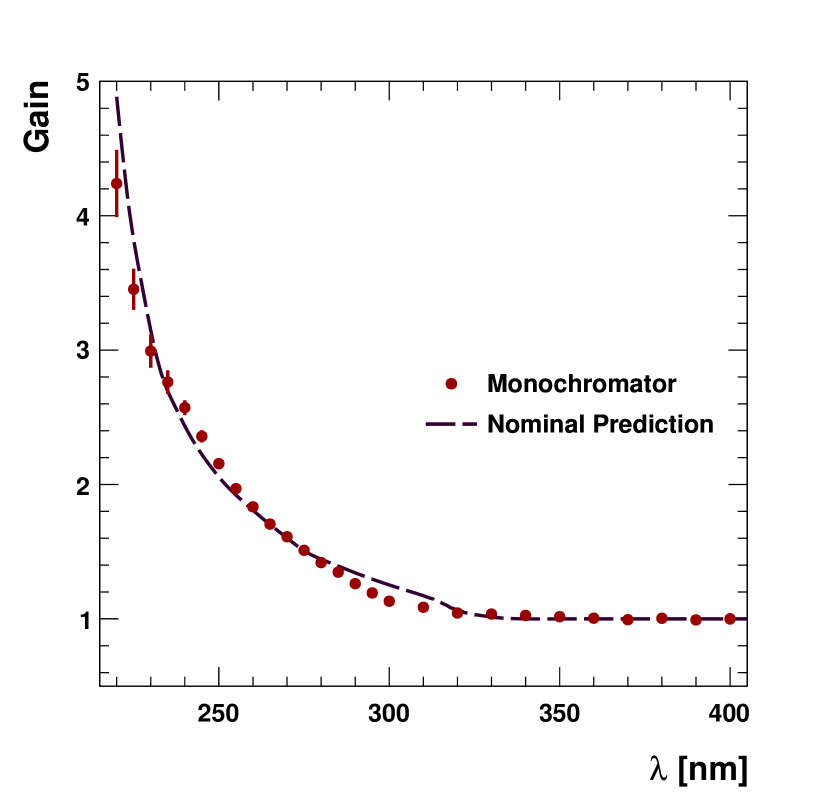
For a typical light-gas C̆erenkov detector, this gain in PMT efficiency corresponds to an increase of approximately 40% in total detector efficiency.
6 Rapid Quality Assurance with UV LEDs
The monochromator test procedure is too time-consuming to perform on all 200 PMTs for the CLAS12 LTCC. For this reason, we implemented a rapid quality assurance (QA) procedure using two UVTOP LEDs444Produced by Sensor Electronic Technology, Inc. (SETi) to ensure consistent results. The QA testing can be performed with up to 3 PMTs simultaneously.
6.1 Procedure
The procedure consists of three steps: gain matching, baseline test, and assessment of the improved response.
To select the proper high-voltage settings for the PMTs, they were gain-matched using the single photo-electron (SPE) spectrum, extracted from the dark current when self-triggering on . This step was also used to identify bad-performing PMTs.
For the next two steps, we used two UVTOP LEDs, at (UVTOP260) and (UVTOP285), both with a line width of . Driven by an Agilent 33522A Function/Arbitrary Waveform Generator, they emit short sub-nanosecond bursts of light. An average burst contains approximately 100 photons. The PMTs are read out by a CAEN V1729A flash ADC (FADC) triggered by the function generator. The average number of photons converted in the photocathode can be estimated by fitting the integrated ADC spectrum with a Gaussian ansatz [15],
| (4) |
with and the mean and with of the Gaussian.
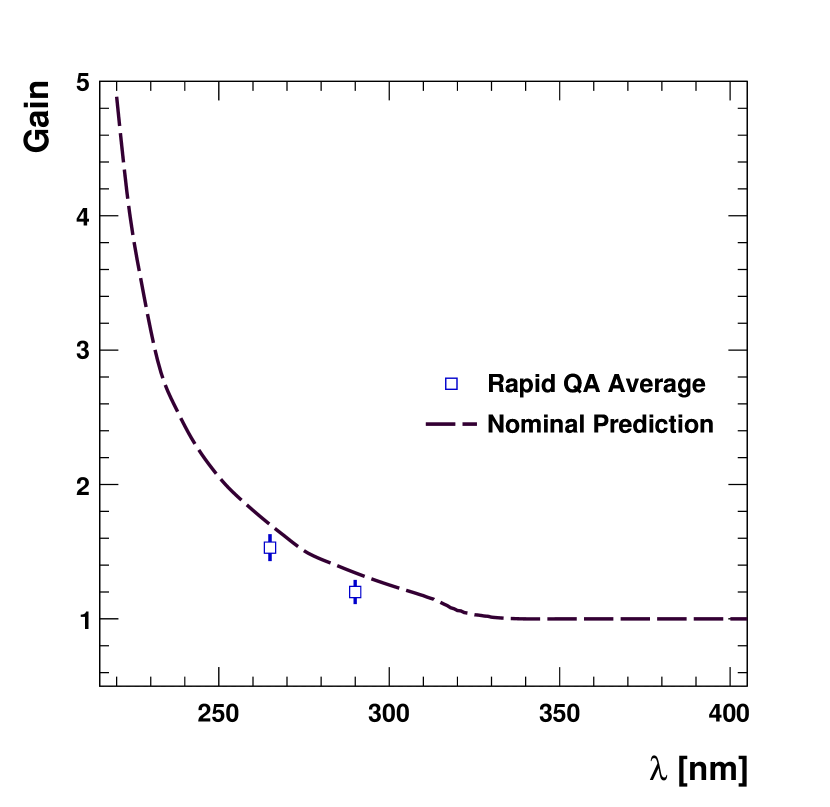
This procedure is repeated after the PMT face has been coated. To control for potential variations in measurement conditions before and after coating, we use a Photonis XP4318B 3-inch PMT with a quartz entrance window as a fourth calibration PMT. The average measured gain from the 200 XP4500B PMTs coated for the CLAS12 LTCC is shown in Fig. 9 and compared to the nominal prediction for a perfectly saturated coating. The uncertainty on the points is given by the standard deviation of the individual measurements and a 2% fit uncertainty added in quadrature. The coating procedure was found to reliably improve the QE of each individual PMT close to the idealized nominal prediction with minimal deviations from the average.
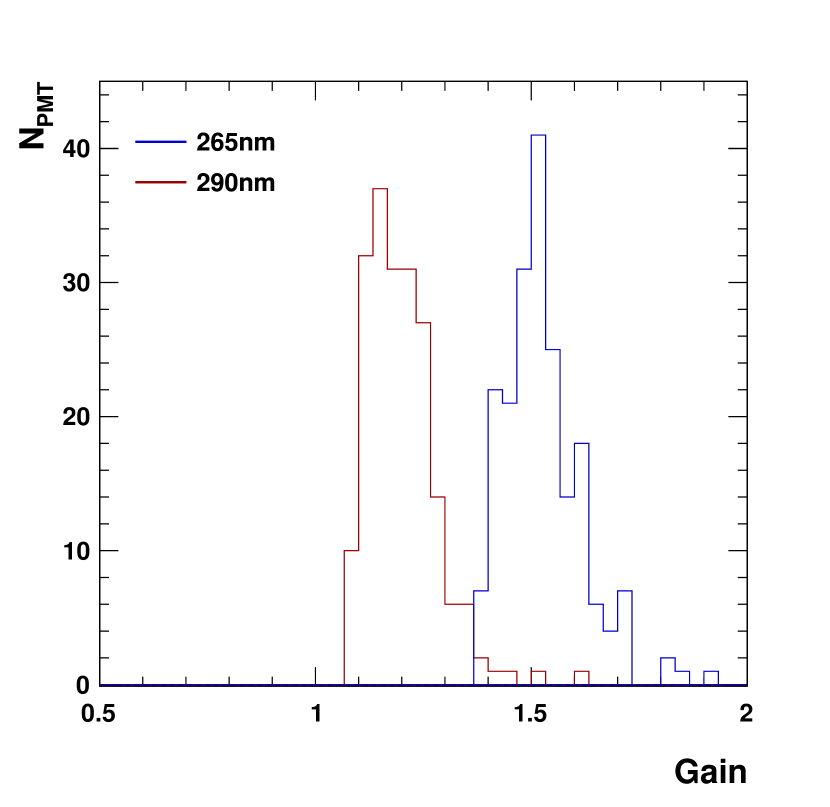
The full spread of the measured gains for all 200 coated XP4500B PMTs is shown in Fig. 10. The histograms are slightly asymmetric with a heavy right tail, as the QA procedure rejected coated PMTs that showed insufficient improvement.
The QA procedure was instrumental in the optimization of the cleaning procedure of the PMT face before the vacuum evaporation. Once the this cleaning procedure was fully established, the rejection rate was 5%. The rejected PMTs were subsequently carefully cleaned and re-coated, after which they passed the QA testing.
6.2 Pulse shape and timing
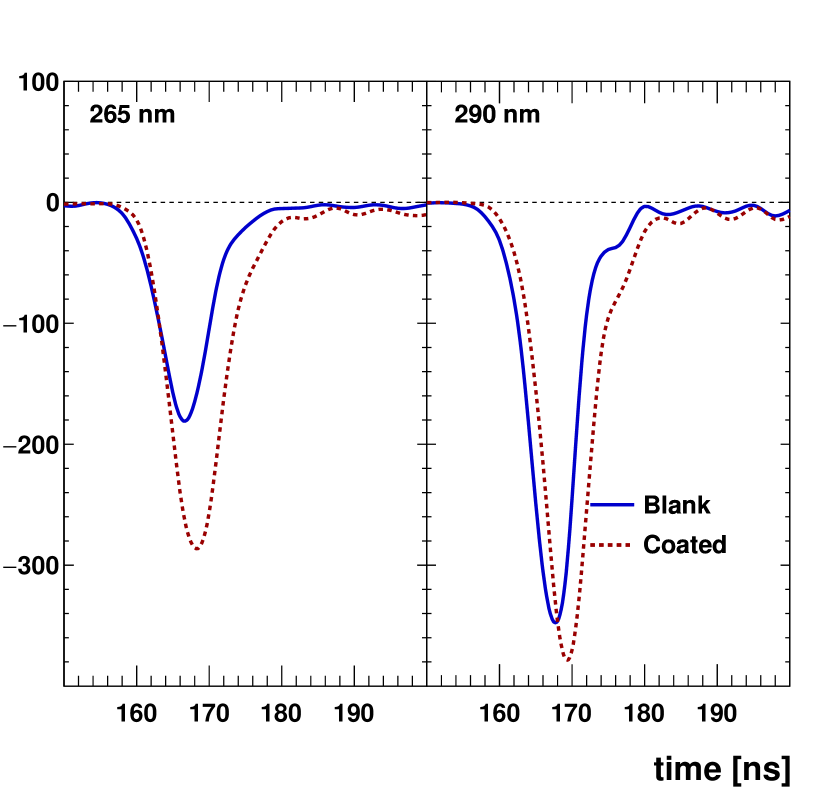
The rapid QA setup was used to study the impact of the PT coating on the PMT pulse shape and timing. The function generator provides a consistent trigger when comparing PMTs before and after coating, while the CAEN V1729A FADC has a timing resolution of . Fig. 11 shows a comparison of the measured average pulse before and after coating. After coating, the pulse is unchanged except for an increase in amplitude due to the higher PMT efficiency and a delay of . This observed delay is consistent with an earlier measurement of the PT lifetime [6].
7 Summary
Application of a p-terphenyl wavelength shifter to the window of a UV-glass PMT through vacuum evaporation was found to dramatically improve the photon detection efficiency for wavelengths below . The wavelength dependent gain for Photons XP4500B PMTs was precisely measured using a monochromator.
The ideal material load was found to be with a gain factor of 5.4 0.5 at a wavelength of . Smaller material loads are not fully saturated while larger material loads are more prone to a lower optical transparency due to crystallisation of the PT.
200 Photonis XP4500B PMTs were treated for the CLAS12 LTCC. Each PMT was tested using a rapid QA procedure using two narrow-band UVTOP LEDs. The coated PMTs will provide a 40% increase in detector efficiency.
This work is supported in part by the U.S. Department of Energy Grant Award DE-FG02-94ER4084.
References
- Adams and others [2001] G. Adams and others. The CLAS Cerenkov Detector. Nucl. Inst. and Meth. A 465:465, 2001.
- Collaboration [2008] The CLAS12 Collaboration. CLAS12 Technical Design Report. Technical report, JLab, Newport News, Virginia, July 2008. URL https://www.jlab.org/Hall-B/clas12_tdr.pdf.
- Leo [1987] W. R. Leo. Techniques for Nuclear and Particle Physics Experiments: A How to Approach. 1987.
- Photonis [2007] Photonis. Photomultiplier Tubes Catalogue, January 2007.
- Mai and Drouin [1971] T T H Mai and R Drouin. Relative Quantum Efficiencies of Some Ultraviolet Scintillators. Appl. Opt., 10(1):207–208, Jan 1971. doi: 10.1364/AO.10.0207˙1. URL http://ao.osa.org/abstract.cfm?URI=ao-10-1-207_1.
- Garwin et al. [1973] E L Garwin, Y Tomkiewicz, and D Trines. Method for elimination of quartz-face phototubes in Cherenkov counters by use of wavelength-shifter. Nuclear Instruments and Methods, 107(2):365–370, March 1973.
- Alves et al. [1974] M A F Alves, M C M Dos Santos, and A J P L Policarpo. Wavelength shifters for xenon proportional scintillation counters. Nuclear Instruments and Methods, 119:405–406, July 1974.
- Koczon et al. [2010] P Koczon, A Braem, C Joram, P Solevi, M Dürr, and C Höhne. Wavelength-shifting materials for the use in RICH detectors - p-terphenyl and tetraphenyl-butadiene revisited. Technical Report PH-EP-Tech-Note-2012-003, CERN, Geneva, Mar 2010. URL https://cds.cern.ch/record/1457653.
- Baillon et al. [1975] P Baillon, Y Déclais, M Ferro-Luzzi, B French, P Jenni, J M Perreau, J Séguinot, and T Ypsilantis. Ultraviolet Cherenkov light detector. Nuclear Instruments and Methods, 126(1):13–23, May 1975.
- Eigen and Lorenz [1979] G Eigen and E Lorenz. A method of coating photomultipliers with wavelength shifters. Nuclear Instruments and Methods, 166(2):165–168, November 1979.
- Grande and Moss [1983] Manuel Grande and Gary R Moss. An optimised thin film wavelength shifting coating for Cherenkov detection. Nuclear Instruments and Methods in Physics Research, 215(3):539–548, 1983.
- Gorin et al. [1986] A M Gorin, G D Kakauridze, A I Peresypkin, V A Polyakov, V I Rykalin, and E G Tzhadadze. On the increase of ultraviolet radiation detection efficiency in nuclear particle detectors with the help of transparent wavelength shifter films. Nuclear Inst. and Methods in Physics Research, A, 251(3):461–468, November 1986.
- Dixon et al. [2005] James M Dixon, Masahiko Taniguchi, and Jonathan S Lindsey. PhotochemCAD 2: A Refined Program with Accompanying Spectral Databases for Photochemical Calculations. Photochemistry and Photobiology, 81(1):212–213, January 2005.
- Newport [2010] Newport. Monochromator, UV-VIS High Resolution, USB Interface, Fixed Slits, January 2010.
- Bellamy et al. [1994] E H Bellamy, G Bellettini, F Gervelli, M Incagli, D Lucchesi, and others. Absolute calibration and monitoring of a spectrometric channel using a photomultiplier. Nucl.Instrum.Meth., A339:468–476, 1994.