Compositional phase stability of strongly correlated electron materials within DFT+
Abstract
Predicting the compositional phase stability of strongly correlated electron materials is an outstanding challenge in condensed matter physics. In this work, we employ the density functional theory plus (DFT+) formalism to address the effects of local correlations due to transition metal electrons on compositional phase stability in the prototype phase stable and separating materials LixCoO2 and olivine LixFePO4, respectively. We exploit a new spectral decomposition of the DFT+ total energy, revealing the distinct roles of the filling and ordering of the orbital correlated subspace. The on-site interaction drives both of these very different materials systems towards phase separation, stemming from enhanced ordering of the orbital occupancies in the and species, whereas changes in the overall filling of the shell contribute negligibly. We show that DFT+ formation energies are qualitatively consistent with experiments for phase stable LixCoO2, phase separating LixFePO4, and phase stable LixCoPO4. However, we find that charge ordering plays a critical role in the energetics at intermediate , strongly dampening the tendency for the Hubbard to drive phase separation. Most relevantly, the phase stability of Li1/2CoO2 within DFT+ is qualitatively incorrect without allowing charge ordering, which is problematic given that neither charge ordering nor the band gap that it induces are observed in experiment. We demonstrate that charge ordering arises from the correlated subspace interaction energy as opposed to the double counting. Additionally, we predict the Li order-disorder transition temperature for Li1/2CoO2, demonstrating that the unphysical charge ordering within DFT+ renders the method problematic, often producing unrealistically large results. Our findings motivate the need for other advanced techniques, such as DFT plus dynamical mean-field theory, for total energies in strongly correlated materials.
pacs:
71.15.Mb, 71.27.+a, 81.30.Bx, 82.47.AaI Introduction
Strongly correlated materials (SCMs), in which density functional theory (DFT)Hohenberg and Kohn (1964); Kohn and Sham (1965) calculations break down for selected observables due to strong electron-electron interactions, are at the forefront of condensed matter physics.Kotliar and Vollhardt (2004); Morosan et al. (2012) Phenomenologically, SCMs exist in a ground state which is in the vicinity of a Mott transition Mott (1968); Imada et al. (1998) whereby electronic hopping may be overwhelmed by local interactions, resulting in an insulating state. Realizations of SCMs often contain atoms with open-shell or electrons, such as the high-temperature superconducting cupratesBednorz and Müller (1986), colossal magnetoresistance manganitesRamirez (1997), and heavy fermion actinide based materials.Coleman (2007)
Predicting the properties of strongly correlated materials is an outstanding problem in solid state physics. The standard approach of DFT, which is the most generic theory of electronic structure for materials physics, is in principle an exact theory for the ground state energy and electron density of any many-electron system. However, the exact exchange-correlation functional is unknown and must be approximated; and in practice DFT is often unable to capture critical aspects of the physics of strongly correlated materials.Jones and Gunnarsson (1989); Jones (2015); Kotliar and Vollhardt (2004) The difficulty of constructing increasingly intelligent exchange-correlation density functionals led to pursuit of additional variables that could be more easily approximated; one such variable is the local Green function for a set of correlated orbitals in the material (e.g orbitals)Kotliar et al. (2006). A corresponding approximation for this density plus local Green functional theory leads to DFT plus dynamical mean-field theory (DFT+DMFT). A further Hartree approximation to the DMFT impurity problem leads to the more ubiquitous DFT+ approach, which can be counterintuitive given that the latter preceded the former historicallyAnisimov et al. (1997); Kotliar et al. (2006). The long-term goal of these techniques is their application in an unbiased manner to any material containing localized orbitals, nominally or otherwise. Compositional phase stability is a particular stringent test since it relies on total energies from multiple compositions, making it more difficult to cancel errors by varying the few still maturing aspects of the formalism.
One of many important contexts highlighting the need for accurate total energy methods for strongly correlated materials is that of doped transition metal oxides, which include doped Mott insulators. From a technological perspective, Li-based transition metal oxides form the basis of rechargeable battery cathodes. Such cathodes typically employ transition metals and oxygen or oxygen-containing anion groups and, since they have open electron shells, are susceptible to strong correlation physics. One fundamental characteristic of a cathode material is whether there is a stable solid solution for intermediate Li concentration (), as dictated by the formation energy of the compound. The formation energy has a strong impact on the charge/discharge mechanism and also has implications for the voltage and capacity of the battery.
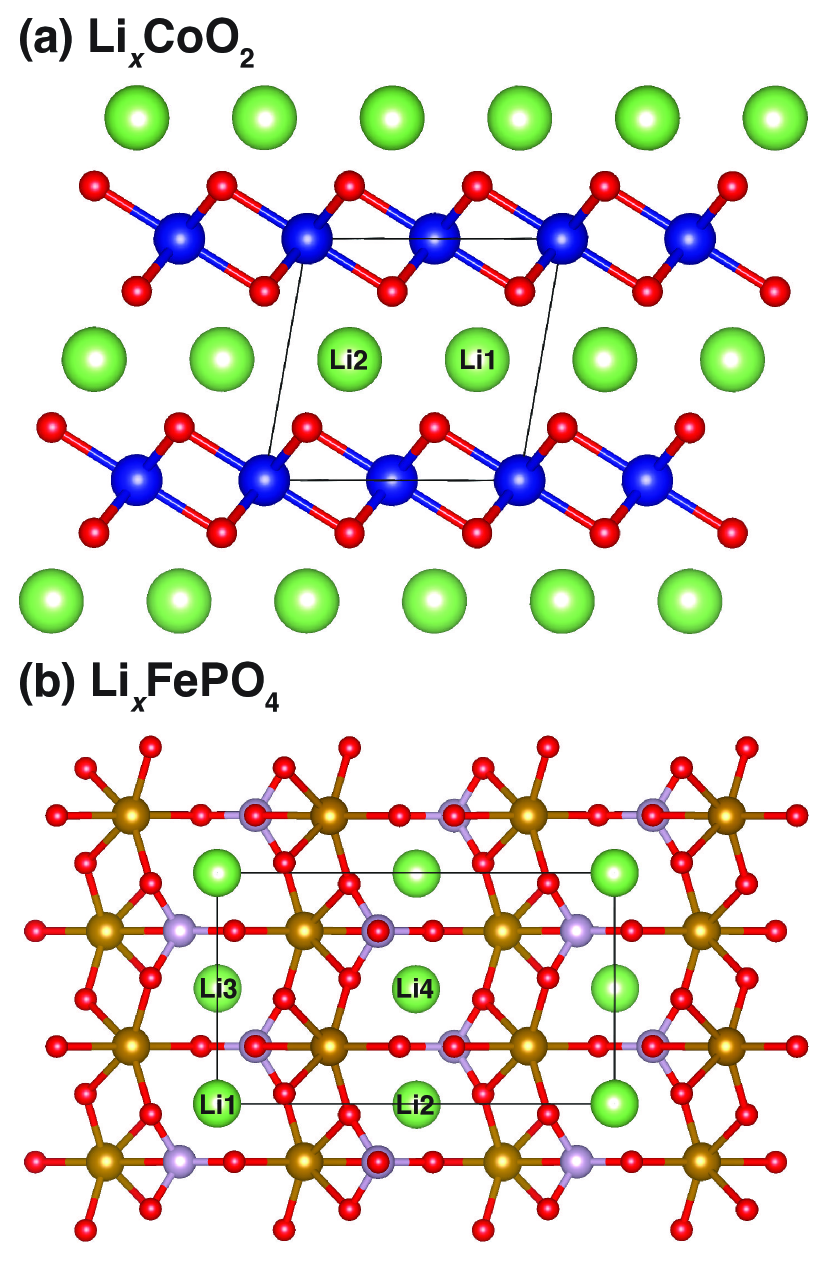
Many of the current cathode materials utilized today are based on the material LixCoO2, shown in Fig. 1(a) for , which can store Li ions in between its CoO2 layers.Mizushima et al. (1980) LixCoO2 has several stable intermediate phases.Reimers and Dahn (1992); Van der Ven et al. (1998); Wolverton and Zunger (1998) In contrast, olivine LixFePO4 Padhi et al. (1997a, b) [see Fig. 1(b)] does not have any stable compounds for intermediate . It instead exhibits phase separation into its fully lithiated () and fully delithiated () endmembers, which may contribute to slow charge/discharge kinetics. Padhi et al. (1997a); Delacourt et al. (2005); Dodd et al. (2006)
Previous work demonstrates that DFT predicts very stable compounds of intermediate in LixFePO4, in stark disagreement with experiment.Zhou et al. (2004a) This is a flagrant failure of the DFT method. In contrast, DFT does properly capture the phase stability of LixCoO2.Van der Ven et al. (1998); Wolverton and Zunger (1998) A beyond-DFT approach combining DFT and Hartree-Fock exchange, called a hybrid functional, also fails to capture the total phase separation in LixFePO4.Ong et al. (2011) DFT+ calculations, which include an explicit on-site Coulomb interaction for the transition metal electrons, were found to predict phase separation in LixFePO4 for sufficiently high values of .Zhou et al. (2004a) In later work, a cluster expansion based on such DFT+ energetics rationalized this phase separation in terms of strong Li–electron interactions.Zhou et al. (2006) A lingering question, which we will address in this work, is whether DFT+ can be applied to LixCoO2 Andriyevsky et al. (2014); Aykol and Wolverton (2014); Aykol et al. (2015); Seo et al. (2015) without degrading the already reasonable DFT results, such that DFT+ can give a robust description for both of these prototype phase stable and phase separating systems.
The DFT+ study for LixFePO4 claims that the instability of compounds of intermediate relates to energy penalties stemming from charge ordering (CO), a symmetry breaking in which the number of electrons on different transition metal sites differs.Zhou et al. (2004a) However, it is unclear if the CO is physical since static ordering is the only way in which a static mean-field theory like DFT+ can mimic strong electronic correlations. Furthermore, the phase separation in LixFePO4 is fundamentally puzzling since with reasonable parameters the canonical model Hamiltonians describing strong correlations such as the Hubbard and – models do not exhibit phase separation for extended regions of the phase diagram.Visscher (1974); Marder et al. (1990)
To explore such issues, in this work we employ extensive DFT+ calculations to understand in detail the impact of electronic correlations on phase stability in correlated intercalation materials. We focus on phase stable LixCoO2 and phase separating LixFePO4 and explicitly investigate the role of CO and structural relaxations. A new energy decomposition is elucidated to quantitatively analyze the impact of on the overall filling and on the ordering of orbitals within the shell. Comparison is made to the LixCoPO4 system, which is isostructural to LixFePO4 but does have a stable compound of intermediate . We also investigate another physical observable, the Li order-disorder transition temperature, for Li1/2CoO2 to provide another clear benchmark of DFT+ theory. The tendency for CO in DFT+, how it impacts these thermodynamic properties, and whether it is physical or not is investigated and discussed. A thorough understanding at the DFT+ level of theory is critical as we advance to more sophisticated methods for studying phase stability in strongly correlated materials.
For all the materials we have investigated, we find that destabilizes compositions at intermediate . This results because most strongly affects the endmembers by enhancing the deviations in the orbital occupancies from their average value; compounds of intermediate experience the same effect but are unable to orbitally polarize to the same extent, which directly drives them towards phase separation as increases. CO and structural relaxations serve to dampen, but not eliminate, this fundamental effect. However, CO leads to the formation of a band gap for Li1/2CoO2 that is not observed experimentally, suggesting it is an unphysical artifact of DFT+. Furthermore, CO leads to highly erratic estimations of the Li order-disorder transition temperature for Li1/2CoO2, demonstrating a serious shortcoming of the DFT+ method. Our calculations demonstrate that the interaction term rather than the double counting term in DFT+ is responsible for the CO, which suggests that more accurate approaches such as DFT plus dynamical mean-field theory (DFT+DMFT) may be necessary to accurately describe this class of materials.
The rest of this paper is organized as follows. Section II discusses the DFT+ approach to materials with strong electronic correlations and elucidates our new energy decomposition in this framework. Section III describes the computational details for the simulations performed in this work. The electronic structure of the endmembers of LixCoO2 and LixFePO4 within DFT are described in Sec. IV.1. The impact of on the electronic structure of LixCoO2 is discussed in Sec. IV.2. The origin of the tendency for CO in DFT+, taking LixCoO2 as an example, is the focus of Sec. IV.3. The impact of on the phase stability of LixCoO2 is discussed in Sec. IV.4. The electronic structure and phase stability of LixFePO4 within DFT+ are described in Sec. IV.5 and Sec. IV.6, respectively. Section IV.7 discusses the formation energy trends for LixCoPO4. Section IV.8 elucidates the role of the double counting on the formation energy trends. The average intercalation voltages for LixCoO2 and LixFePO4 are presented in Sec. IV.9. Section IV.10 focuses on the Li order-disorder transition temperature of Li1/2CoO2 and its dependence on CO. Finally, conclusions are presented in Sec. V.
II Methodology
II.1 DFT+ approach for correlated materials
The idea of DFT+Himmetoglu et al. (2014) is to provide an improved treatment of electronic correlations by using not only the density as a primary variable of the energy functional, but also the single-particle density matrix of a relevant set of local orbitals associated with strong correlations. This set of orbitals, which form the correlated subspace, are typically localized electronic states having or character and in practice are defined using Wannier functions or atomic orbitals labeled by ionic site and angular momentum projection .
Having defined the correlated subspace, one needs to construct an approximation for the energy as a functional of the density and the single-particle density matrix of the correlated subspace. This is typically approximated using two separate additive functionals:
| (1) |
where is the local single-particle density matrix for spin projection and is the usual Kohn-Sham DFT energy functional using one of the many possible approximations to the exchange-correlation energy such as the local density approximation (LDA)Ceperley and Alder (1980); Vosko et al. (1980); Perdew and Zunger (1981); Perdew and Wang (1992) or the generalized gradient approximation (GGA).Perdew et al. (1992, 1996) The functional of the density matrix , to be defined mathematically below, is given by the Hartree-Fock interaction energy based upon a set of screened interactions within the correlated subspace. There is a clear double counting (dc) problem with such a formulation, as the LDA or GGA already accounts for some interactions of the density arising from the correlated subspace, and therefore a double-counting energy must be defined and subtracted.
It is common to employ the spin-dependent formulation of DFT (SDFT) rather than pure DFT, in which case the total energy expression becomes
| (2) |
where is the density for spin projection . In the simplified rotationally-invariant formalism of Dudarev et al.Dudarev et al. (1998) the interaction term, which we always write in the diagonal eigenbasis of the density matrix, is
| (3) |
where is the th eigenvalue of and represents the screened on-site Coulomb energy between different spin-orbitals within the correlated subspace. This approach is equivalent to the full rotationally-invariant formalism by Liechtenstein et al.Liechtenstein et al. (1995) if the on-site exchange parameter is set to 0, which can be justified by previous work indicating that SDFT already contains an intrinsic .Chen et al. (2015); Park et al. (2015) The most commonly used dc is the fully-localized-limit (FLL) type
| (4) |
in which is the total correlated occupancy on a site. In this work we focus on materials in which states form the correlated subspace, so at times we refer to this quantity as (or if there is only a single site). This double counting energy is equal to in the limit in which all take on values of 0 or 1.
Using this dc form, the total energy expression can be rewritten as
| (5) |
This form illustrates that DFT+ penalizes fractional occupancy of the correlated orbitals and serves to restore the derivative discontinuity of the total energy with respect to total particle number that is missing in approximate DFT.Perdew et al. (1982); Anisimov et al. (1993); Himmetoglu et al. (2014); Cococcioni and de Gironcoli (2005)
It is important to emphasize the connection between DFT+ and DFT+DMFT to in order to appreciate the limitations of the DFT+ approach.Kotliar et al. (2006) DFT+DMFT corresponds to a functional of the density and the local Green function of the correlated orbitals, which contains the single-particle density matrix in addition to information about single-particle excitations. This functional is approximated using, in part, DMFT, which requires the solution of the DMFT impurity problem. Since the DMFT impurity problem itself is a difficult (though tractable) many-body problem, one approach is to make further approximations and solve the DMFT impurity problem within the Hartree-Fock approximation, which results in the DFT+ approach. Alternatively, it may be possible to exactly solve the DMFT impurity problem using quantum Monte Carlo (QMC) techniquesGull et al. (2011); Haule (2007), which can have a profound influence on the energetics as compared to DFT+Park et al. (2014a, b); Chen et al. (2015). In particular, the error associated with DFT+ was shown to strongly depend on the spin state of Fe in a spin crossover moleculeChen et al. (2015), which may suggest that DFT+ errors will strongly depend on Li concentration in cathode materials and therefore affect phase stability and battery voltages. The quality of DFT+DMFT (solved using QMC) is superior to DFT+ in every sense, but the former is far more computationally expensive and complex. This current study will give us a detailed understanding of how DFT+ performs in the context of phase stability, sometimes exposing obvious deficiencies but also demonstrating enhancements over DFT, and provide a baseline on which DFT+DMFT may improve. A forthcoming publication will then extend the current study using DFT+DMFT.
II.2 Filling and ordering energy decomposition in DFT+
Two important aspects of DFT+ calculations in correlated materials are (1) the total number of correlated ( or ) electrons per site and (2) the ordering of electrons within the correlated subspace based on spin (magnetism), angular momentum (orbital ordering), or site (CO). These two effects can be labeled as the “filling” and “ordering” of the correlated orbitals, respectively. Here we elucidate a decomposition of the interaction and dc energies that enables a useful decoupling of these two effects for analysis of DFT+ results. This spectral decomposition was also very briefly introduced in our previous work.Isaacs and Marianetti (2016)
To represent the average filling on a site we define the orbital occupancy mean
| (6) |
where is the number of correlated spin-orbitals per site (e.g. 10 for the shell). We then rewrite the interaction and dc energies to contain only terms containing the mean or the deviation from the mean .
| (7) |
where
| (8) |
is the standard deviation of the occupancies for site . We call the filling factor and the ordering factor, and at times in our discussion of results we drop the subscript on and for convenience. is thus rewritten as with:
| (9) |
and
| (10) |
These terms encapsulate the two ways in which a system can avoid paying the Coulomb energetic penalty . From the filling term, the system can minimize by moving towards completely empty () or completely filled () correlated shells on average. From the ordering term, the system can maximize by enhancing the spread in via some type of ordering. Note that values for nominally-unoccupied orbitals still contribute to , so this quantity is distinct from other measures of orbital ordering that are determined from low-energy orbitals (e.g. Wannier orbitals defined from a small energy window). One can rewrite and in terms of and as
| (11) |
and
| (12) |
A function of only , takes the same form as except the prefactor on the quadratic term is instead of 1; depends on both and .
In this work we are primarily interested in the formation energy, which is defined as
| (13) |
where is the cohesive energy of a system with intercalant concentration . The formation energy indicates whether a species of intermediate has a higher or lower cohesive energy than the corresponding linear combination of those of the endmembers. Therefore, only energy terms beyond linear order in contribute. The formation energy dictates the stability of such a species in the limit of low temperature (); it is stable if negative and unstable if positive. One can separately construct the formation energy contributions stemming from , , , using expressions analogous expressions to Eq. 13, allowing one to understand the contribution of each term to the formation energy. Note that will be negative if is lower than the endmember linear combination, while will be negative if is higher than the endmember linear combination due to the negative sign in the definition of in Eq. 10. All formation energies reported in this work are normalized per formula unit (f.u.). We also compute the average intercalation voltage via
| (14) |
where is the elementary charge, is the cohesive energy of body-centered-cubic Li, and the energies are normalized to the number of f.u.Aydinol et al. (1997)
III Computational Details
DFT+ calculations based on the spin-dependent generalized gradient approximation,Perdew et al. (1996) and the rotationally-invariant Hubbard interactionLiechtenstein et al. (1995) with set to 0, and FLL dc are performed using the Vienna ab initio simulation package (vasp).Kresse and Hafner (1994, 1993); Kresse and Furthmüller (1996a, b) The projector augmented wave methodBlöchl (1994); Kresse and Joubert (1999) is employed and the single-particle equations are solved with a plane-wave basis set with a kinetic energy cutoff of 500 eV. We use a () -point grid for the rhombohedral (orthorhombic) primitive unit cell of LixCoO2 (LixFePO4 and LixCoPO4) and -point grids with approximately the same -point density for supercell calculations. The bulk lithium calculation is performed using a -point grid. For structural relaxations in metals we employ the first-order Methfessel-Paxton methodMethfessel and Paxton (1989) with a 50 meV smearing and for all other calculations the tetrahedron method with Blöchl correctionsBlöchl et al. (1994) is used. The ionic forces, stress tensor components, and total energy are converged to 0.01 eV/Å, 10-3 GPa, and 10-6 eV, respectively.
The disordered (solid solution) phase of Li1/2CoO2 is modeled via the special quasirandom structure (SQS) approachZunger et al. (1990) using the Alloy Theoretic Automated Toolkit (atat)van de Walle et al. (2002); van de Walle (2009) using point, pair, triplet, and quadruplet clusters. Candidate structures are generated based on the correlation functions of clusters with a maximum inter-site distance up to the in-plane 2nd nearest neighbor and out-of-plane 1st nearest neighbor distance. To evaluate the structures, we consider the minimal values of the following figure of merit: the root-sum-square of the differences between the cluster correlation functions and those of the random structure. In this evaluation, the correlation functions of clusters containing a maximum inter-site distance up to the in-plane 5th nearest neighbor and inter-plane 6th nearest neighbor are taken into account.
IV Results and Discussion
IV.1 Endmember electronic structure within DFT
We begin by reviewing the electronic structure of the endmembers of LixCoO2 and LixFePO4 within DFT, comparing with the latest experimental understanding of these materials. LiCoO2 crystallizes in the layered structure illustrated in Fig. 1(a) consisting of layers of edge-sharing CoO6 octahedra and layers of Li. It has a rhombohedral primitive unit cell with the space group and A-B-C (O3) oxygen stacking.Johnston et al. (1958); Orman and Wiseman (1984) CoO2 has a very similar structure with a hexagonal unit cell and A-B (O1) oxygen stacking in the space group.Amatucci et al. (1996) Here for convenience we consider CoO2 in the O3 structure, which has a very similar electronic structure to that of the O1 structure within DFT (see the Supplementary Material).
In LixCoO2 the octahedral coordination of Co is slightly distorted due to the ability of the oxygens to relax in the out-of-plane direction, resulting in a symmetry lowering with . Nominally LiCoO2 is in the configuration with filled and levels, while CoO2 has one fewer electron ().
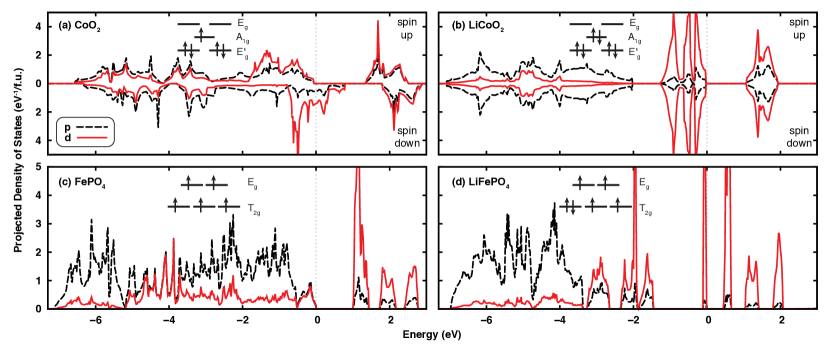
The and projection of the electronic density of states within DFT for CoO2 and LiCoO2 are shown in Fig. 2(a) and 2(b), respectively. LiCoO2 is found to be a band insulator in agreement with experiments.van Elp et al. (1991); Ménétrier et al. (1999, 2008) The computed band gap of 1.1 eV underestimates the experimental value of 2.7 eV as is typical for DFT.van Elp et al. (1991) The occupancies of , and are 0.94, 0.95, and 0.41 for LiCoO2, demonstrating that hybridization between Co and O states leads to appreciable occupation of the nominally-unoccupied states. CoO2 has a ferromagnetic low-spin metallic ground state with a Co magnetic moment of 0.8 . In experiments on CoO2, there is evidence for Fermi liquid behavior and Pauli paramagnetism without any long-range magnetic ordering.de Vaulx et al. (2007); Motohashi et al. (2007); Kawasaki et al. (2009) For CoO2 the occupation of , and are 0.96 (0.67), 0.96 (0.76), and 0.54 (0.52) for spin up (down) electrons, showing the significant degree of covalency in this system.
LiFePO4 and FePO4 both take on the olivine structure, which has an orthorhombic primitive unit cell containing 4 formula units in the space group.Santoro and Newnham (1967); Rousse et al. (2003) The structure consists of corner-sharing FeO6 octahedra layers connected via PO4 tetrahedra as shown in Fig. 1(b). For LiFePO4 there are one-dimensional chains of Li ions.
LixFePO4 has significantly distorted FeO6 octahedra, though for convenience we still crudely discuss the orbitals as and . Experimentally LiFePO4 and FePO4 are high-spin antiferromagnetic (AFM) insulators with Néel temperatures of 52 and 125 K, respectively.Santoro and Newnham (1967); Rousse et al. (2003) While FePO4 () nominally has all the orbitals on a given site singly occupied with aligned spins (i.e., ), for LiFePO4 () there is one additional minority-spin electron in the manifold.Tang and Holzwarth (2003); Shi et al. (2005) Fe linked via corner-sharing octahedra in the same layer have anti-aligned magnetic moments, while those laterally adjacent in different layers linked via PO4 have aligned magnetic moments.Santoro and Newnham (1967); Rousse et al. (2003)
The projected density of states for the olivine endmembers are shown in Fig. 2(c) and 2(d). Due to the antiferromagnetism, both spin channels are identical so only one is shown. FePO4 can be viewed as a charge transfer type insulator since the gap is – in nature, whereas in LiFePO4 states form both the valence and conduction bands and the electronic bandwidths near the Fermi energy are extremely narrow (as little as 0.1 eV). Although LiFePO4 has an even number of electrons, the local Coulomb interaction can play a strong role in developing or enhancing the insulating behavior. Within DFT, the band gaps of FePO4 and LiFePO4 are 1.0 eV and 0.4 eV, respectively. These values are brought much closer to agreement with the experimental band gaps of 1.9 eVZaghib et al. (2007) and 3.8 eVZhou et al. (2004b); Zaghib et al. (2007) using the DFT+ approach.Zhou et al. (2004b); Seo et al. (2015)
IV.2 Impact of on electronic structure of LixCoO2
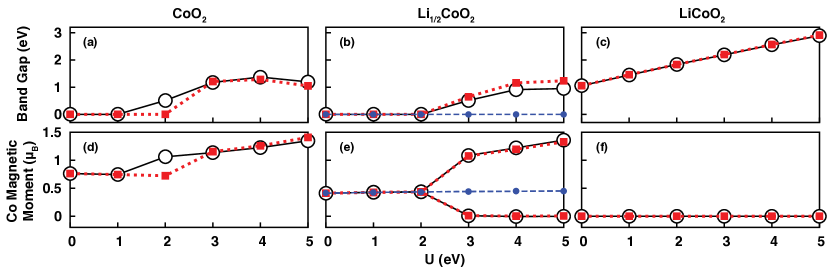
The on-site interaction has been computed as 4.9 and 5.4 eV for LiCoO2 and CoO2, respectively.Zhou et al. (2004c) The -dependence of the band gap and Co magnetic moment for LixCoO2 are shown in Fig. 3. The band insulator LiCoO2 has no magnetic moment and its band gap increases roughly linearly with from 1.1 eV at to 2.9 eV for eV. Structural relaxations with have little impact on the electronic structure. Note that we do not explore eV since in this regime we find DFT+ predicts a high-spin state for LiCoO2Andriyevsky et al. (2014) in contradiction with experimental observationMénétrier et al. (1999, 2008).
CoO2 is semimetallic at lower values of with the and states both partially occupied. Beyond eV (or eV when including structural relaxations), an orbital ordering occurs in which completely fills and becomes a nominally half-filled state. This opens up a band gap of 0.5–1.2 eV and increases the Co magnetic moment to 1.1–1.4 , as compared to 0.7–0.8 for lower .
The lowest-energy structure of Li1/2CoO2 has an in-plane ordering of Li and vacancies corresponding to the unit cell shown in Fig. 1(a) with the Li1 ion removed.Reimers and Dahn (1992); Van der Ven et al. (1998); Wolverton and Zunger (1998) Experimental studies suggest Li1/2CoO2 is a paramagnetic metal with small Co magnetic moments of around 0.25–0.35 .Motohashi et al. (2009); Miyoshi et al. (2010); Ou-Yang et al. (2012) Within our calculations Li1/2CoO2 is a ferromagnetic metal for eV with equal Co magnetic moments of 0.4 . For larger values a new ground state with CO emerges in which the first site takes on a CoO2-like configuration with a moment of 1.1–1.4 and the second takes on a LiCoO2-like configuration with no moment (the actual charge difference between sites is small; see Fig. 4(a)). CO opens an electronic band gap that increases with of 0.6–1.2 eV (0.5–0.9 eV without structural relaxations). Ignoring structural relaxations, the metallic state without CO is metastable and the Co magnetic moments are 0.4–0.5 and remain roughly constant for all values of considered.
IV.3 Tendency for charge ordering in DFT+
To understand the tendency for CO in DFT+, which is not observed in experiment, we investigated whether its origin is the interaction () term or the dc term. Given that the dc energy has a term which is a negative quadratic of , it has a disposition towards charge ordering. Alternatively, the interaction term may indirectly drive CO as a means to reduce the interaction penalty, arising at the expense of . To clearly identify the origin of CO, we implemented a modified DFT+ approach in which both the single-particle potential and total energy contributions stemming from the interaction term or the dc term are averaged over correlated sites. We call this site-averaged interaction and site-averaged dc, respectively.
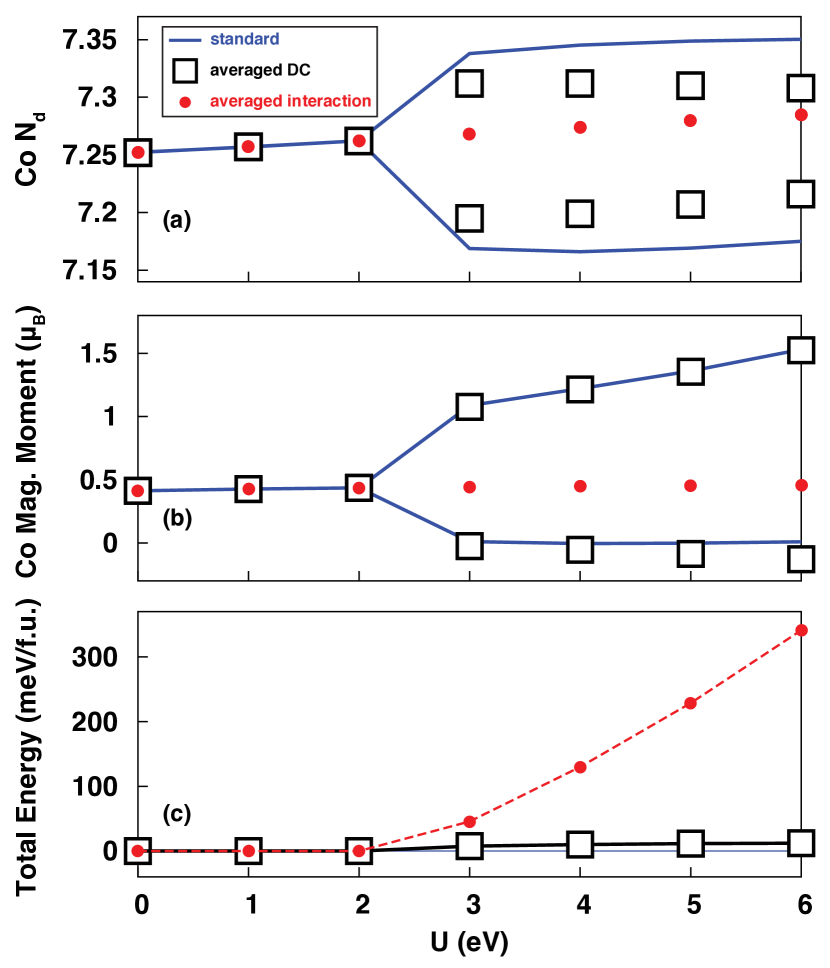
Figure 4 illustrates the results of this computational experiment for ordered Li1/2CoO2 using the frozen structure. With site-averaged dc (black squares) we still find a CO transition, for eV. The magnitude of the CO in terms of is slightly reduced, but the deviations in Co magnetic moment are the same or even more substantial than the standard DFT+ results (blue lines). The total energy shown in panel (c) for this case is only slightly (on the order of 10 meV/f.u.) higher than in the case of standard DFT+, which indicates that the dc energetics are not very much lowered via CO. With site-averaged interaction (red circles), however, no CO can be obtained and the total energy is massively penalized as increases (by hundreds of meV/f.u.). Therefore, we conclude that it is the interaction term and not the dc term that is responsible for the CO in DFT+. This suggests that more accurate solutions to the interaction problem such as DMFT may be critical to resolving the issues associated with spurious CO.
IV.4 Impact of on phase stability of LixCoO2
We first consider the formation energy of Li1/2CoO2 in the frozen structure (i.e., no structural relaxations when imposing ) and without allowing CO, in order to purely see the effects of in the absence of CO and lattice distortions. For the experimental Li ordering in Li1/2CoO2, the two Co atoms in the unit cell are equivalent by point symmetry. Therefore CO is a spontaneously broken symmetry, which enables one to precisely investigate various observables with and without CO. We will return to the effects of both CO and structural relaxations after thoroughly explaining the role of in their absence.
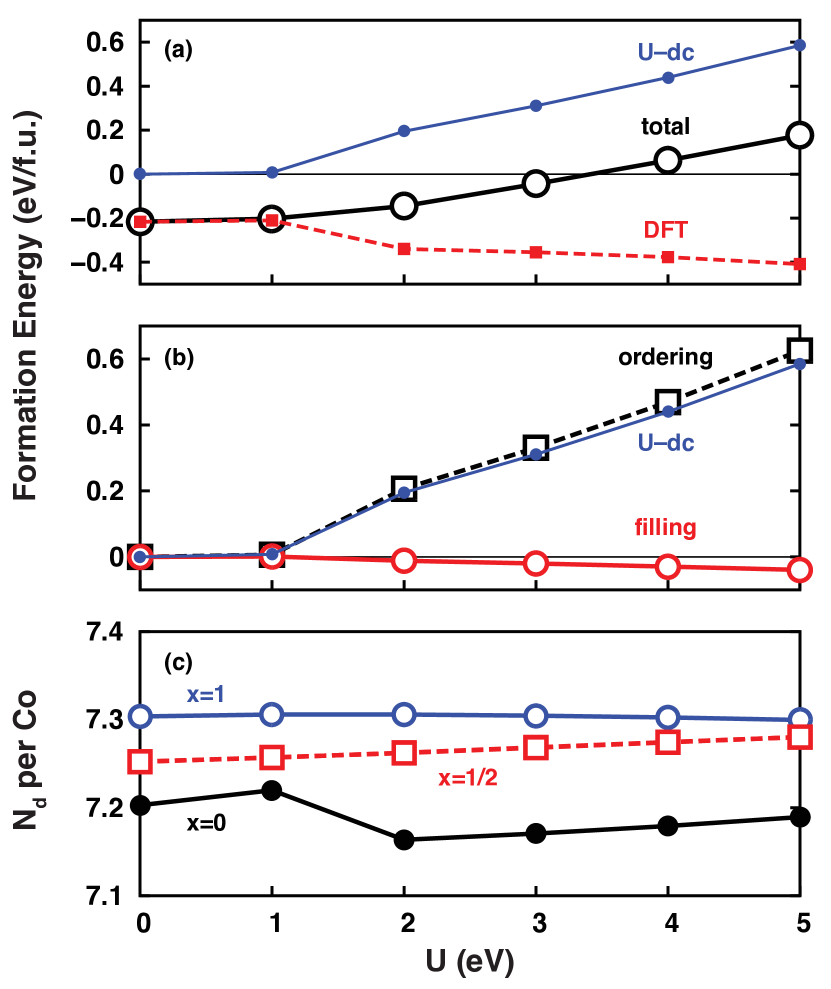
As shown in Fig. 5(a), Li1/2CoO2 is phase stable with a total formation energy of meV for . The formation energy increases monotonically with and for eV it becomes positive, corresponding to a prediction of phase separation. This indicates that the trend of a destabilization of compounds of intermediate found previously in LixFePO4Zhou et al. (2004a) also occurs for LixCoO2. Furthermore, it demonstrates that such a trend is found even in the absence of CO.
To illustrate the origin of this behavior, we also examine the DFT and –dc components of the total formation energy in Fig. 5(a). For eV the –dc component is negligible ( eV) and the slightly less negative value of formation energy ( meV) stems from the DFT component. Compared to the values, for eV the DFT energy increases by 17 meV for LiCoO2 compared to only 7 meV for CoO2 and 14 meV for LiCoO2. For larger the –dc component is strongly positive and increases roughly linearly with at a rate of around 130 meV per eV, leading to a more rapid increase in total formation energy. The DFT component has the opposite trend of becoming more negative with , largely since the DFT energy of CoO2 is strongly penalized by the orbital ordering, but the overall effect on the formation energy is smaller with changes of around 15–30 meV per eV. Therefore, it is the –dc component that is responsible for the destabilization of Li1/2CoO2.
The number of electrons per Co site () is plotted for , , and as a function of in Fig. 5(c). We note that the difference in between CoO2 and LiCoO2 is only around 0.1 even though Li is nominally donating a full electron, which is due to the – rehybridization effect in LixCoO2.Wolverton and Zunger (1998); Marianetti et al. (2004) While the behavior of is roughly constant at 7.3 for LiCoO2 and smoothly increasing for Li1/2CoO2 between 7.25 and 7.28, there is discontinuous behavior for CoO2 in which drops from 7.22 to 7.16 from to eV corresponding to the orbital ordering. This change in electronic structure in the endmember is responsible for the change in behavior in the –dc formation energy contribution.
Since the dc term in Eq. 4 is a negative quadratic function, one might expect that the dc is responsible for the trend towards phase separation. This simple line of reasoning immediately becomes more complicated given that is a nonlinear function of as demonstrated in Fig. 5(c), and a careful analysis in Sec. IV.8 shows that it is not the dc that drives phase separation. Alternatively, we proceed to understand the contributions of both the and terms simultaneously in a different framework using the energy decomposition described in Sec. II.2. In Fig. 5(b) we break down the –dc formation energy contribution into the filling and ordering contributions. Remarkably, the magnitude of the filling contribution contributes negligibly, only being at most tens of meV in magnitude, whereas essentially all of the –dc formation energy comes from the ordering term. Therefore, it is the ordering rather than the filling of the correlated orbitals that drives phase separation.
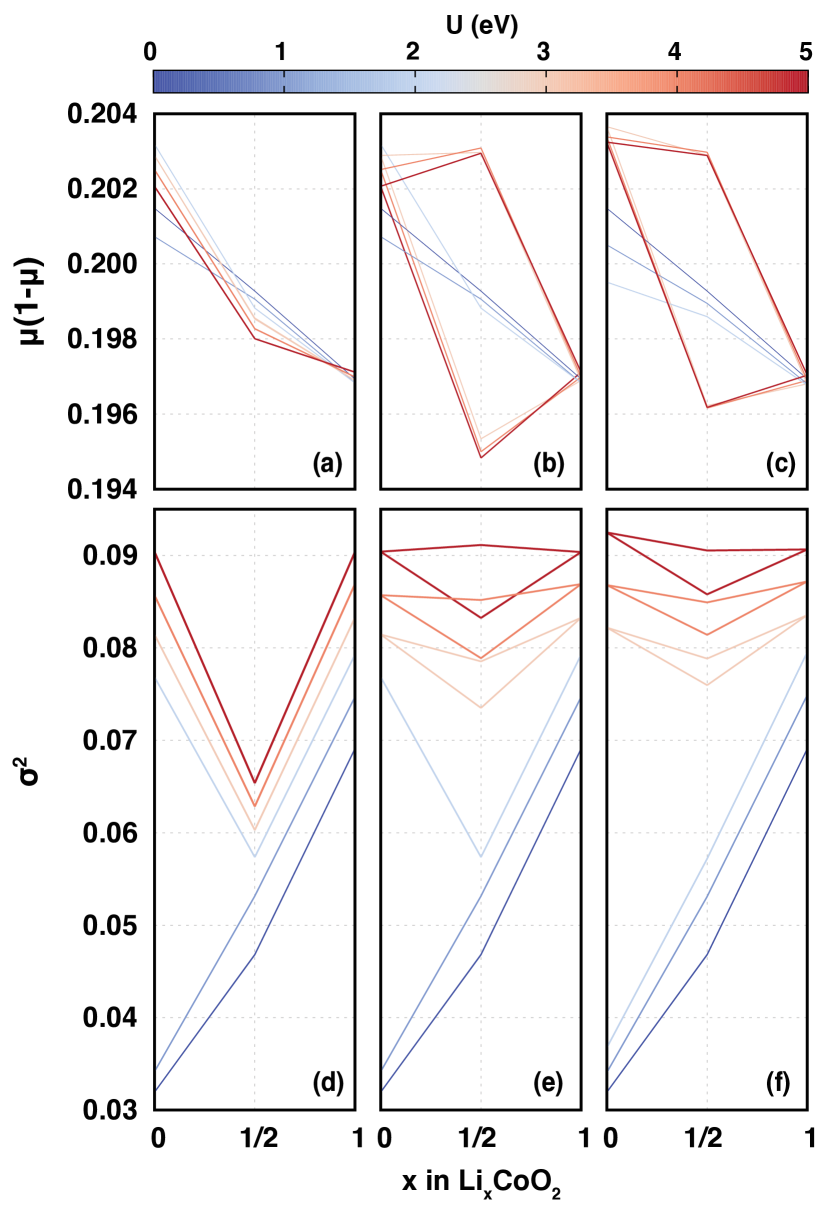
The individual filling factor and ordering factor as a function of Li concentration for different are shown for this case in Fig. 6(a) and 6(d), respectively. We note that based on nominal electron counting will be 0.25 for Co4+ and 0.24 for Co3+. Consistent with this expectation, we observe that the filling factor is highest for and lowest for . The actual values for LixCoO2 are lower in magnitude (around 0.2) due to the substantial covalent nature of the bonding, in particular the hybridization of O states with Co states. Although this filling factor magnitude is around half an order of magnitude higher than that of the ordering factor, the relative deviations of the value compared to the average of the and values are tiny (around electrons). This is why filling term leads to a negligible contribution to the formation energy.
The values of increase with for all in agreement with the expectation that the and dc parts of the total energy functional will penalize fractional orbital occupancy (i.e., ). For eV is nearly linear in , thus leading to no appreciable formation energy contribution. However, once CoO2 undergoes the orbital ordering, its value of significantly increases from 0.03 to 0.08. After this phase transition, for Li1/2CoO2 is substantially lower than the average of those of CoO2 and LiCoO2. For example, for eV is 0.277 for CoO2 and 0.282 for LiCoO2 but only 0.239 for Li1/2CoO2. This lower-than-average is translated to a positive formation energy contribution via the negative sign in prefactor of Eq. 10.
The fundamental behavior we find is that drives phase separation via enhanced ordering of the correlated orbitals for the endmembers relative to the species with intermediate Li concentration. Given that we restricted the possibility of CO, Li1/2CoO2 has no low energy means to orbitally order and keep pace with CoO2 as is increased. We will articulate this important point in a bit more detail. For eV is much smaller for than ; CoO2 has a smaller range of due to its semimetallic behavior and enhanced hybridization with O states. Once it has orbitally ordered at eV and the hole in the manifold is localized in the minority-spin state, however, CoO2 has 5 very occupied orbitals () and 5 much less occupied orbitals ( of around 0.15 for minority-spin and higher values of 0.49–0.59 for due to – hybridization). LiCoO2 is a band insulator, so there is no abrupt change in as a function of . In terms of , LiCoO2 behaves very similarly to CoO2 in the regime of in which CoO2 is orbitally ordered. In LiCoO2 there are 6 very occupied orbitals ( for and states) and 4 much less occupied orbitals ( for states). This gives a large spread () in orbital occupancies for LiCoO2 in addition to CoO2. In contrast, for Li1/2CoO2 we have a metallic state with a nominally half-filled minority-spin level () and thus smaller . This lower-than-average for Li1/2CoO2 is what results in a positive contribution to the formation energy from the –dc energetics.
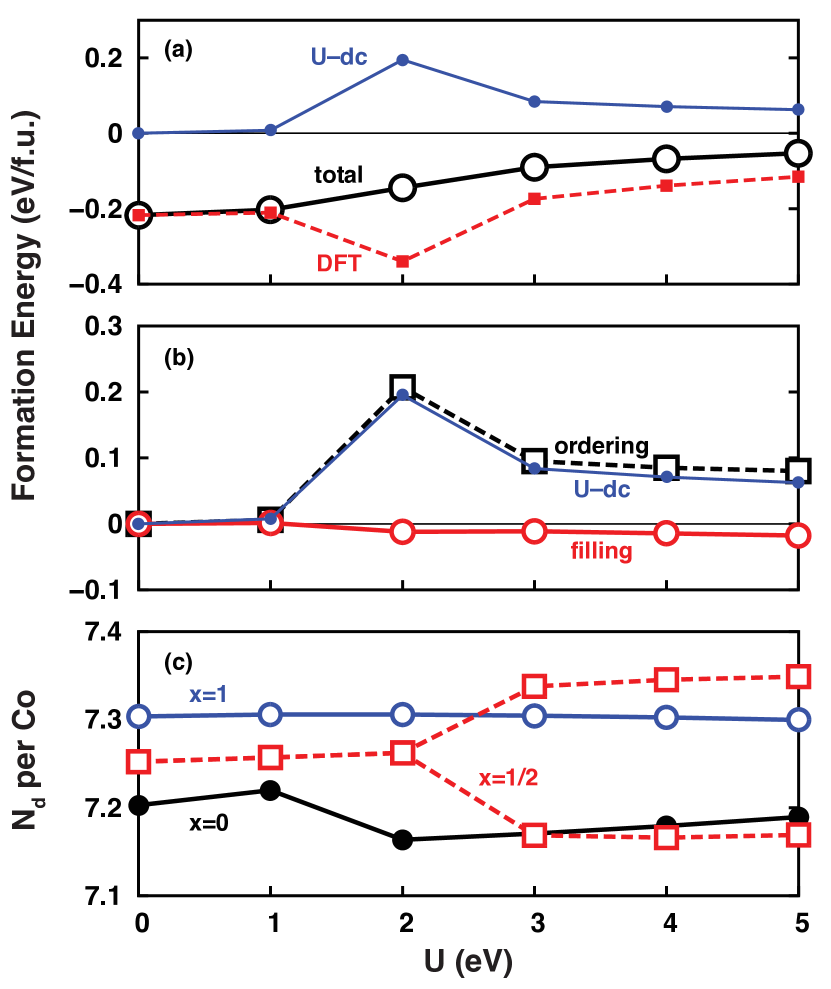
This same type of behavior is preserved even when we now allow CO in Li1/2CoO2, though CO will allow Li1/2CoO2 to order and completely avoid phase separation for all (we still restrict the possibility of structural relaxations until later in this analysis). Fig. 7 shows the results with the frozen structures but now allowing for CO in Li1/2CoO2. Here again the formation energy increases with . For small values of the increase is small and stems from the DFT contribution. After CoO2 orbitally orders and opens a band gap, the –dc energetics are a phase separating contribution to the total formation energy. As before, essentially all of the –dc contribution comes from the ordering, not the filling, of the orbitals. When Li1/2CoO2 charge orders for greater than 2 eV, the –dc phase separating contribution is significantly dampened but there is always still a positive phase separating contribution (53–84 meV). CO also leads to an increase in the DFT formation energy contribution from eV at eV to eV at eV.
As illustrated in Fig. 6(b) and 6(e), the variations in filling factor are again negligible so the only appreciable component to the –dc energetics stems from the changes in ordering factor . The CO of Li1/2CoO2 significantly increases the average , but it still always lags behind the average of those of CoO2 and LiCoO2. For example, for eV is 87 meV for and 90 meV for the average for the and values. In this case we still end up with a total formation energy that steadily increases with , though now CO dampens the process substantially such that for eV the value remains negative consistent with experiment.
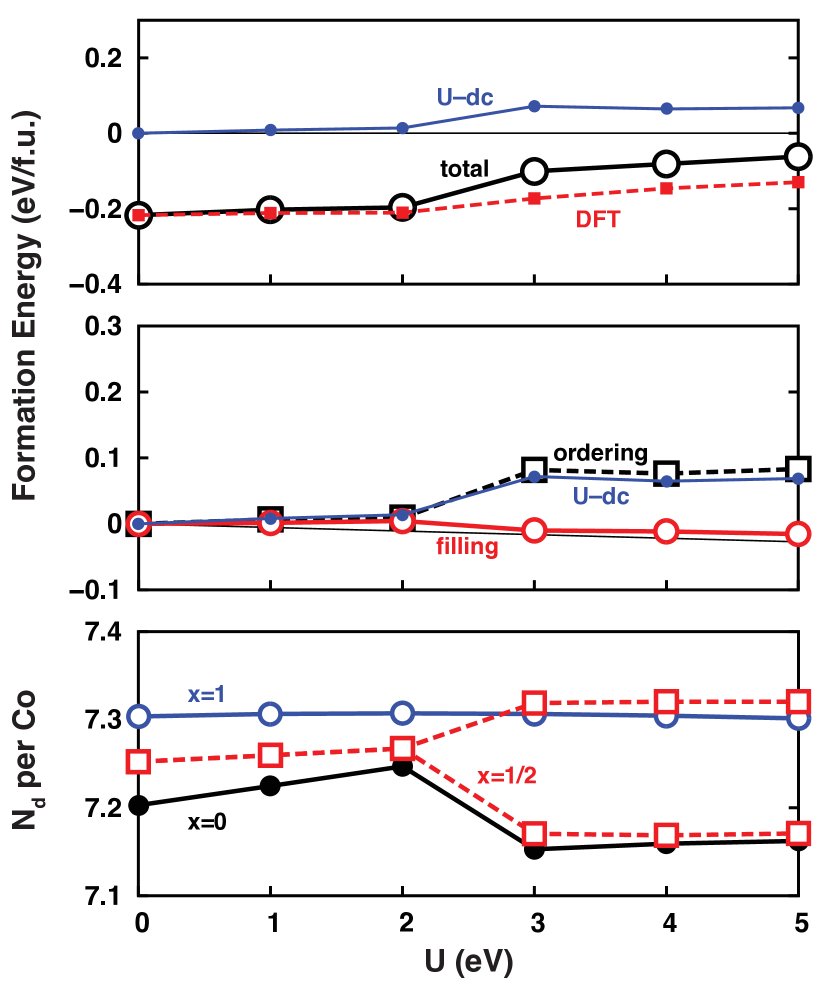
When we include CO in Li1/2CoO2 and full structural relaxations, we find the same fundamental effect as in the previous case only allowing CO: structural relaxations only provide a further dampening. As shown in Fig. 8, the total formation energy increases with and the positive contribution stems from the ordering component of the –dc energetics. Here the CO and CoO2 orbital ordering both occur for eV. The increase in the DFT formation energy contribution upon CO is dampened due to relaxations. The total formation energy remains negative at meV at eV. The plots of and are shown in Fig. 6(c) and 6(f), respectively. Structural relaxations serve to slightly enhance for CoO2 and decrease the difference in for the distinct Co sites in Li1/2CoO2.
These results have significant implications on the accuracy and robustness of the DFT+ description of strongly correlated materials. Without CO, which is not found in experiments on this class of materials, DFT+ incorrectly predicts that LixCoO2 phase separates once becomes appreciable. This is true even if we allow structural relaxations while suppressing CO, which is possible since CO is a spontaneously broken symmetry in Li1/2CoO2, and in this case the total formation energy values are -40 meV, +67 meV, and +182 meV for of 3, 4, and 5 eV, respectively. That DFT+ requires artificial CO to correctly capture the phase stable nature of LixCoO2 is a significant weakness of this approach.
IV.5 Impact of on electronic structure of LixFePO4
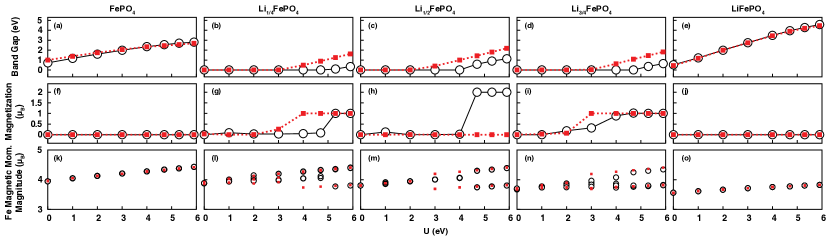
The interaction has been computed as 3.7 and 4.9 eV for LiFePO4 and FePO4, respectively.Zhou et al. (2004c) The variation of the band gap, total magnetization, and Fe magnetic moment as a function of for LixFePO4 is illustrated in Fig. 9. The endmembers are both AFM so there is zero net magnetization. The Fe magnetic moment, which increases approximately linearly with , is 4.0–4.4 for FePO4 and 3.6–3.8 for LiFePO4 for 0 eV 6 eV. The endmembers are both insulating. For this range the band gaps increases from 1.0 to 2.7 eV for FePO4 and 0.4 to 4.5 eV, a much larger range, for LiFePO4. Very similar results for the endmembers are found when one freezes the ions to the experimental structures.
For intermediate we consider the lowest-energy configurations that fit within the primitive unit cell shown in Fig. 1(b). The structures correspond to removing Li2, Li3, and Li4 for , Li3 and Li4 for , and Li4 for .Zhou et al. (2004a) Calculations on the two other possible primitive cell Li1/2FePO4 structures are always found to be higher in energy, so we do not discuss them here. In addition to the case in which structures are fully relaxed, we also perform calculations on structures constructed via linear interpolation of the experimental and structures. This is an ideal manner to isolate the effect of lattice relaxations given that appreciable lattice distortions arise in the intermediate compounds even for .
For the intermediate species of LixFePO4 are AFM metals without any CO. The Fe magnetic moments are 3.9, 3.8, and 3.7 for , , and , respectively. The magnetic moment magnitude gradually increases with , and above critical values a CO transition occurs leading to distinct Fe3+-like () and Fe2+-like () sites within the primitive unit cell. This symmetry breaking leads to distinct local magnetic moments and the opening of an electronic band gap. Unlike LixCoO2 for which differences among correlated sites are 0.15-0.18 electrons in the CO state, LixFePO4 has CO states with substantially larger differences around 0.4 electrons due to the highly localized nature of this system.
For Li1/2FePO4 using the frozen structure (linear interpolation of endmember experimental structures), the CO transition at eV yields a ferrimagnetic state with total magnetization 2 ; there are 2 Fe magnetic moments of 3.7 (Fe2+-like) and 2 Fe magnetic moments of (Fe3+-like). It opens a band gap of 0.6 eV for eV that is further increased with to a value of 1.1 eV for eV. Including structural relaxations has little effect on the electronic structure in the regime of before the onset of CO. However, relaxations assist the CO transition and result in a lower critical value of eV above which the CO state remains AFM with Fe magnetic moments of 3.7 and 4.2 . In addition, relaxation serves to enhance the band gap of the CO state to values of 0.4–2.2 eV.
Li1/4FePO4 and Li3/4FePO4 show similar behavior in which at critical values of (lower when structural relaxation is included) a CO transition opens an electronic band gap. For Li1/4FePO4 with (without) relaxations a band gap opens at eV (5.3 eV) when CO yields 1 Fe3+-like site and 3 Fe2+-like sites. For Li3/4FePO4 with (without) relaxations a band gap opens at eV (5.3 eV) when CO yields 3 Fe3+-like sites and 1 Fe2+-like site. For and the magnitude of the band gap is around 0.1–0.6 eV for the frozen structures and a larger values of 0.5–1.8 eV including relaxations. For these , the CO transition always leads to a ferrimagnetic state with magnetization of 1 . The Fe magnetic moments of the distinct sites are around 3.8 and 4.4 and slowly increase with as in the case of . Differences in the magnetic moments between the frozen and relaxed structures in the CO regime are small. We note that for these , unlike in , we find partial CO for intermediate values of in which the Fe magnetic moments begin to take on slightly different values without the presence of a band gap. For example, including relaxations for eV Li1/4FePO4 is metallic with Fe magnetic moments of 3.9, , , and 4.0 . This indicates DFT+ is driving LixFePO4 towards CO even for small , which is to be expected given the very narrow bandwidths.
Unlike for LixCoO2 (see Fig. 3), for LixFePO4 the CO is stabilized by structural relaxations as evidenced by the lower critical values for CO. The stabilization of CO by structural relaxations suggests stronger coupling between the electronic and lattice degrees of freedom in LixFePO4 as compared to LixCoO2. This is consistent with the evidence for polarons in LixFePO4.Ellis et al. (2006); Zaghib et al. (2007)
IV.6 Impact of on phase stability of LixFePO4
The formation energy behavior for LixFePO4 as a function of without allowing for the effect of structural relaxations is summarized in Fig. 10. The behavior shares many similarities and a few differences to that of LixCoO2, which we will describe. As illustrated in panels (a)–(c), for all intermediate the total formation energy increases with as in the case of LixCoO2 and changes sign from negative to positive for sufficiently high . For example, for the formation energy is eV at and increases to +0.21 eV for eV. For and , there are only slightly negative values of around eV for , which increase to as much as +0.26–0.27 eV as increases. We note that the formation energies are higher for this frozen structure case since the intermediate species will exhibit more significant structural relaxations than the endmembers.
For most of the range, that below the critical for CO, the DFT component of the formation energy is approximately constant and does not strongly influence phase stability. For example, for this component varies by only 25 meV for 0 eV 4.7 eV. In contrast, the –dc component of the formation energy undergoes significant changes as it increases roughly linearly with ; the change is 0.21 eV over the same range for . This –dc contribution is positive and therefore, as in the case of LixCoO2, is what drives the total formation energy towards phase separation in LixFePO4 in this regime before CO. One caveat to this characterization is that the DFT component varies more considerably (by 90 meV) for Li3/4FePO4 in this regime. In this case it is positive for 2 eV 3 eV and thus can be described as partially responsible for the positive total formation energy.
Upon CO there is a drastic change in the formation energy components, as in the case of LixCoO2. The –dc component drops steeply to much smaller values of around 0.06–0.08 eV. For , for example, the value is 0.33 eV for eV and only 0.07 eV for eV due to the CO transition; the drop in the –dc contribution is substantial though smaller in magnitude for and . Here as in LixCoO2 we also find an increase in the DFT formation energy contribution due to CO. For example, for Li1/2FePO4 the DFT formation energy contribution jumps from meV to +122 meV across the CO phase boundary. Unlike in Li1/2CoO2 [see Fig. 7(a)], for Li1/2FePO4 the increase in the DFT component is enough to make it positive. It is even larger in magnitude than the –dc component. For and the DFT component is already positive but it becomes substantially more positive after CO. Despite how sharp the changes in formation energy components are, the total formation energy changes less abruptly from CO. For example, for the total formation energy changes only by 3 meV between eV and eV. After the CO transition, the formation energy and its components are relatively flat versus . For , for example, the changes are on the order of only 15–25 meV.
The breakdown of –dc formation energy into filling and ordering contributions is shown in Fig. 10(d)–(f). As in LixCoO2, it can be seen that the average filling contributes negligibly to the phase separation; the maximum contribution is at most 25 meV and typically much smaller. Therefore, again the impact of and the dc is essentially entirely contained within the ordering contribution. The ordering contribution tracks the behavior of the total –dc term and it can be as much as +0.3 eV.
The plots of on each Fe site versus in Fig. 10(g)–(i) illustrate that there is also a – rehybridization mechanism in LixFePO4 similar but smaller than that in LixCoO2 with differences in around 20–30% of a full electron between and . Like the Fe magnetic moment data in Fig. 9, these values illustrate the partial and full CO that occurs as increases. We note that without structural relaxations the spread in values after CO for the intermediate can be larger than the difference between of and . We find the behavior of with is complex and system dependent: in this case for intermediate is generally lower than the endmember linear interpolation, whereas in LixCoO2 the opposite is true.
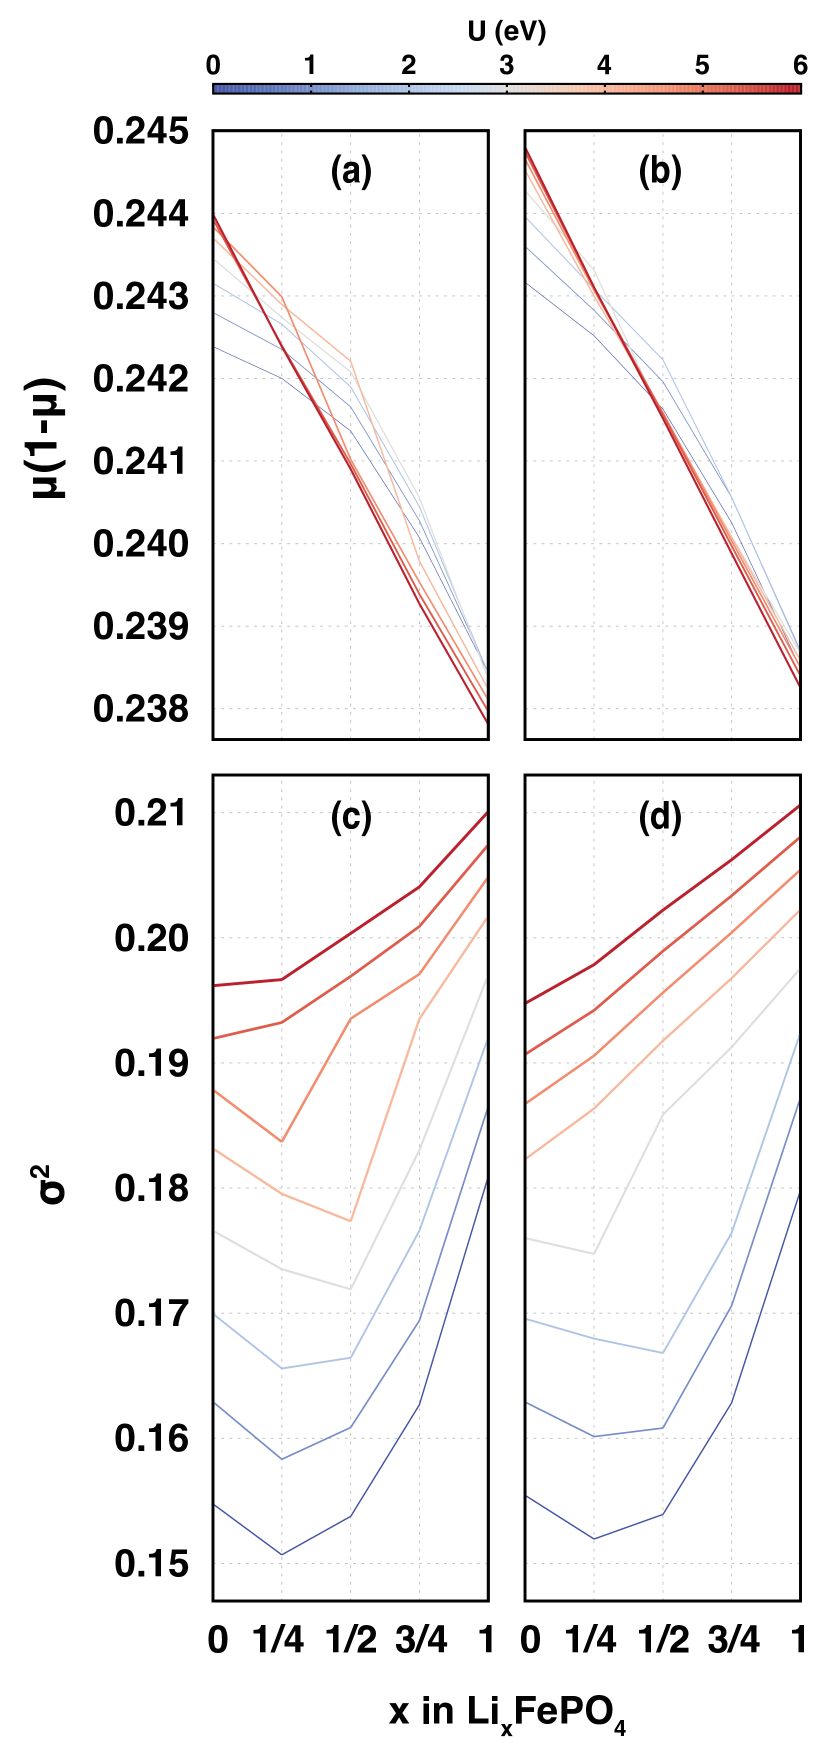
To investigate the origin of the positive –dc phase-separating contribution to the total formation energy for LixFePO4, in Fig. 11 we plot the individual [panel (a)] and [panel (c)] values as a function of for different . For clarity, we take the average over the 4 Fe sites in the primitive unit cell. As in the case of LixCoO2, the magnitude of the filling factor is high (around 0.24) but the changes with respect to the average of the endmember values are very small (on the order of ). This is responsible for the negligible contribution of the filling component to the total formation energy. As for LixCoO2, the filling factor is highest for and . Compared to those of LixCoO2, the values of LixFePO4 are much nearer to the range expected from nominal electron counting for Fe2+ and Fe3+ (0.24–0.25) since there is less hybridization between and states. This is also the reason for the enhanced magnitude of compared to that of LixCoO2.
Compared to , has a smaller but still significant magnitude (around 0.18) for LixFePO4. The values monotonically increase with (by around 0.003–0.006 per eV) for all , which as in the case of LixCoO2 is expected since the and dc terms serve to enhance orbital polarization in the correlated subspace. Unlike in , there are substantial deviations of the values for intermediate compared to the endmember average. For example, for at eV =0.172 as compared to 0.187 for the endmember average. The ordering factor is consistently lower than the endmember linear interpolation, thus leading to the positive formation energy contribution.
One can observe a moderate increase in values for intermediate upon CO. For example, for jumps from 0.177 to 0.194 upon CO at eV. However, as in the case of LixCoO2 the values still are always lower than the linear interpolation of and values even after CO. For example, the endmember average is 0.196 for eV so it is still slightly larger than the value for Li1/2FePO4. Therefore, we find that CO alleviates but does not eliminate the tendency for phase separation with derived from the ordering of correlated orbitals.
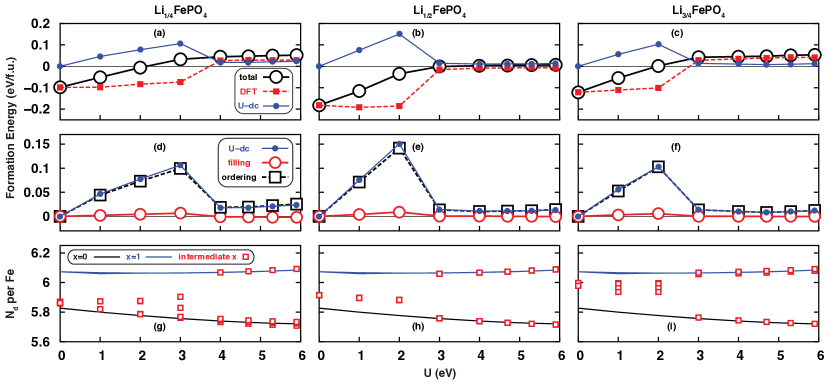
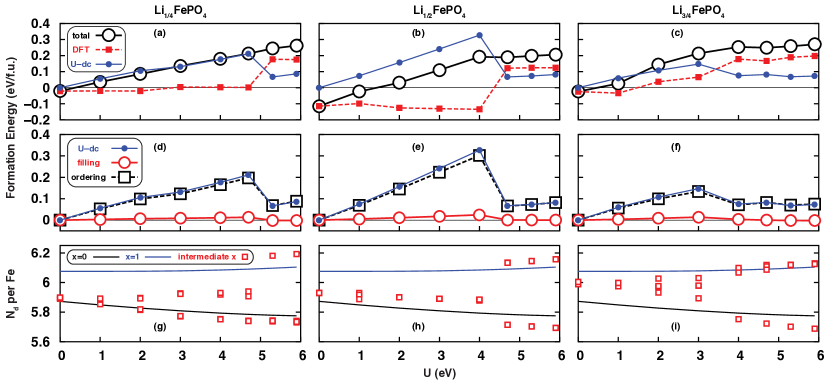
Figure 12(a)–(c) shows the formation energy behavior of LixFePO4 including full structural relaxations. In this case, since there are more significant total energy lowerings from relaxing the intermediate structures compared to those from relaxing the endmembers, the total formation energy values are significantly lower. For example, for Li1/4FePO4 the maximum formation energy is 52 meV as opposed to 262 meV in the case of linearly interpolated endmember experimental structures. Otherwise, the behavior is generally similar to the case without relaxations. For all , the total formation energy increases monotonically with and for sufficiently high switches from negative to positive. We note that the formation energy Li1/2FePO4 is only slightly positive (+6.7 meV) for the largest we considered. This is in quantitative disagreement with the original DFT+ workZhou et al. (2004a) for reasons which are not clear, but is consistent with a more recent report.Ong et al. (2011)
Here again the DFT formation energy contribution is approximately constant (deviations of at most 25 meV and typically less) before the CO transition with a slight tendency to increase with . In this case is no longer an exception to the general trend. In contrast, the –dc contribution is positive and significantly increases (roughly linearly) with . The largest value it takes on is 151 meV for at eV. Therefore, again it is the positive –dc contribution that destabilizes the compounds of intermediate in this regime.
After CO, the –dc formation energy contribution is significantly dampened but remains positive. For example, for it decreases from 106 to 18 meV at the CO phase boundary. The effect is similarly substantial for all . At the same time, the DFT formation energy component abruptly increases due to CO and becomes positive ( and ) or much less negative (). The magnitude of this increase is more substantial than that of LixCoO2, which suggests that in LixFePO4 CO constitutes a more significant rearrangement of charge density. The net effect is that upon CO the increase in total formation energy with is slowed. For the case, for example, the total formation energy increases only by 12 meV from to eV as opposed to the lower- regime in which the same change in yields increases of around 46 meV. In the CO state both the DFT and –dc components of the formation energy are nearly constant with respect to . As such, the total formation energies saturate to around +50, +6, and +50 meV for , , and in the regime of large .
As illustrated in Fig. 12(d)–(f), in this case again the positive –dc formation energy contribution stems entirely from the ordering contribution (from the spread in orbital occupancies); the filling component (from the average orbital occupancy) is negligible with values less than 10 meV. CO lowers the filling contribution even further to no more than 1 meV. In contrast, the ordering contribution is dampened but still positive and appreciable; it tracks the behavior of the total –dc formation energy contribution.
The evolution of the values into two discrete groups (Fe3+- and Fe2+-like) due to CO is shown in Fig. 12(g)–(i). A similar magnitude of - rehybridization is observed based on the overall range of . As in the case without structural relaxations, here for and though not there is a regime of intermediate in which there is partial CO in metallic states. After the CO transition the two groups of values closely match those of and , which suggests the CO is very complete and the local environments of Fe for intermediate mimic those of the endmembers.
The filling and ordering factors for relaxed LixFePO4 are shown in Fig. 11(b) and 11(d), respectively. We find similar results when including structural relaxations. The deviations in with respect to the linear interpolation of endmember values are negligible. gradually increases with and the values for intermediate always lag behind the endmember linear interpolation; the effect is substantially dampened but not entirely eliminated when CO increases for intermediate . We note that with structural relaxations after CO the versus curves are nearly linear, which illustrates that relaxations provide a further dampening of the general tendency towards phase separation with stemming from the ordering term.
IV.7 Phase stability of LixCoPO4
To further validate our general understanding of the impact of on phase stability, we investigate LixCoPO4. This material is isostructural to the olivine LixFePO4 structure shown in Fig. 1 with (nominally) an additional electron on the transition metal site. LixCoPO4 is of interest since it has been shown to have a very high voltage (4.8 V) as a cathode material.Amine et al. (2000) It is intriguing physically since unlike LixFePO4 it does have a stable intermediate compound, for .Bramnik et al. (2007); Ehrenberg et al. (2009); Strobridge et al. (2014)
We consider the lowest-energy configuration of Li2/3CoPO4 deduced by Strobridge et al.Strobridge et al. (2014) and study the formation energy as a function of with the frozen structures. Experimentally the LixCoPO4 system is AFM,Santoro et al. (1966); Ehrenberg et al. (2009) so our calculations consider the endmembers in the AFM state. We base our calculations on the magnetic configuration of LiCoPO4, which is identical to that of LiFePO4.Santoro et al. (1966); Santoro and Newnham (1967) For Li2/3CoPO4 we find the AFM state to be unstable and devolves into a ferrimagnetic state. In this state one of the Co sites has no magnetic moment unlike the values of the other 11 leading to a total magnetization of .
We find total formation energies of , , and eV for values of 0, 2, and 5.48 eV, respectively. This corresponds to the same trend of formation energy increasing with . We again find the positive formation energy contribution is the –dc component, and here also the filling contribution is very small (magnitude of at most 20 meV) so the origin is increased ordering of the endmember states relative to those of the intermediate species.
For the above analysis we have restricted our attention to the AFM or AFM-like states as they are the experimental magnetic structure for LixCoPO4. However, we note that the magnetic ground state of LixCoPO4 predicted by DFT+ changes as a function of , which is likely the origin of a previous study finding the formation energy becomes more negative as a function of .Strobridge et al. (2014) For LiCoPO4 we find a ferromagnetic (FM) ground state within DFT with the AFM state 37 meV higher in energy, whereas for CoPO4 we find a non-spin-polarized (NSP) ground state with the FM and AFM states 57–61 meV higher in energy. At the ground state of LiCoPO4 becomes antiferromagnetic, and by eV the ground state for both endmembers is AFM consistent with experiments. For we find the FM state is unstable within DFT and the NSP state is 0.54 eV higher in energy than the ferrimagnetic state. At eV the FM state becomes metastable only 7 meV above the ferrimagnetic state, and for eV the FM state becomes the ground state with the ferrimagnetic state 68 meV high in energy. In any case, DFT+ does predict the phase to be stable, qualitatively consistent with experiment.
IV.8 Impact of double counting on phase separation trend
Our preceding analysis shows that it is valuable to recast the –dc energy as the sum of ordering and filling terms, as the filling term was shown to have negligible impact on formation energies. However, there is still utility in analyzing what can be learned by separately inspecting and , given that the term specifically is handled much more precisely in the context of DFT+DMFT.
The simplest possible explanation for the positive –dc formation energy contribution comes from the form of the dc term Eq. 4. We expect the Li in LixCoO2 and other intercalation materials will be ionized and donate some amount of charge (depending on the degree of hybridization with O states) to Co. Therefore, we might make the assumption that is linear in . Since energy contributions linear in do not contribute to the formation energy by the definition of Eq. 13, this means the term linear in in the dc term cannot contribute to the formation energy. The other part of the dc, however, yields a term proportional to (a negative quadratic in ) in the total energy. With the assumption of a linear relationship between and , this term is a negative quadratic in that necessarily provides a positive formation energy contribution.
This simple kind of argument fails to fully describe the observed behavior for the following reasons, which we illustrate using the simplest example of Li1/2CoO2 without CO considering the frozen structures. The first two reasons come from the fact that the variation of with is in fact substantially nonlinear, as can be easily seen for the eV data in Fig. 5(c). In this regime, for is much closer to the value than the value. For example, for eV the values are 7.19, 7.28, and 7.30 for , , and , respectively. First of all, this means that the contribution of the dc energy that is proportional to will contribute to the formation energy. For example, for this case it takes on the value of +89 meV for eV.
Secondly, the quadratic part of the dc energy no longer necessarily gives a positive formation energy contribution for that is nonlinear in . One can parametrize the deviation from linearity using the additive form , where is the value for Li concentration , is the linear value of , and is the deviation from linearity. Here we assume a single site for clarity. It then can be shown that the formation energy contribution stemming from the quadratic part of the dc energy is
| (15) |
Note that the term proportional to can be ignored as should be much smaller than . When ( is linear with ), we indeed have a positive formation energy contribution since the second term vanishes and the first term will be positive since . However, this second term can lead to a significant negative (phase stabilizing) formation energy contribution when is positive and non-negligible. This actually results in a strongly negative formation energy contribution in the present case: for eV, for example, the formation energy contribution from the quadratic part of the dc is eV. Therefore, the dc term is not responsible for driving phase separation in this regime of .
The third and final reason the simple argument fails is that the term also contributes significantly to the formation energy. For example, for eV the formation energy contribution from the interaction term is +1.78 eV, strongly driving phase separation.
Additionally, even in the limit of small , in which the dc does provide a phase separation contribution, it is not fully responsible for the overall trend. In this limit, the impact of on the interaction and dc formation energy components depends solely on the DFT density matrix. Computing and from Eqns. 3 and 4, respectively, and evaluating them at , we find that the dc energy contributes and the interaction energy contributes a larger to the change in total formation energy.
IV.9 Average intercalation voltage of LixCoO2 and LixFePO4
Up to now our analysis of the DFT+ energetics has focused on the formation energy, and we seek other observables to probe the fidelity of our total energy calculations. Therefore, we now turn to average intercalation voltage, which is a function of the energy difference of the cathode endmembers and the energy of bulk Li (see Eq. 14) and can be measured experimentally.
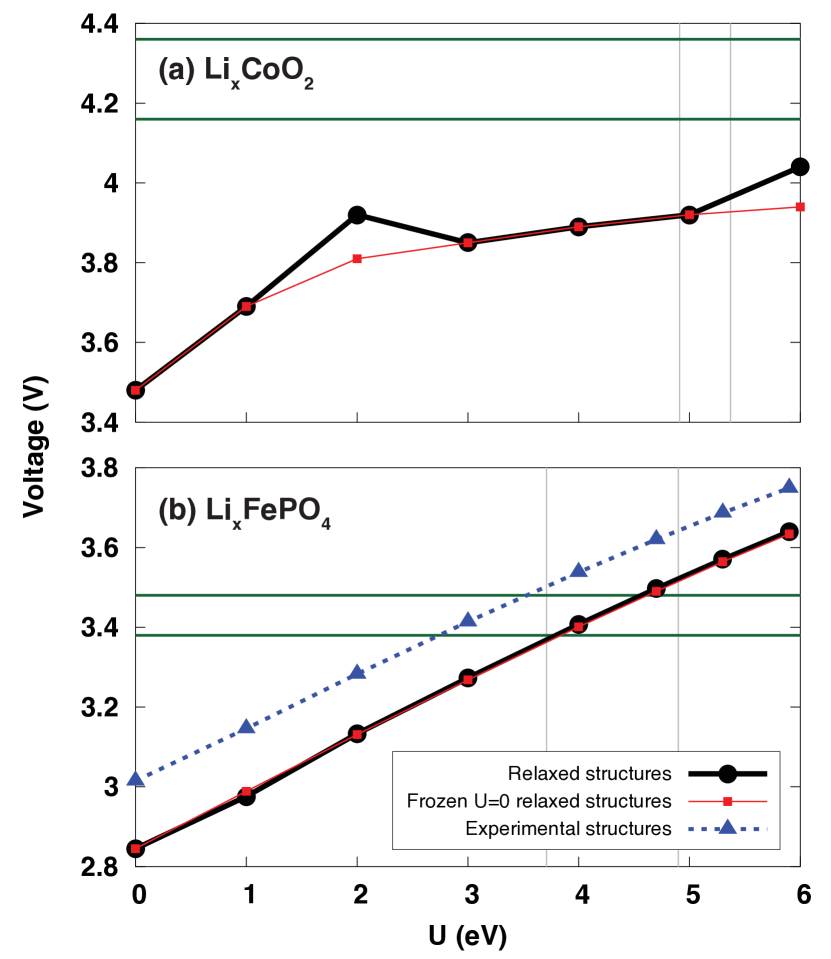
Figure 13 shows the behavior of the average intercalation voltage as a function of . As found previously, the voltages tend to increase with for both LixCoO2 and LixFePO4.Zhou et al. (2004c) For LixCoO2 using relaxed structures, the computed voltage exhibits one discontinuity at eV after which CoO2 gaps and another at eV after which LiCoO2 becomes high spin. Otherwise, the values are almost identical to those found using the frozen structures. The DFT value is 3.48 V and there is an increase to 3.92 V at eV. We note that the predicted voltages for LixCoO2 are smaller than those reported in the work of Zhou et al.,Zhou et al. (2004c) but agree with several more recent studies.Chevrier et al. (2010); Aykol and Wolverton (2014); Aykol et al. (2015) Ultimately, DFT+ underpredicts the average voltage of LixCoO2 compared to the experimental value of 4.26 V.Amatucci et al. (1996) For LixFePO4 using relaxed structures, the DFT voltage is 2.85 V and increases approximately linearly to 3.50 V at eV, in agreement with the experimental voltage of 3.43 V.Padhi et al. (1997b); Yamada et al. (2001) Using the experimental structures, the predicted intercalation voltage is enhanced by 0.1-0.2 V.
In LixFePO4, the two endmembers have similar properties as they are AFM insulators with very well localized electronic states. Therefore, it is possible that DFT+ is effective at describing the energetics of both phases and hence can capture the voltage effectively. However, in LixCoO2 one endmember (LiCoO2) is a band insulator while the other is a Fermi liquid (in experiment); the latter is found to be a magnetic metal or insulator within DFT+ depending on . We speculate that the distinct nature of the endmembers for LixCoO2, and their inadequate description within DFT+, will lead DFT+ to make energetic errors which vary substantially for the different endmembers causing a worse description of the voltage as compared to the olivines. A forthcoming DFT+DMFT study will address this issue.
IV.10 Li order-disorder transition temperature of Li1/2CoO2
Another observable with which we can assess the accuracy of DFT+ energetics, albeit at a fixed composition, is the order-disorder (O-D) transition temperature for Li. This is the temperature above which the Li ions and vacancies become disordered. Here we consider Li1/2CoO2, whose experimental O-D temperature is 333 K.Reimers and Dahn (1992)
We estimate the O-D transition temperature based on the ground state total energies of the ordered and disordered (SQS) phases using the equation
where is the Boltzmann constant and the factor of comes from the entropy of mixing for . This expression is an approximation to performing finite-temperature Monte Carlo simulations on a cluster expansion based on such ground-state total energies. Past work suggests that this simpler expression should reasonably capture trends in .Lu et al. (1994); Jiang et al. (2004, 2005, 2009) Performing a cluster expansion of LixCoO2 using DFT+ would likely be formidable given the many spurious ordered states which form at nonstochiometric compositions, as will be elucidated below.
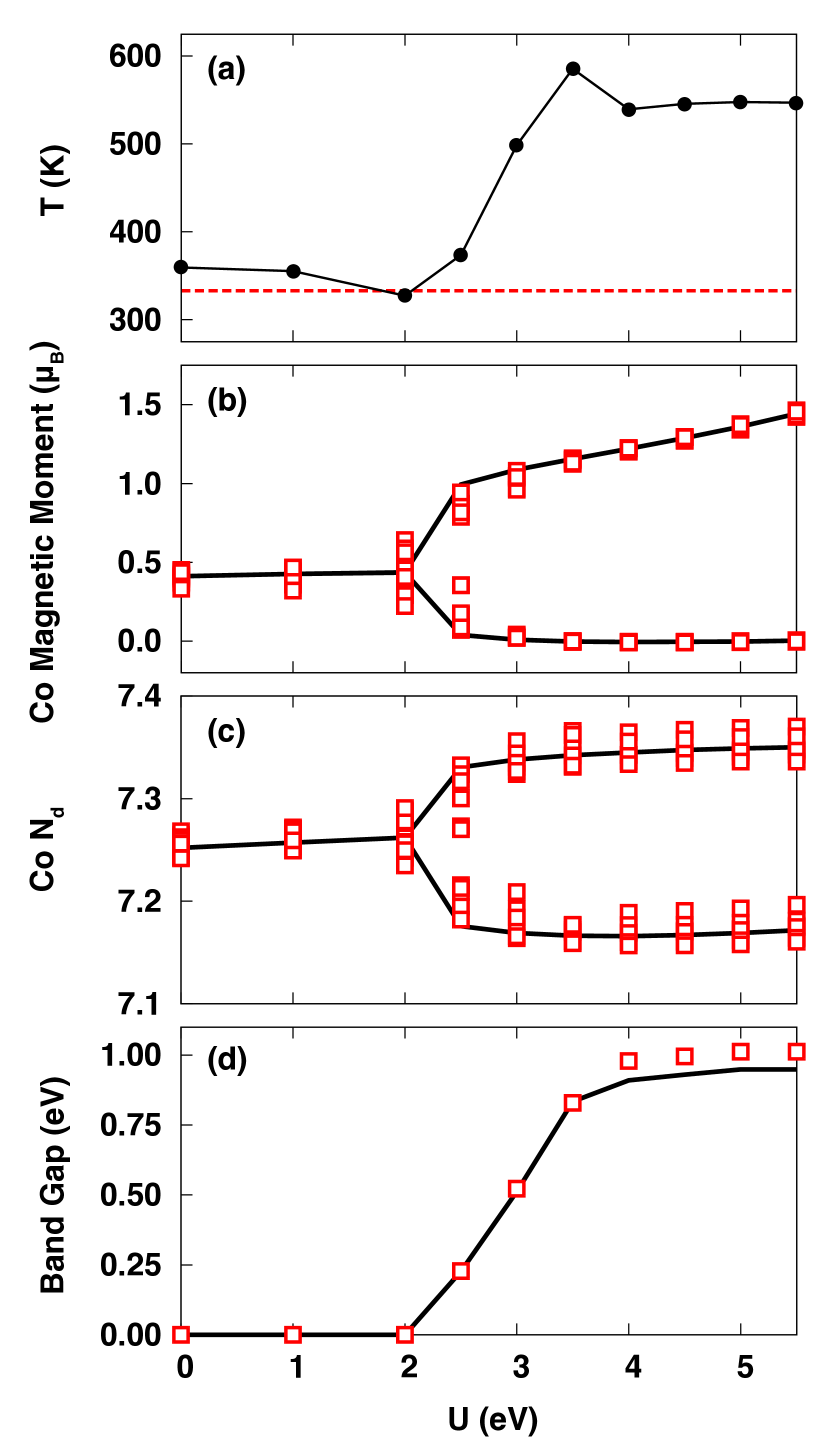
Our predicted for an optimal 42-ion SQS cell frozen to the relaxed structures is illustrated in Fig. 14(a). Here within DFT the temperature is overestimated by around 25 K with respect to the experimental value. For small values of the temperature decreases by as much as 32 K, bringing the prediction closer to the experimental value. However, for eV, there is a very rapid increase in the predicted transition temperature to values of around 500–600 K, nearly a factor of two greater than the experimental value.
The Co magnetic moments and values as a function of are shown in panels (b) and (c) of Fig. 14, respectively. For small there are small deviations of the magnetic moments and compared to those of the ordered structure due to the different local environments of the Co in the disordered phase. The range of these values are enhanced for eV, above which both the ordered and disordered cells charge order and open an electronic band gap [see panel (d)]. After the CO transition, there is still some spread in the magnetic moment and values for the disordered phase with respect to those of the ordered phase. In this particular case, structural relaxations actually amplify these trends, resulting in a substantially higher for eV, for example (see Supplementary Material for more details).
This demonstrates that the CO transition found within the DFT+ approach is largely responsible for the erratic behavior of the predicted Li order-disorder transition temperature for Li1/2CoO2. In the Supplementary Material, we show results for additional SQS cells with and without structural relaxations. We find that within DFT can be overestimated or underestimated depending on the particular cell. A substantial increase in due to CO is often observed, though it is not always as dramatic this particular case and does not always lead to as large a disagreement with the experimental value. In general, the results indicate that DFT+ is highly unreliable in predicting the order-disorder transition temperature due to CO. This further supports the notion that CO is an artifact of the approximate nature of the interaction in DFT+, consistent with the fact that it is not observed in experiment. While spurious CO appears to be essential for properly attaining a phase stable system in Li1/2CoO2, as discussed in Sec. IV.3, it appears to cause severe problems in the SQS supercell. While it is possible that more reasonable behavior emerges for substantially larger SQS supercells, which would be computationally expensive, this is beyond the scope of the current paper.
It should be noted that the spurious behavior we have documented in the context of this SQS calculation of would likely manifest itself in any parameterization of the cluster expansion. In the best case scenario, this could lead to a complicated cluster expansion with long range interactions. The entire procedure could become ill-posed in the worst case with numerous orbitally ordered and/or CO states close in energy for a given Li ordering. This behavior does not bode well for the application of DFT+ in alloy thermodynamics. Given that DFT+DMFT does not necessitate charge/orbital ordering in order to capture the energetics of strongly correlated systems, it is likely not to share these deficiencies.
V Conclusions
At the DFT+ level of theory, the on-site tends to destabilize intermediate- compounds of both phase stable LixCoO2 and phase separating LixFePO4, though qualitatively correct results are obtained for formation energies in both cases for physically reasonable values of . A new formation energy decomposition, which disentangles the distinct roles of the filling and ordering of orbitals, reveals that reduced orbital ordering in compounds of intermediate Li concentration relative to the endmembers is responsible for this effect. For intermediate DFT+ predicts charge ordering which opens electronic band gaps and dampens, though does not eliminate, the tendency for phase separation. While charge ordering and an appreciable band gap are spurious for Li1/2CoO2, charge ordering is essential for retaining a phase stable system, as found in experiment, at reasonable values of . This deficiency appears to be a manifestation of the Hartree-Fock treatment of the interaction energy within DFT+, whereby static ordering is required to properly capture the energetics of strong electronic correlations. Indeed, it is demonstrated that the origin of the charge ordering arises from interaction energy within DFT+, as opposed to the double counting correction. Structural relaxations, which similarly only reduce the magnitude of the -induced destabilization of intermediate compositions, have a more significant impact on LixFePO4 than LixCoO2 due to the stronger electron-lattice coupling. The same generic formation energy behavior is observed in LixCoPO4, for which experiment dictates that a stable intermediate- compound exists unlike for isostructural LixFePO4.
The Li order-disorder transition temperature of Li1/2CoO2 behaves erratically when computed using SQS supercells within DFT+ as a result of charge ordering; severe overestimations are not uncommon. Along with a lack of experimental evidence and the induction of a spurious insulating state, this further supports the notion that static charge ordering is likely an unphysical artifact of the method. Future work should focus on improved methods for predicting total energies in realistic correlated electron materials using dynamical mean-field theory or other approaches. Given that many of the deficiencies that we have identified in this study appear to be associated with the Hartree-Fock treatment of the interaction energy within DFT+, it is likely that DFT+DMFT could offer substantial improvements.
Acknowledgements.
This research used resources of the National Energy Research Scientific Computing Center, a DOE Office of Science User Facility supported by the Office of Science of the U.S. Department of Energy under Contract No. DE-AC02-05CH11231. E.B.I. gratefully acknowledges support from the U.S. Department of Energy Computational Science Graduate Fellowship (Grant No. DE-FG02-97ER25308).References
- Hohenberg and Kohn (1964) P. Hohenberg and W. Kohn, Phys. Rev. 136, B864 (1964).
- Kohn and Sham (1965) W. Kohn and L. J. Sham, Phys. Rev. 140, A1133 (1965).
- Kotliar and Vollhardt (2004) G. Kotliar and D. Vollhardt, Phys. Today 57, 53 (2004).
- Morosan et al. (2012) E. Morosan, D. Natelson, A. H. Nevidomskyy, and Q. Si, Adv. Mater. 24, 4896 (2012).
- Mott (1968) N. F. Mott, Rev. Mod. Phys. 40, 677 (1968).
- Imada et al. (1998) M. Imada, A. Fujimori, and Y. Tokura, Rev. Mod. Phys. 70, 1039 (1998).
- Bednorz and Müller (1986) J. G. Bednorz and K. A. Müller, Z. Phys. B 64, 189 (1986).
- Ramirez (1997) A. P. Ramirez, J. Phys.: Condens. Matter 9, 8171 (1997).
- Coleman (2007) P. Coleman, in Handbook of Magnetism and Advanced Magnetic Materials (John Wiley & Sons, Ltd., 2007).
- Jones and Gunnarsson (1989) R. O. Jones and O. Gunnarsson, Rev. Mod. Phys. 61, 689 (1989).
- Jones (2015) R. Jones, Rev. Mod. Phys. 87, 897 (2015).
- Kotliar et al. (2006) G. Kotliar, S. Y. Savrasov, K. Haule, V. S. Oudovenko, O. Parcollet, and C. A. Marianetti, Rev. Mod. Phys. 78, 865 (2006).
- Anisimov et al. (1997) V. I. Anisimov, F. Aryasetiawan, and A. I. Lichtenstein, J. Phys. Condens. Matter 9, 767 (1997).
- Momma and Izumi (2011) K. Momma and F. Izumi, J. Appl. Crystallogr. 44, 1272 (2011).
- Mizushima et al. (1980) K. Mizushima, P. Jones, P. Wiseman, and J. Goodenough, Mater. Res. Bull. 15, 783 (1980).
- Reimers and Dahn (1992) J. N. Reimers and J. R. Dahn, J. Electrochem. Soc. 139, 2091 (1992).
- Van der Ven et al. (1998) A. Van der Ven, M. K. Aydinol, G. Ceder, G. Kresse, and J. Hafner, Phys. Rev. B 58, 2975 (1998).
- Wolverton and Zunger (1998) C. Wolverton and A. Zunger, Phys. Rev. Lett. 81, 606 (1998).
- Padhi et al. (1997a) A. K. Padhi, K. S. Nanjundaswamy, and J. B. Goodenough, J. Electrochem. Soc. 144, 1188 (1997a).
- Padhi et al. (1997b) A. K. Padhi, K. S. Nanjundaswamy, and J. B. Goodenough, J. Electrochem. Soc. 144, 1609 (1997b).
- Delacourt et al. (2005) C. Delacourt, P. Poizot, J.-M. Tarascon, and C. Masquelier, Nat. Mater. 4, 254 (2005).
- Dodd et al. (2006) J. L. Dodd, R. Yazami, and B. Fultz, Electrochem. Solid-State Lett. 9, A151 (2006).
- Zhou et al. (2004a) F. Zhou, C. A. Marianetti, M. Cococcioni, D. Morgan, and G. Ceder, Phys. Rev. B 69, 201101 (2004a).
- Ong et al. (2011) S. P. Ong, V. L. Chevrier, and G. Ceder, Phys. Rev. B 83, 075112 (2011).
- Zhou et al. (2006) F. Zhou, T. Maxisch, and G. Ceder, Phys. Rev. Lett. 97, 155704 (2006).
- Andriyevsky et al. (2014) B. Andriyevsky, K. Doll, and T. Jacob, Phys. Chem. Chem. Phys. (2014).
- Aykol and Wolverton (2014) M. Aykol and C. Wolverton, Phys. Rev. B 90, 115105 (2014).
- Aykol et al. (2015) M. Aykol, S. Kim, and C. Wolverton, J. Phys. Chem. C 119, 19053 (2015).
- Seo et al. (2015) D.-H. Seo, A. Urban, and G. Ceder, Phys. Rev. B 92, 115118 (2015).
- Visscher (1974) P. B. Visscher, Phys. Rev. B 10, 943 (1974).
- Marder et al. (1990) M. Marder, N. Papanicolaou, and G. C. Psaltakis, Phys. Rev. B 41, 6920 (1990).
- Himmetoglu et al. (2014) B. Himmetoglu, A. Floris, S. de Gironcoli, and M. Cococcioni, Int. J. Quant. Chem. 114, 14 (2014).
- Ceperley and Alder (1980) D. M. Ceperley and B. J. Alder, Phys. Rev. Lett. 45, 566 (1980).
- Vosko et al. (1980) S. H. Vosko, L. Wilk, and M. Nusair, Can. J. Phys. 58, 1200 (1980).
- Perdew and Zunger (1981) J. P. Perdew and A. Zunger, Phys. Rev. B 23, 5048 (1981).
- Perdew and Wang (1992) J. P. Perdew and Y. Wang, Phys. Rev. B 45, 13244 (1992).
- Perdew et al. (1992) J. P. Perdew, J. A. Chevary, S. H. Vosko, K. A. Jackson, M. R. Pederson, D. J. Singh, and C. Fiolhais, Phys. Rev. B 46, 6671 (1992).
- Perdew et al. (1996) J. P. Perdew, K. Burke, and M. Ernzerhof, Phys. Rev. Lett. 77, 3865 (1996).
- Dudarev et al. (1998) S. L. Dudarev, G. A. Botton, S. Y. Savrasov, C. J. Humphreys, and A. P. Sutton, Phys. Rev. B 57, 1505 (1998).
- Liechtenstein et al. (1995) A. I. Liechtenstein, V. I. Anisimov, and J. Zaanen, Phys. Rev. B 52, R5467 (1995).
- Chen et al. (2015) J. Chen, A. J. Millis, and C. A. Marianetti, Phys. Rev. B 91, 241111 (2015).
- Park et al. (2015) H. Park, A. J. Millis, and C. A. Marianetti, Phys. Rev. B 92, 035146 (2015).
- Perdew et al. (1982) J. P. Perdew, R. G. Parr, M. Levy, and J. L. Balduz, Phys. Rev. Lett. 49, 1691 (1982).
- Anisimov et al. (1993) V. I. Anisimov, I. V. Solovyev, M. A. Korotin, M. T. Czyżyk, and G. A. Sawatzky, Phys. Rev. B 48, 16929 (1993).
- Cococcioni and de Gironcoli (2005) M. Cococcioni and S. de Gironcoli, Phys. Rev. B 71, 035105 (2005).
- Gull et al. (2011) E. Gull, A. J. Millis, A. I. Lichtenstein, A. N. Rubtsov, M. Troyer, and P. Werner, Rev. Mod. Phys. 83, 349 (2011).
- Haule (2007) K. Haule, Phys. Rev. B 75, 155113 (2007).
- Park et al. (2014a) H. Park, A. J. Millis, and C. A. Marianetti, Phys. Rev. B 89, 245133 (2014a).
- Park et al. (2014b) H. Park, A. J. Millis, and C. A. Marianetti, Phys. Rev. B 90, 235103 (2014b).
- Isaacs and Marianetti (2016) E. B. Isaacs and C. A. Marianetti, Phys. Rev. B 94, 035120 (2016).
- Aydinol et al. (1997) M. K. Aydinol, A. F. Kohan, G. Ceder, K. Cho, and J. Joannopoulos, Phys. Rev. B 56, 1354 (1997).
- Kresse and Hafner (1994) G. Kresse and J. Hafner, Phys. Rev. B 49, 14251 (1994).
- Kresse and Hafner (1993) G. Kresse and J. Hafner, Phys. Rev. B 47, 558 (1993).
- Kresse and Furthmüller (1996a) G. Kresse and J. Furthmüller, Phys. Rev. B 54, 11169 (1996a).
- Kresse and Furthmüller (1996b) G. Kresse and J. Furthmüller, Comput. Mater. Sci. 6, 15 (1996b).
- Blöchl (1994) P. E. Blöchl, Phys. Rev. B 50, 17953 (1994).
- Kresse and Joubert (1999) G. Kresse and D. Joubert, Phys. Rev. B 59, 1758 (1999).
- Methfessel and Paxton (1989) M. Methfessel and A. T. Paxton, Phys. Rev. B 40, 3616 (1989).
- Blöchl et al. (1994) P. E. Blöchl, O. Jepsen, and O. K. Andersen, Phys. Rev. B 49, 16223 (1994).
- Zunger et al. (1990) A. Zunger, S.-H. Wei, L. G. Ferreira, and J. E. Bernard, Phys. Rev. Lett. 65, 353 (1990).
- van de Walle et al. (2002) A. van de Walle, M. Asta, and G. Ceder, Calphad 26, 539 (2002).
- van de Walle (2009) A. van de Walle, Calphad 33, 266 (2009).
- Johnston et al. (1958) W. D. Johnston, R. R. Heikes, and D. Sestrich, J. Phys. Chem. Solids 7, 1 (1958).
- Orman and Wiseman (1984) H. J. Orman and P. J. Wiseman, Acta Crystallogr. Sect. C 40, 12 (1984).
- Amatucci et al. (1996) G. G. Amatucci, J. M. Tarascon, and L. C. Klein, J. Electrochem. Soc. 143, 1114 (1996).
- van Elp et al. (1991) J. van Elp, J. L. Wieland, H. Eskes, P. Kuiper, G. A. Sawatzky, F. M. F. de Groot, and T. S. Turner, Phys. Rev. B 44, 6090 (1991).
- Ménétrier et al. (1999) M. Ménétrier, I. Saadoune, S. Levasseur, and C. Delmas, J. Mater. Chem. 9, 1135 (1999).
- Ménétrier et al. (2008) M. Ménétrier, D. Carlier, M. Blangero, and C. Delmas, Electrochem. Solid-State Lett. 11, A179 (2008).
- de Vaulx et al. (2007) C. de Vaulx, M.-H. Julien, C. Berthier, S. Hébert, V. Pralong, and A. Maignan, Phys. Rev. Lett. 98, 246402 (2007).
- Motohashi et al. (2007) T. Motohashi, Y. Katsumata, T. Ono, R. Kanno, M. Karppinen, and H. Yamauchi, Chem. Mater. 19, 5063 (2007).
- Kawasaki et al. (2009) S. Kawasaki, T. Motohashi, K. Shimada, T. Ono, R. Kanno, M. Karppinen, H. Yamauchi, and G.-q. Zheng, Phys. Rev. B 79, 220514 (2009).
- Santoro and Newnham (1967) R. P. Santoro and R. E. Newnham, Acta Crystallogr. 22, 344 (1967).
- Rousse et al. (2003) G. Rousse, J. Rodriguez-Carvajal, S. Patoux, and C. Masquelier, Chem. Mater. 15, 4082 (2003).
- Tang and Holzwarth (2003) P. Tang and N. A. W. Holzwarth, Phys. Rev. B 68, 165107 (2003).
- Shi et al. (2005) S. Shi, C. Ouyang, Z. Xiong, L. Liu, Z. Wang, H. Li, D.-s. Wang, L. Chen, and X. Huang, Phys. Rev. B 71, 144404 (2005).
- Zaghib et al. (2007) K. Zaghib, A. Mauger, J. B. Goodenough, F. Gendron, and C. M. Julien, Chem. Mater. 19, 3740 (2007).
- Zhou et al. (2004b) F. Zhou, K. Kang, T. Maxisch, G. Ceder, and D. Morgan, Solid State Comm. 132, 181 (2004b).
- Zhou et al. (2004c) F. Zhou, M. Cococcioni, C. A. Marianetti, D. Morgan, and G. Ceder, Phys. Rev. B 70, 235121 (2004c).
- Motohashi et al. (2009) T. Motohashi, T. Ono, Y. Sugimoto, Y. Masubuchi, S. Kikkawa, R. Kanno, M. Karppinen, and H. Yamauchi, Phys. Rev. B 80, 165114 (2009).
- Miyoshi et al. (2010) K. Miyoshi, C. Iwai, H. Kondo, M. Miura, S. Nishigori, and J. Takeuchi, Phys. Rev. B 82, 075113 (2010).
- Ou-Yang et al. (2012) T. Y. Ou-Yang, F.-T. Huang, G. J. Shu, W. L. Lee, M.-W. Chu, H. L. Liu, and F. C. Chou, Phys. Rev. B 85, 035120 (2012).
- Marianetti et al. (2004) C. A. Marianetti, G. Kotliar, and G. Ceder, Phys. Rev. Lett. 92, 196405 (2004).
- Ellis et al. (2006) B. Ellis, L. K. Perry, D. H. Ryan, and L. F. Nazar, J. Am. Chem. Soc. 128, 11416 (2006).
- Amine et al. (2000) K. Amine, H. Yasuda, and M. Yamachi, Electrochem. Solid-State Lett. 3, 178 (2000).
- Bramnik et al. (2007) N. N. Bramnik, K. Nikolowski, C. Baehtz, K. G. Bramnik, and H. Ehrenberg, Chem. Mater. 19, 908 (2007).
- Ehrenberg et al. (2009) H. Ehrenberg, N. N. Bramnik, A. Senyshyn, and H. Fuess, Solid State Sci. 11, 18 (2009).
- Strobridge et al. (2014) F. C. Strobridge, R. J. Clément, M. Leskes, D. S. Middlemiss, O. J. Borkiewicz, K. M. Wiaderek, K. W. Chapman, P. J. Chupas, and C. P. Grey, Chem. Mater. 26, 6193 (2014).
- Santoro et al. (1966) R. P. Santoro, D. J. Segal, and R. E. Newnham, J. Phys. Chem. Solids 27, 1192 (1966).
- Chevrier et al. (2010) V. L. Chevrier, S. P. Ong, R. Armiento, M. K. Y. Chan, and G. Ceder, Phys. Rev. B 82, 075122 (2010).
- Yamada et al. (2001) A. Yamada, S. C. Chung, and K. Hinokuma, J. Electrochem. Soc. 148, A224 (2001).
- Lu et al. (1994) Z. W. Lu, D. B. Laks, S.-H. Wei, and A. Zunger, Phys. Rev. B 50, 6642 (1994).
- Jiang et al. (2004) C. Jiang, C. Wolverton, J. Sofo, L.-Q. Chen, and Z.-K. Liu, Phys. Rev. B 69, 214202 (2004).
- Jiang et al. (2005) C. Jiang, D. J. Sordelet, and B. Gleeson, Phys. Rev. B 72, 184203 (2005).
- Jiang et al. (2009) C. Jiang, C. R. Stanek, K. E. Sickafus, and B. P. Uberuaga, Phys. Rev. B 79, 104203 (2009).