New High- Fermi BL Lacs with the Photometric Dropout Technique
Abstract
Determining redshifts for BL Lacertae (BL Lac) objects using the traditional spectroscopic method is challenging due to the absence of strong emission lines in their optical spectra. We employ the photometric dropout technique to determine redshifts for this class of blazars using the combined 13 broad-band filters from Swift-UVOT and the multi-channel imager GROND at the MPG 2.2 m telescope at ESO’s La Silla Observatory. The wavelength range covered by these 13 filters extends from far ultraviolet to the near-Infrared. We report results on 40 new Fermi detected BL Lacs with the photometric redshifts determinations for 5 sources, with 3FGL J1918.2-4110 being the most distant in our sample at =2.16. Reliable upper limits are provided for 20 sources in this sample. Using the highest energy photons for these Fermi-LAT sources, we evaluate the consistency with the Gamma-ray horizon due to the extragalactic background light.
1 Introduction
Blazars represent a class of active galactic nuclei (AGNs) with relativistic jets pointing along our line of sight (Blandford & Rees, 1978). Their spectral energy distribution (SED) exhibits two characteristic broad bumps, which are attributed to synchrotron emission at the lower energies (Infrared to X-ray) and synchrotron self Compton at the higher energies (X-ray to -rays, e.g. Maraschi et al., 1994). On the basis of their optical spectroscopic characteristics, blazars can be further classified into two types : Flat Spectrum Radio Quasars (FSRQs), characterized by broad emission lines and BL Lacertae objects (BL Lacs), with no or at best weak emission lines (equivalent width 5 Å, Urry & Padovani 1995). Furthermore, another classification scheme for blazars was introduced by Abdo et al. (2010) based on the location of their synchrotron peak frequency, . The authors subdivided these objects into three classes: high-synchrotron-peaked blazars (HSP) for Hz, intermediate-synchrotron-peak (ISP) for Hz and low-synchrotron-peak (LSP) for Hz. Most of the FSRQs fall in the LSP category, but half the population of BL Lacs display peak synchrotron frequencies Hz (Ackermann et al., 2015). These high values of imply the presence of relativistic multi-TeV electrons, therefore making BL Lacs very bright -ray sources with substantial emission above 10 GeV (Ackermann et al., 2013).
Blazars play an important role in the study of the Extragalactic Background Light (EBL), which represents the integrated light from all the stars and other compact objects since the re-ionization epoch. The photons from blazars are attenuated by EBL photons through production of electron-positron pairs, which imprint a characteristic signature in the spectra of these -ray sources (Stecker et al., 1992). This feature in blazar spectra enables us to constrain the EBL and its evolution with cosmic time (Aharonian et al., 2006; Ackermann et al., 2012; Domínguez et al., 2013). In the case of FSRQs, the presence of broad emission lines implies the presence of a disk, whose UV radiation field could attenuate -ray photons, thereby making it a challenging task to differentiate the attenuation signal from the EBL photons from the circum-nuclear one. On the other hand, absence of broad emission lines in BL Lacs in addition to the abundance of photons above 10 GeV render them the perfect class of blazars to explore the EBL (Domínguez & Ajello, 2015). To enable such studies, redshift measurements for these sources are essential. In particular, high redshift BL Lacs are critical for probing the EBL, since the strength of the attenuation increases with redshift. Moreover, high- blazars are crucial for testing the EBL evolution, which at present is poorly constrained. Estimating redshifts of BL Lacs in the traditional spectroscopic way is yet another challenge, because of the weakness, or even absence of lines (Shaw et al., 2013).
Rau et al. (2012) initiated a program to determine redshifts for BL Lac sources via a photometric technique. The underlying principle for this photometric redshift (photo-) determination is based on the absorption of UV photons by neutral hydrogen along the line of sight, which absorbs photons bluewards of the Lyman limit. This leads to a dropout in the flux at the Lyman limit whose position in the SED can be used to determine the photo-. This approach was applied by Rau et al. (2012) for a sample of 103 blazars.
The immediate aim of this study is to determine photo-s of high- ( 1.3, which is the lower limit measurable with this method) BL Lacs to increase the sample in the important high redshift regime. Only 19 BL Lacs with 1.3 are known, of which 13 are reported in the third catalog of Fermi-detected AGNs (3LAC, Ackermann et al. (2015)). A total of 9 BL Lacs were reported in Rau et al. (2012), of which three sources are provided among the 13 in the 3LAC catalog. Therefore, Rau et al. (2012) provided 6 new high- BL Lacs with the photometric technique.
The outline of this paper is as follows: Section 2 explains the details of observations. The data analysis procedure is explained in section 3. The resulting high- BL Lacs parameters are reported in section 4 and the interpretation of our results is presented in section 5. A flat CDM cosmological model with H0=71 km s-1 Mpc-1, =0.27 and =0.73 was adopted for all the calculations in this work in order to be consistent with the work presented in Finke (2013).
2 Observations
2.1 Sample Selection
Our sample was selected from sources classified as BL Lacs in the third catalog of Fermi detected sources (3FGL, Acero et al. 2015) without a measured redshift. The selection procedure was based on two main criteria, one being that only sources with Declination 25∘ were chosen in order to accommodate the visibility from the ground based telescope, situated in Chile. The second selection criterion was the minimization of the Galactic foreground reddening, ensured by selecting objects away from the Galactic Plane ( 10 ∘). Here we report on the 40 sources observed so far whose basic properties are presented in Table 1.
2.2 Facilities
The Swift satellite (Gehrels et al., 2004) and MPG 2.2 m telescope at ESO La Silla, Chile were employed for conducting the observations. All sources were observed in 13 filters; (uvw2, uvm2, uvw1, u, b, v) of Swift-UVOT (The Ultraviolet and Optical Telescope, Roming et al. 2005) and 7 optical-IR filters ( ) of GROND (Gamma-Ray Optical/Near-infrared Detector, Greiner et al. 2008). The resulting 13-filter SED covers a wavelength range of 1600 Å- 20000 Å. The main advantage of using the overlap of two filters : from GROND and b from UVOT is to cross-calibrate the two instruments for the combined data analysis.
2.3 Observing Strategy
GROND observations were performed as close to the Swift observations as possible. While truly simultaneous observations were rarely feasible due to ground visibility constraints, both instruments often observed within 1-2 days of each other. Swift-UVOT observed in each of its six filters in sequence, while GROND conducted observations in all the 7 filters, simultaneously, which is very crucial for blazars, due to their variable nature. The typical integration times for Swift were 100 s each in u, b, v and 200, 240 and 400 s in uvw1, uvm2, uvw2, respectively, although the exposure times changed based on the brightness of each object. A typical GROND observation had an integration time of 2 min in and 4.0 min in .
3 Data Analysis
3.1 Swift-UVOT
Swift data were processed through the standard UVOT pipeline procedure (Poole et al., 2007) in order to remove the bad pixels, to flat-field and to correct for the system response. The magnitude extraction per filter was performed with the UVOT task, UVOTMAGHIST. A circular region was selected for the aperture extraction with variable radius in order to maximize the signal to noise ratio. The resulting magnitudes in each filter were corrected for Galactic extinction, utilizing table 5 presented in Kataoka et al. (2008). The final magnitudes were converted to the AB system and the results are presented in Table 2.
3.2 GROND
The data reduction procedure for GROND is described in detail in Krühler et al. (2008), and here it is only mentioned briefly. The point spread function (PSF) photometric technique was used for filters, whereas due to the undersampled PSF in the near infrared, the standard aperture extraction technique was applied for J, H, Ks photometry. The 4 optical filters were calibrated with the stars in the SDSS Data Release 8 (Aihara et al., 2011), which provides the final magnitudes in the AB system. 2MASS stars (Skrutskie et al., 2006) were employed for calibration of the near-IR filters. The correction for the Galactic foreground extinction was performed with measurements in Schlafly & Finkbeiner (2011). The resulting data were converted to the AB system (Table 3).
3.3 Variability Correction
Blazars, in general, exhibit emission which varies on time scale of a few minutes to years. This variability can have a significant impact on the redshift determination via the photometric technique. GROND data are not affected by intrinsic variability as the observations are performed in all seven filters simultaneously. However, since Swift-UVOT cycles through every filter, in addition to the non-simultaneous GROND-Swift observations, these variations in the emission could add to the existing uncertainties. Rau et al. (2012) established that the inherent blazar variability introduces a systematic uncertainty of m = 0.1 mag for each UVOT filter. The other important factor to consider is that the total SED is obtained by combining the UVOT and GROND data, which are two different instruments, which thus need to be calibrated against each other. Krühler et al. (2011) performed this task by combining Swift-UVOT and GROND filter curves, utilizing their spectral overlap and established the following calibration relationship:
| (1) |
This equation is based on the assumption that a BL Lac SED is represented by a power law and that its slope does not change over the UV-IR regime. This relation which is valid for -1 2 was applied to all the UVOT filters before SED fitting. The UV-Opt-IR SED of BL Lacs is thought to be dominated by non-thermal synchrotron emission. It can be modeled over the wavelength interval used here as a powerlaw spectrum. Our 13 band photometry covers this energy regime of the SED of a BL Lac, and moreover the absence of any broad lines makes this approximation valid in particular for these kind of blazars. In addition, stellar templates were fitted to these sources to check for non-powerlaw behavior as explained in the next section.
3.4 SED fitting
The LePhare v.2.2 program 111http://www.cfht.hawaii.edu/ arnouts/lephare.html (Arnouts et al., 1999; Ilbert et al., 2006) was employed to determine the photometric redshifts for these objects. This program evaluates the difference between the observational and theoretical data based on statistic. We selected three separate template libraries to fit the data, independently. Our first library is comprised of 60 power-law SED templates of the form , such that ranged from 0 to 3 in steps of 0.05, under the assumption that the UV-Optical-NearInfrared regime for BL Lacs can be fit with a single power-law template. In addition, a library of galaxies and galaxy/AGN hybrids (Salvato et al., 2009, 2011) as well as a stellar library using templates from Pickles (1998), Bohlin et al. (1995) and Chabrier et al. (2000) were used. The results from the first two libraries are presented in Table 4. None of our SEDs required a contribution from the stellar libraries.
4 Results
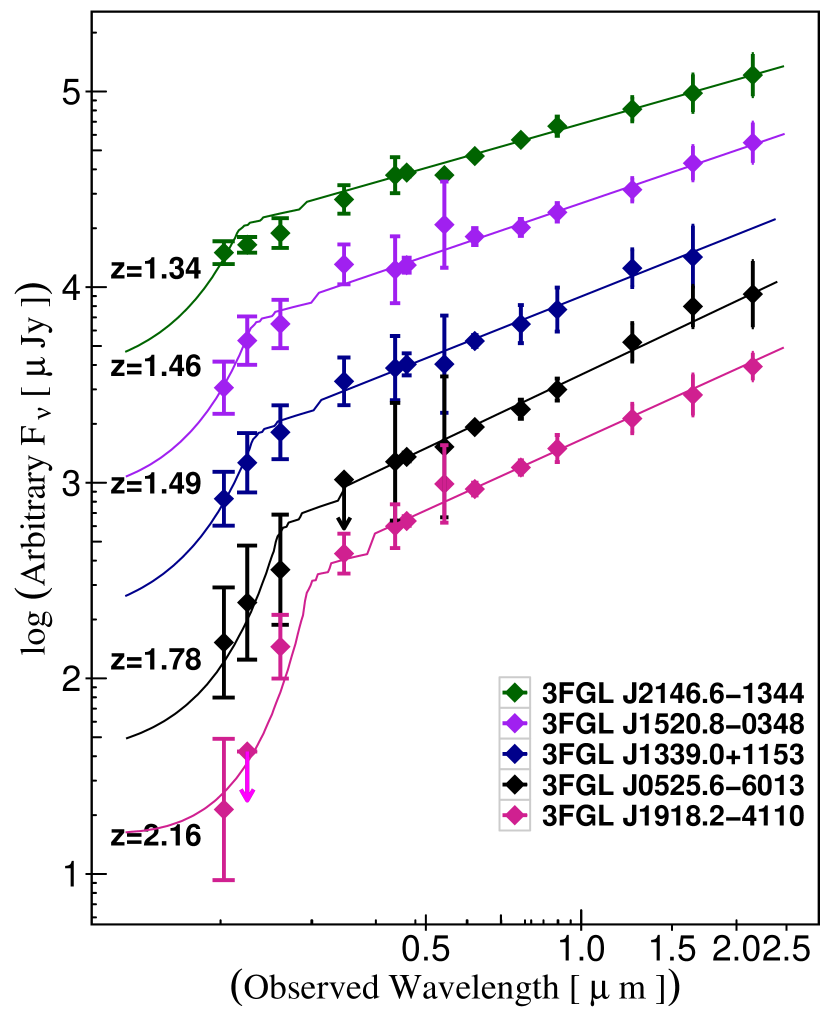
The results of SED fitting for 40 sources are presented in Table 4. The reliability of our photometric results was determined by Monte Carlo simulations performed in Rau et al. (2012), where 27000 test SEDs were simulated with ranging from 0.5-2.0 and redshifts 0 to 4. These SEDs were supplied to LePhare to calculate the redshifts and were then compared to the input values. The authors concluded that for sources with simulated redshifts, 1.2, the photometric redshift reproduced the input value within an accuracy of . In addition, a more quantitative selection procedure was applied, which was based on a quantity, P at , the integral of the probability distribution function. This quantity describes the probability that the redshift of a source is within a factor of 0.1(1+z) of the best fit value. Measurements with P 90% were considered reliable photometric redshifts. We apply both selection criteria defined above to our SED fitting, which resulted in determining photometric redshifts for 5 sources and establishing upper limits for 20 of them, which is presented in Table 4. The -UVOT and GROND spectral energy distributions for the new 5 high- sources, i.e., 3FGL J0525.6-6013, 3FGL J1339.0+1153, 3FGL J1520.8-0348, 3FGL J1918.2-4110, 3FGL J2146.6-1344 is shown are Figure 1.
5 Discussion
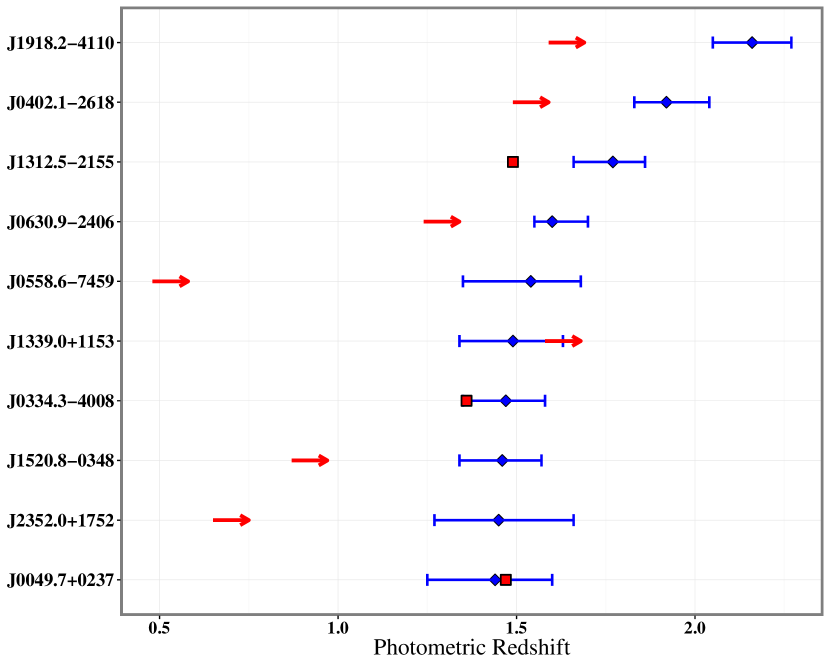
Ackermann et al. (2015) reported 604 BL Lacs out of which 326 sources have redshift measurements of which only 13 with high- (z 1.3). 3 of these sources were reported among the 9 high- BL Lacs by Rau et al. (2012) utilizing the photometric redshift technique. Our study is a continuation of Rau et al. (2012), who calculate the redshifts for BL Lacs with photometric technique, which increases the sample size by 30% by finding 5 BL Lacs at from our sample of 40 sources. 50% of the total number of 24 known high- BL Lacs (5 from this work and 6 from Rau et al. (2012)’s work) are determined by the photo- method. A comparison between the spectroscopic and photometric redshift determinations for 1.3 BL Lacs is presented in Figure 2. As seen in this figure, both approaches are consistent with each other. The spectroscopic redshift for the source, 3FGL J1312.5-2155 has been determined by using the absorption features, i.e., C IV and Mg II (Ryabinkov et al., 2003), which could possibly imply a lower limit. This comparison demonstrates that our photometric campaign is an efficient way to uncover rare high-redshift BL Lacs.
5.1 Blazar Sequence
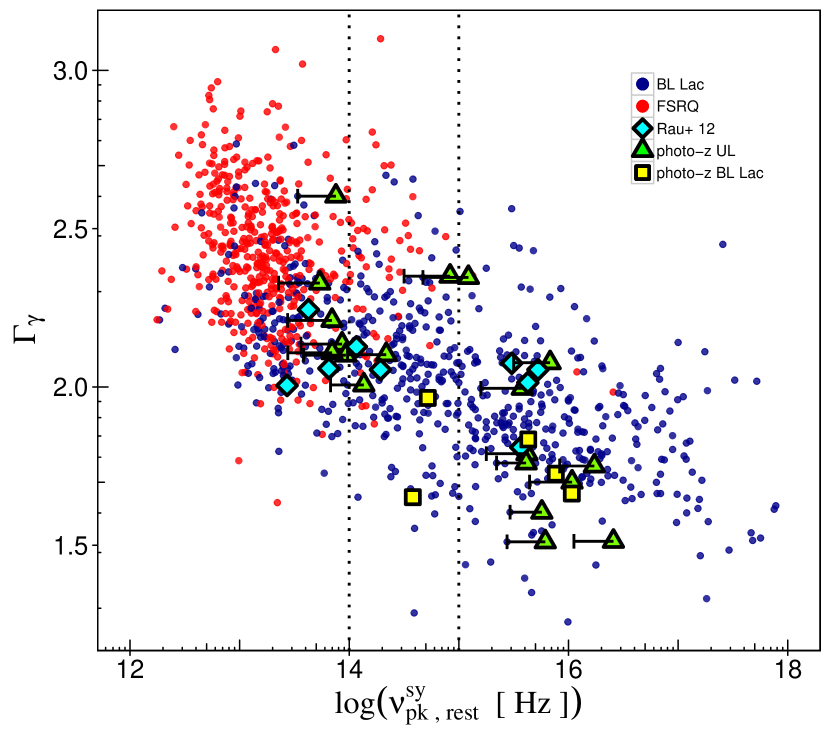
“Blazar Sequence” is a scheme, which suggests the existence of a unified model to represent all classes of blazars. Several authors e.g. Maraschi et al. (1995), Sambruna et al. (1996), Fossati et al. (1998) proposed this unification idea through observed SEDs for blazars. These authors concluded that the blazar phenomenon is primarily governed by the total luminosity, which is the best indicator for determining the physical properties as well as the radiation mechanisms in these sources. Fossati et al. (1998) noticed several anti-correlations e.g. and luminosity at this peak (), and the Compton Dominance (CD), and the -ray photon index (). These results indicate that the blazar family lined up on a sequence where more luminous blazars had lower synchrotron peak frequencies, but dominant -ray emission (i.e. CD 1), generally the case for powerful FSRQs. On the other hand, the less luminous, high-peaked sources (typically BL Lac objects) have CD 1. In other words, blazar sequence predicts the non-existence of high frequency peaked, highly luminous BL Lac objects. A theoretical justification of these correlations are discussed in Ghisellini et al. (1998).
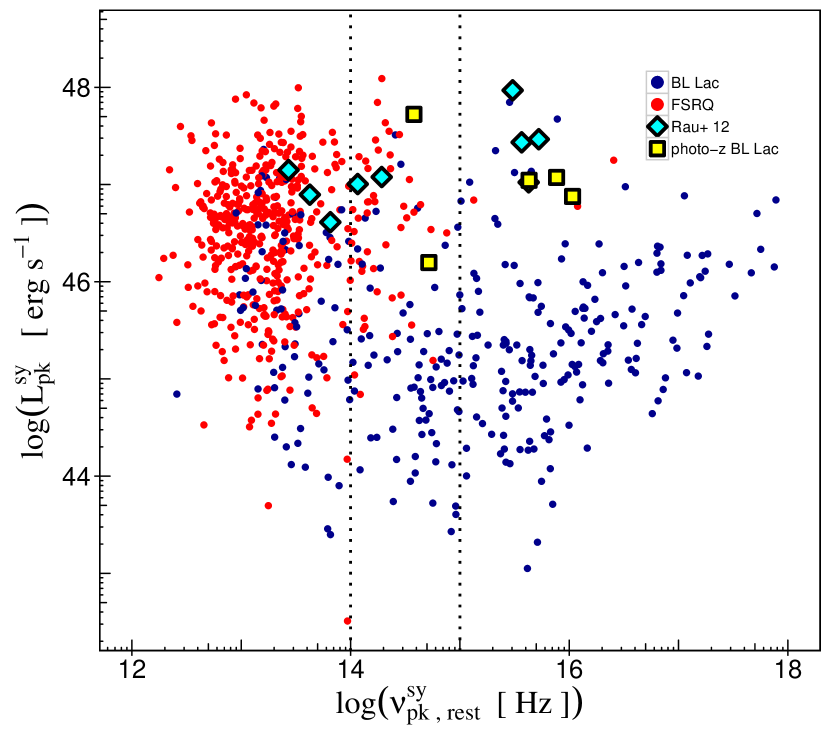
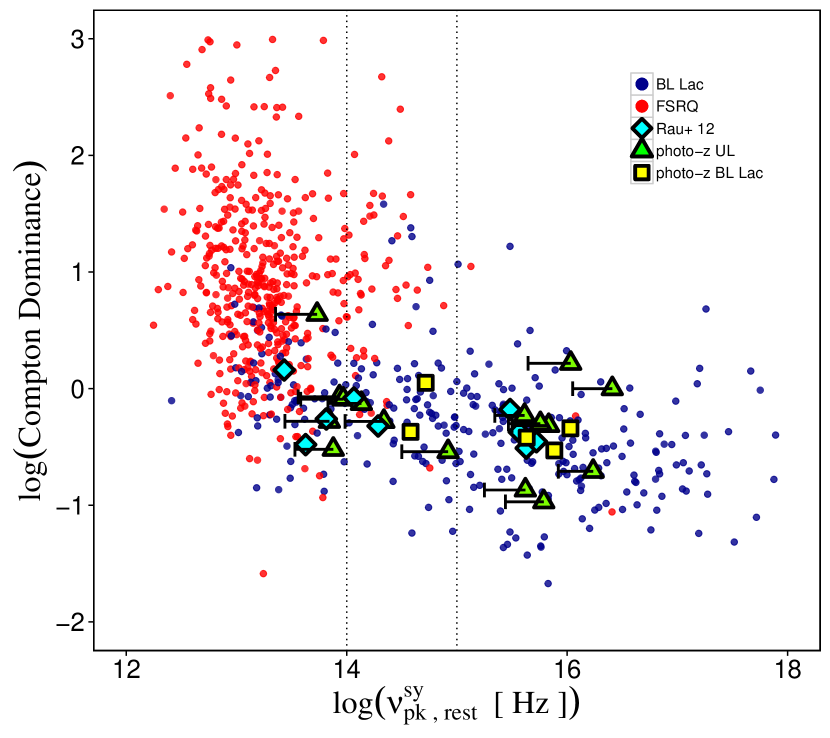
The concept of a Blazar sequence is an interesting but still debated idea (e.g. Padovani et al. (2012); Ghisellini et al. (2012)). The motivation here is to test how the new high-redshift BL Lacs presented in this study fit in the proposed blazar sequence. We utilize the 3LAC (Ackermann et al., 2015) catalog to extract relevant SED parameters, e.g., , , Compton Dominance and -ray photon index, for all the blazars present in 3LAC data. was calculated using equation 4 in Abdo et al. (2010) assuming a flat spectrum for blazars in the radio regime, where the radio flux was obtained from Table 8 in Ackermann et al. (2015). All the other parameters were extracted from Table 4 in Ackermann et al. (2015). For those sources in our sample for which CD values were not provided, we calculated them with an online SED fitting tool111http://tools.asdc.asi.it/SED/. We calculate luminosities at the peak synchrotron frequencies as they would appear in their rest frame. The obtained parameters are presented in Figure 3, 4 and 5. It should be noted that only blazars with known redshifts are plotted in these figures. As can be seen in Figure 3, the five high redshift BL Lac objects (shown with squares) tend to occupy the high , and a relatively high region among the known blazar population. We find that all of our high- BL Lacs are consistent with the known anti-correlation of CD and (see Figure 4) with for all the five high- BL Lacs, as generally seen in this class of blazars. These findings are in agreement with the theoretical model of Finke (2013) which suggests the existence of sources with high and high but having a CD value less than unity. Furthermore, these objects are hard -ray spectrum sources and we do not find any exception when placed in the -ray photon index vs. diagram (Figure 5).
.
5.2 Fermi Blazar Divide
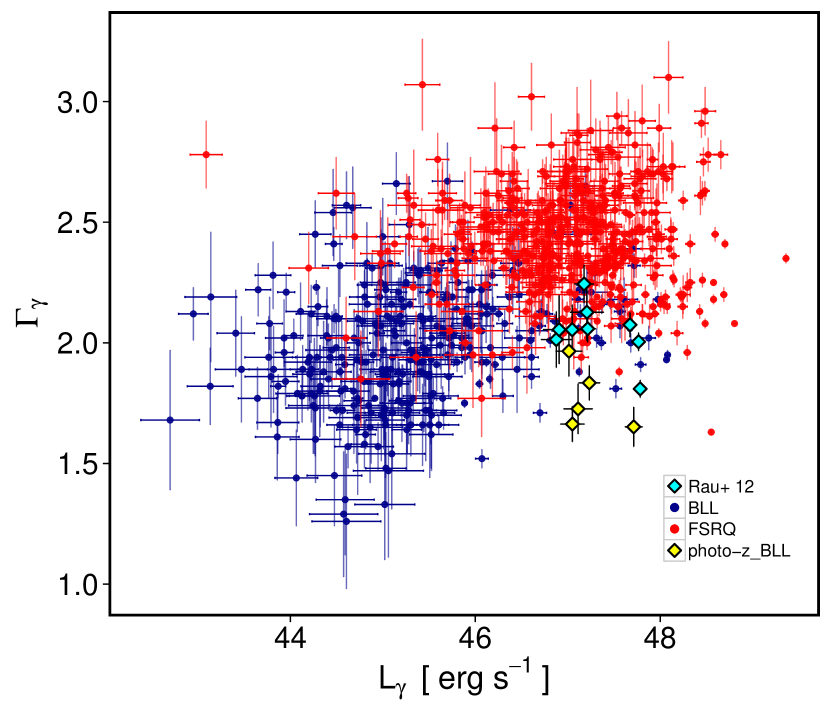
Ghisellini et al. (2009) utilized 100 blazars from the first 3-month survey of Fermi-LAT data (Abdo et al., 2009) and noticed a division between FSRQs and BL Lacs by comparing their -ray spectral indices () to the -ray luminosities (Lγ). These observations revealed that BL Lacs exhibited harder spectra ( 2.2) and were less luminous ( erg s-1) than FSRQs. It was suggested that this “Fermi Blazar Divide” could be interpreted primarily based on the different mass accretion rates with FSRQs having high accretion rates.
.
|
 |
|---|---|
|
Moreover, this division between two groups of blazars on - plane has been discussed by various authors, e.g., Padovani et al. (2012), Ghisellini et al. (2012). The former authors noticed high and hard for some of the BL Lacs from Rau et al. (2012), which was argued against by the latter suggesting that although these BL Lacs fall into the higher end of - plane, yet they are consistent with the separation of two populations. In particular, Ghisellini et al. (2012) proposed that the emission region in these sources may lie outside the broad line region (BLR) and therefore the resultant SEDs are similar to BL Lacs. In other words, such objects are ‘blue’ FSRQs with the broad emission lines in their optical spectra are swamped by high level of synchrotron emission.
In Figure 6, we show the variation of as a function of for 3LAC blazars. In this diagram, we also show high- BL Lacs obtained in this work and by Rau et al. (2012). The Lγ for all these sources were calculated using equation 1 in Ghisellini et al. (2009). Interestingly, as can be seen in Figure 6, all the five high- BL Lacs have a hard () and their -ray luminosities are erg s-1. Now, following Sbarrato et al. (2012), we have
| (2) |
where is the BLR luminosity. This indicates that for erg s-1, we have erg -1. Assuming a fraction 10% of the disk luminosity is reprocessed by the BLR, the disk luminosity is erg s-1. Since there is no estimate of the central black hole mass available in the literature for the five high- BL Lacs, we assume an average value of (e.g., Sbarrato et al., 2012).
This assumption implies , which makes their accretion disk radiatively efficient, similar to what is typically observed in powerful FSRQs. However, these quantities should be considered with some caution due to underlying assumptions (e.g., Sbarrato et al., 2012; Ghisellini et al., 2012) and we defer to a future multi-wavelength study for a more detailed discussion. Furthermore, although the of these BL Lac objects appears to be similar to FSRQs, yet they are consistent with a separation in the -ray photon index alone, a property that has been established and known since EGRET and it is more robust against the redshifts completeness of the redshift population (e.g. Hartman et al., 1999; Venters & Pavlidou, 2007).
5.3 The Extragalactic Background Light
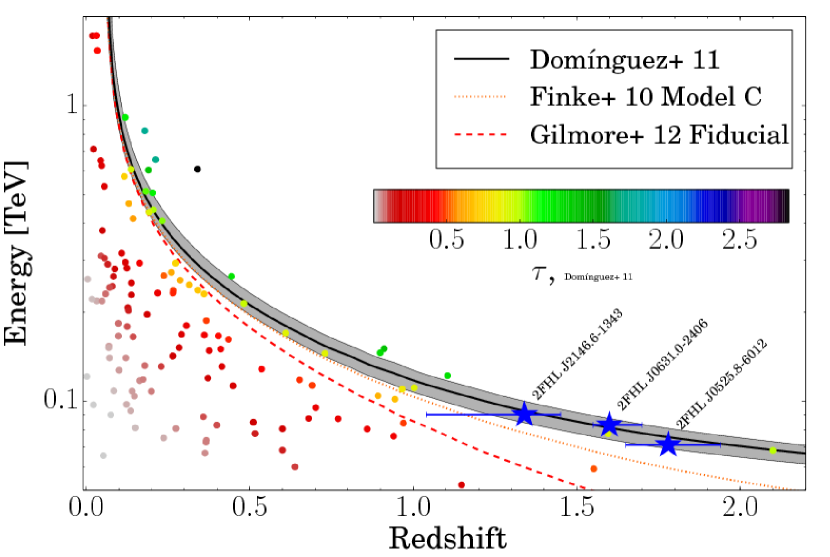
Increasing the sample size of high- BL Lacs is particularly important for probing the EBL , and to better understand the cosmic evolution of the blazar population (Ajello et al., 2012). Photons from sources at 1.3 and energy above 50 GeV have a probability % of interacting with the photons of the UV-optical component of the EBL that leads to the generation of an electron-positron pair. For this reason, we looked into which source of the entire photo- sample (5 sources from this paper and 6 from Rau et al., 2012) was also reported in the 2FHL catalog of Fermi-LAT sources detected above 50 GeV (Ackermann et al., 2016). We found three; 1FGL J2146.6134, CRATES J06302406 and SUMSS J052542601341. Their highest energy photons at 81 GeV, 83 GeV, and 71 GeV, respectively (reported in Ackermann et al., 2016) allow us to probe the cosmic -ray horizon (i.e. the distance at which , e.g. Domínguez et al. 2013). Figure 8 shows that those photons are consistent with the -ray horizon in the EBL model developed by Domínguez et al. (2011). It is important to realize that these high- sources provide a valuable constraint on the -ray horizon in a region where the sources are scarce.
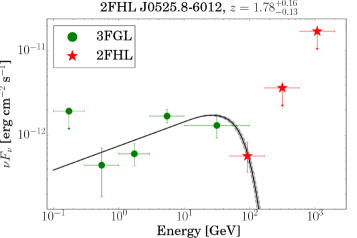
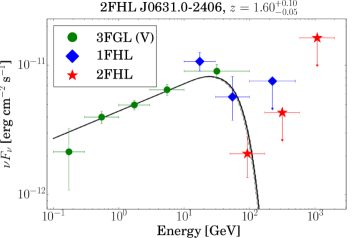
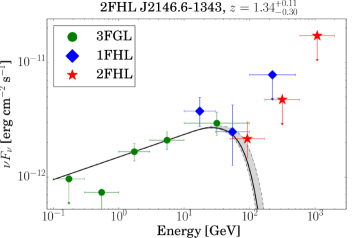
Figure 7 shows the -ray SED of 1FGL J2146.6134, CRATES J06302406 and SUMSS J052542601341 obtained combining 3FGL, 1FHL and 2FHL data (Acero et al., 2015; Ackermann et al., 2013, 2016). For each source, we fitted a power law to the 3FGL data and applied to it EBL absorption (in the form ) adopting the Domínguez et al. (2011) model and taking the redshift uncertainty into account. All these sources exhibit hard spectra with photon spectral indices of , similar to the one of Mrk 421, but belonging to objects that are much farther away. The redshift uncertainty produces a negligible effect in the expected source flux at 1.5. As such one may use BL Lacs with photo- estimates to constrain the EBL in the same way as BL Lacs with spectroscopic redshift have been used in Ackermann et al. (2012).
Figs. 8 and 7 show that the -ray horizon is for 1.5 is at energy 100 GeV: i.e. well in the Fermi-LAT band and well constrained by the first energy bin of the 2FHL catalog. For two out of three sources the flux is reduced by a factor 5 with respect to the unabsorbed flux.
6 Conclusions
This work is a continuation of the photometric redshift determination program utilizing the simultaneous GROND+Swift-UVOT data described in Rau et al. (2012) which provided photo- estimates/limits for hundreds of Fermi. We present 40 sources from the 3FGL catalog, for which redshifts (or upper limits) were determined by the photometric technique. Five of these sources are high redshift BL Lacs (z1.3). The Fermi 3LAC catalog comprises of 13 high- BL Lacs, in addition to the 6 provided by Rau et al. (2012). By including the 5 BL Lacs in this work, the total number of z 1.3 sources increases to 24, of which 13 are provided by the spectroscopic method and the other 11 by the photometric technique. Therefore, this work increases the sample size of known high- BL Lacs by 30%. It should be noted that 50% of the known high- BL Lacs have been found using the photometric redshift method. The latter method is efficient since obtaining data requires considerably shorter integration time than the spectroscopic method as described in Section 2. Moreover, the properties of these objects are in agreement with the blazar sequence which were examined using the various parameters as illustrated in Fig. 3, 4 and 5. All the five new sources are classified as LSPs or HSPs exhibiting 1046-48 erg s-1. The -ray luminosities associated with these objects are erg s-1 which are higher than the suggested values in the “Fermi Blazar Divide” introduced by Ghisellini et al. (2009) who divided the FSRQs and BL Lacs on plane, such that the BL Lacs show hard spectra ( 2.2) with low -ray luminosity ( erg s-1). Three of these new objects were reported in the 2FHL catalog, from which the highest energy photons (E 50 GeV) coupled with the redshift measurements were utilized to test the consistency with the currently known EBL models, e.g. Finke et al. (2010); Domínguez et al. (2011); Gilmore et al. (2011). Detecting high- BL Lacs with substantial amount of 50 GeV emission allowed us to constrain the EBL in a region where there are not, as yet, measurements of the optical depth. The ones derived here show consistency with the prediction of the EBL model of Domínguez et al. (2011), which is in agreement with the galaxy counts.
| Name | 3FGL Namea | E | ||
|---|---|---|---|---|
| CGRaBS J0217+0837 | J0217.2+0837 | 02 17 02.66 | +08 20 52.4 | 0.13 |
| PMN J03326155 | J0331.36155 | 03 31 18.44 | 61 55 28.7 | 0.07 |
| CRATES J05051558 | J0505.51558 | 05 05 41.57 | 15 58 37.9 | 0.08 |
| SUMSS J052542601341 | J0525.66013 | 05 25 42.43 | 60 13 40.4 | 0.03 |
| TXS 0637128 | J0640.01252 | 06 40 07.01 | 12 53 16.1 | 0.39 |
| GB6 J0708+2241 | J0708.9+2239 | 07 08 58.31 | +22 41 35.7 | 0.05 |
| PMN J07306602 | J0730.56606 | 07 30 49.42 | 66 02 19.3 | 0.14 |
| 1FGLJ0738.2+1741 | J0738.1+1741 | 07 38 07.39 | +17 42 18.9 | 0.03 |
| 1RXS J084755.9070306 | J0840.70651 | 08 47 56.71 | 07 03 16.5 | 0.02 |
| PMNJ0842-6053 | J0842.06055 | 08 42 26.56 | 60 53 50.4 | 0.21 |
| 1FGL J1059.31132 | J1059.21133 | 10 59 12.60 | 11 34 22.1 | 0.03 |
| 1FGL J1107.8+1502 | J1107.8+1502 | 11 07 48.05 | +15 02 10.6 | 0.02 |
| CLASS J1200+0202 | J1200.4+0202 | 12 00 52.9 | +12 28 33.2 | 0.02 |
| PMN J12257313 | J1225.77314 | 12 25 35.29 | 73 13 39.5 | 0.46 |
| 1FGL J1226.71332 | J1226.91329 | 12 26 54.41 | 13 28 38.9 | 0.04 |
| FRBA J1254+2211 | J1254.5+2210 | 12 54 33.27 | +22 11 03.64 | 0.04 |
| CRATES J12561146 | J1256.31146 | 12 56 15.95 | 11 46 37.4 | 0.05 |
| SUMSS J132840472748 | J1328.54728 | 13 28 40.64 | 47 27 49.3 | 0.14 |
| PKS 1326697 | J1330.17002 | 13 30 11.07 | 70 03 12.9 | 0.29 |
| FRBA J1338+1153 | J1339.0+1153 | 13 38 58.99 | +11 53 17.2 | 0.03 |
| BZB J1427+2348 | J1427.0+2347 | 14 27 00.39 | +23 48 00.0 | 0.05 |
| 1FGL J15210350 | J1520.80348 | 15 20 49.01 | 03 48 51.8 | 0.10 |
| CGRaBS J15321319 | J1532.71319 | 15 32 45.37 | 13 19 10.1 | 0.12 |
| CRATES J1552+0850 | J1552.1+0852 | 15 52 03.26 | +07 50 47.3 | 0.04 |
| AT20G J15533118 | J1553.53118 | 15 53 33.55 | 31 18 30.5 | 0.17 |
| BZB J1555+1111 | J1555.7+1111 | 15 55 43.01 | +11 11 24.7 | 0.05 |
| BZB J1559+2316 | J1559.9+2319 | 15 59 52.20 | +23 16 56.6 | 0.05 |
| CRATES J1610-6649 | J1610.8-6649 | 16 10 46.46 | 66 49 01.3 | 0.09 |
| CGRaBS J16476438 | J1647.1-6438 | 16 47 37.74 | 64 38 00.27 | 0.17 |
| CRATES J19184111 | J1918.24110 | 19 18 16.01 | 41 11 30.8 | 0.09 |
| PKS 1942313 | J1945.93115 | 19 45 59.37 | 31 11 38.3 | 0.07 |
| CRATES J20244544 | J2022.24515 | 20 22 26.26 | 45 13 31.5 | 0.03 |
| SUMSS J203451420024 | J2034.64202 | 20 34 51.10 | 42 00 38.0 | 0.04 |
| SDSS J2055300211 | J2055.20019 | 20 55 28.23 | 00 21 17.2 | 0.09 |
| PMN J21326624 | J2131.16625 | 21 32 37.35 | 66 24 27.2 | 0.03 |
| CRATESJ2143-3929 | J2143.13928 | 21 43 02.82 | 39 29 24.0 | 0.02 |
| 1FGL J2146.61345 | J2146.61344 | 21 46 37.01 | 13 44 00.9 | 0.04 |
| BZB J21583013 | J2158.83013 | 21 58 52.03 | 30 13 31.4 | 0.02 |
| PKS 2244002 | J2247.20004 | 22 47 30.19 | +00 00 06.5 | 0.10 |
| BZB J2334+1408 | J2334.8+1432 | 23 34 53.83 | +14 32 14.7 | 0.12 |
| Name | UT Datea | AB Magnitudeb | ||||||
|---|---|---|---|---|---|---|---|---|
| mag | ||||||||
| CGRaBS J0217+0837 | 20110913.71 | 1.07 | ||||||
| PMN J03316155 | 20130625.13 | 0.18 | ||||||
| CRATES J05051558 | 20101208.45 | 0.09 | ||||||
| SUMSS J052542601341 | 20140208.62 | 0.71 | ||||||
| TXS 0637128 | 20140227.63 | 0.01 | ||||||
| GB6 J0708+2241 | 20140227.56 | 0.41 | ||||||
| PMN J07306602 | 20140311.03 | 0.04 | ||||||
| 1FGL J0738.2+1741 | 20120522.06 | -0.02 | ||||||
| PMN J0842-6053 | 20130321.45 | 0.97 | ||||||
| 1RXS J084755.9070306 | 20130625.47 | 0.66 | ||||||
| PKS 0944-75 | 2013-04-13.84 | 0.48 | ||||||
| 1FGL J1059.31132 | 20130725.43 | 0.95 | ||||||
| 1FGL J1107.8+1502 | 20130717.01 | 0.11 | ||||||
| CLASS J1200+0202 | 20110422.09 | 2.34 | ||||||
| PMN J12257313 | 20130313.58 | |||||||
| 1FGL J1226.7-1332 | 20120813.97 | -0.12 | ||||||
| FRBA J1254+2211 | 20110302.13 | 0.10 | ||||||
| CRATES J12561146 | 20110511.11 | 0.49 | ||||||
| SUMSS J132840472748 | 20110226.43 | 0.23 | ||||||
| PKS 1326697 | 20140217.45 | 2.75 | ||||||
| FRBA J1338+1153 | 20110511.56 | 1.08 | ||||||
| BZB J1427+2348 | 20140304.47 | 0.03 | ||||||
| 1FGL J15210350 | 20140111.97 | 0.50 | ||||||
| CGRaBS J15321319 | 20140430.21 | 3.25 | ||||||
| CRATES J1552+0850 | 20110919.36 | -0.30 | ||||||
| AT20G J15533118 | 20131003.68 | 0.02 | ||||||
| BZB J1555+1111 | 20140305.46 | 0.13 | ||||||
| BZB J1559+2316 | 20140321.07 | 0.11 | ||||||
| CRATES J1610-6649 | 20130325.22 | -0.85 | ||||||
| CGRaBS J1647-6438 | 20130411.98 | -0.56 | ||||||
| CRATES J19184111 | 20130926.28 | - | 0.08 | |||||
| PKS 1942313 | 20131123.04 | 0.18 | ||||||
| CRATES J2024-4544 | 20121023.01 | -0.52 | ||||||
| SUMSS J203451420024 | 20130929.62 | 0.04 | ||||||
| SDSS J20553-00211 | 20120929.30 | 0.09 | ||||||
| PMN J21326624 | 20130702.79 | |||||||
| CRATES J2143-3929 | 20120319.18 | 0.02 | ||||||
| 1FGL J2146.61345 | 20130429.97 | 0.19 | ||||||
| BZB J21583013 | 20140329.15 | 0.71 | ||||||
| PKS 2244-002 | 20130617.65 | -0.07 | ||||||
| BZB J2334+1408 | 20121015.07 | 0.22 | ||||||
| Name | UT Datea | AB Magnitudeb | ||||||
|---|---|---|---|---|---|---|---|---|
| CGRaBS J0217+0837 | 20110913.38 | |||||||
| PMN J03316155 | 20130625.42 | |||||||
| CRATES J05051558 | 20131113.29 | |||||||
| SUMSS J052542601341 | 20140209.12 | |||||||
| TXS 0637128 | 20140227.01 | |||||||
| GB6 J0708+2241 | 20150121.10 | |||||||
| PMN J07306602 | 20140310.99 | |||||||
| 1FGL J0738.2+1741 | 20120523.69 | |||||||
| PMN J08426053 | 20120620.95 | |||||||
| 1RXS J084755.9070306 | 20140207.16 | |||||||
| 1FGL J1059.31132 | 20140207.20 | |||||||
| 1FGL J1107.8+1502 | 20130716.96 | |||||||
| CLASS J1200+0202 | 20111123.18 | |||||||
| PMN J12257313 | 20130310.39 | |||||||
| 1FGL J1226.71332 | 20130624.95 | |||||||
| FRBA J1254+2211 | 20110304.38 | |||||||
| CRATES J12561146 | 20140821.97 | |||||||
| SUMSS J132840472748 | 20110228.37 | |||||||
| PKS 1326697 | 20140217.35 | |||||||
| FRBA J1338+1153 | 20140422.22 | |||||||
| BZB J1427+2348 | 20140301.37 | |||||||
| 1FGL J15210350 | 20140112.35 | |||||||
| CGRaBS J15321319 | 20140430.37 | |||||||
| CRATES J1552+0850 | 20110918.98 | |||||||
| AT20G J15533118 | 20130319.40 | |||||||
| BZB J1555+1111 | 20140305.37 | |||||||
| BZB J1559+2316 | 20140603.13 | |||||||
| CRATES J16106649 | 20130325.34 | |||||||
| CGRaBS J16476438 | 20140411.98 | |||||||
| CRATES J19184111 | 20130926.98 | |||||||
| PKS 1942313 | 20130922.98 | |||||||
| CRATES J20244544 | 20121023.02 | |||||||
| SUMSS J203451420024 | 20130928.99 | |||||||
| SDSS J2055300211 | 20120929.15 | |||||||
| PMN J21326624 | 20141121.06 | |||||||
| CRATES J21433929 | 20120319.40 | |||||||
| 1FGL J2146.61345 | 20130826.14 | |||||||
| BZB J21583013 | 20141109.12 | |||||||
| PKS 2244-002 | 20130617.43 | |||||||
| BZB J2334+1408 | 20121016.18 | |||||||
| Name | power law | galaxy | ||||||||
|---|---|---|---|---|---|---|---|---|---|---|
| c | P | c | Pz d | model | ||||||
| Sources with confirmed photometric redshifts | ||||||||||
| SUMSS J052542-601341 | 10.4 | 98.9 | 1.25 | 54.7 | 99.9 | Spi4_template_norm.sed | ||||
| FRBA J1338+1153 | 1.587 | 3.7 | 98.8 | 1.05 | 27.2 | 77.5 | I22491_60_TQSO1_40.sed | |||
| 1FGL J1521.00350 | 0.867 | 7.6 | 99.7 | 0.90 | 27.0 | 81.8 | I22491_40_TQSO1_60.sed | |||
| CRATES J19184111 | 1.591 | 5.6 | 100.0 | 1.20 | 128.0 | 100.0 | S0_90_QSO2_10.sed | |||
| 1FGL J2146.61345 | 15.1 | 93.5 | 0.75 | 39.2 | 100.0 | pl_I22491_20_TQSO1_80.sed | ||||
| Sources with photometric redshifts upper limits | ||||||||||
| CGRaBS J0217+0837 | 0.085 | 153.49 | 82.88 | 1.90 | 95.72 | 99.87 | M82_template_norm.sed | |||
| PMN J0331-6155 | 14.7 | 13.3 | 1.35 | 6.9 | 76.3 | Sey18_template_norm.sed | ||||
| CRATES J0505-1558 | 08.3 | 10.4 | 1.25 | 13.5 | 52.9 | I22491_90_TQSO1_10.sed | ||||
| TXS 0637-128 | 4.7 | 10.5 | 1.05 | 3.6 | 34.5 | I22491_50_TQSO1_50.sed | ||||
| GB6 J0708+2241 | 34.4 | 16.0 | 1.10 | 10.6 | 99.7 | I22491_50_TQSO1_50.sed | ||||
| PMN J0730-6602 | 1.35 | 15.4 | 34.9 | 1.20 | 18.1 | 99.9 | I22491_80_TQSO1_20.sed | |||
| 1FGL J0738.2+1741 | 0.424 | 5.07 | 26.58 | 1.05 | 13.38 | 100.00 | I22491_40_TQSO1_60.sed | |||
| PMNJ08426053 | 16.63 | 60.72 | 1.35 | 8.13 | 100.00 | I22491_70_TQSO1_30.sed | ||||
| 1RXS J084755.9-070306 | 9.8 | 34.7 | 1.20 | 17.8 | 99.9 | I22491_70_TQSO1_30.sed | ||||
| 1FGL J1059.31132 | 01.9 | 63.6 | 1.20 | 28.8 | 99.9 | I22491_70_TQSO1_30.sed | ||||
| 1FGL J1107.8+1502 | 250.4 | 100.0 | 2.15 | 175.0 | 99.7 | pl_QSOH_template_norm.sed | ||||
| CLASS J1200+0202 | 23.53 | 99.36 | 0.75 | 22.66 | 95.38 | pl_QSOH_template_norm.sed | ||||
| PMN J12257313 | 40.0 | 22.3 | 1.55 | 3.7 | 99.7 | I22491_template_norm.sed.save | ||||
| 1FGL J1226.71332 | 0.456 | 90.38 | 10.32 | 1.70 | 15.69 | 99.97 | Spi4_template_norm.sed | |||
| FRBA J1254+2211 | 0.386 | 9.11 | 77.20 | 0.95 | 30.32 | 100.00 | I22491_50_TQSO1_50.sed | |||
| CRATES J12561146 | 0.058 | 388.9 | 100.0 | 1.55 | 28.5 | 100.0 | M82_template_norm.sed | |||
| PKS 1326-697 | 37.8 | 100.0 | 1.10 | 45.1 | 98.8 | Spi4_template_norm.sed | ||||
| SUMSS J132840-472748 | 21.3 | 65.4 | 0.65 | 23.7 | 91.9 | pl_I22491_20_TQSO1_80.sed | ||||
| BZB J1427+2348 | 09.2 | 29.3 | 0.85 | 41.7 | 61.6 | I22491_40_TQSO1_60.sed | ||||
| CGRaBS J15321319 | 1384.56 | 100.00 | 1.50 | 291.08 | 100.00 | S0_90_QSO2_10.sed | ||||
| CRATESJ1552+0850 | 1.05 | 4.59 | 66.00 | 1.25 | 46.92 | 54.94 | I22491_70_TQSO1_30.sed | |||
| AT20G J15533118 | 10.3 | 75.2 | 0.70 | 17.3 | 99.8 | pl_I22491_20_TQSO1_80.sed | ||||
| BZB J1555+1111 | 10.1 | 42.3 | 0.80 | 68.1 | 37.4 | pl_I22491_20_TQSO1_80.sed | ||||
| BZB J1559+2316 | 9.6 | 56.1 | 1.45 | 56.7 | 100.0 | I22491_template_norm.sed.save | ||||
| CRATES J16106649 | 129.86 | 99.94 | 0.25 | 188.92 | 97.54 | pl_QSOH_template_norm.sed | ||||
| CGRaBS J16476438 | 119.07 | 66.93 | 0.75 | 73.04 | 100.00 | pl_I22491_30_TQSO1_70.sed | ||||
| PKS 1942313 | 4.2 | 68.9 | 1.45 | 37.7 | 100.0 | I22491_template_norm.sed.save | ||||
| CRATESJ20244544 | 43.35 | 99.75 | 2.05 | 152.12 | 99.59 | pl_QSOH_template_norm.sed | ||||
| SUMSS J203451-420024 | 12.7 | 36.0 | 0.55 | 18.9 | 66.9 | pl_TQSO1_template_norm.sed | ||||
| SDSSJ2055300211 | 0.407 | 15.94 | 34.04 | 0.70 | 54.89 | 91.46 | pl_I22491_20_TQSO1_80.sed | |||
| PMN J2132-6624 | 6.1 | 96.6 | 1.25 | 14.0 | 99.9 | M82_template_norm.sed | ||||
| CRATESJ21433929 | 0.429 | 64.78 | 31.60 | 1.40 | 20.84 | 99.60 | Spi4_template_norm.sed | |||
| BZB J21583013 | 0.116 | 04.1 | 14.4 | 0.70 | 21.2 | 96.5 | pl_I22491_20_TQSO1_80.sed | |||
| PKS2244002 | 0.949 | 5.42 | 92.50 | 1.35 | 67.49 | 96.66 | I22491_70_TQSO1_30.sed | |||
| BZBJ2334+1408 | 0.415 | 133.84 | 92.01 | 1.35 | 142.54 | 100.00 | M82_template_norm.sed | |||
References
- Abdo et al. (2009) Abdo, A. A., Ackermann, M., Ajello, M., et al. 2009, The Astrophysical Journal, 700, 597
- Abdo et al. (2010) —. 2010, The Astrophysical Journal, 723, 1082
- Acero et al. (2015) Acero, F., Ackermann, M., Ajello, M., et al. 2015, The Astrophysical Journal Supplement Series, 218, 23
- Ackermann et al. (2012) Ackermann, M., Ajello, M., Allafort, A., et al. 2012, Science (New York, N.Y.), 338, 1190
- Ackermann et al. (2013) —. 2013, The Astrophysical Journal Supplement Series, 209, 34
- Ackermann et al. (2015) Ackermann, M., Ajello, M., Atwood, W. B., et al. 2015, The Astrophysical Journal, 810, 14
- Ackermann et al. (2016) —. 2016, The Astrophysical Journal Supplement Series, 222, 5
- Aharonian et al. (2006) Aharonian, F., Akhperjanian, A. G., Bazer-Bachi, A. R., et al. 2006, Nature, 440, 1018
- Aihara et al. (2011) Aihara, H., Allende Prieto, C., An, D., et al. 2011, The Astrophysical Journal Supplement Series, 193, 29
- Ajello et al. (2012) Ajello, M., Shaw, M. S., Romani, R. W., et al. 2012, The Astrophysical Journal, 751, 108
- Arnouts et al. (1999) Arnouts, S., Cristiani, S., Moscardini, L., et al. 1999, Monthly Notices of the Royal Astronomical Society, 310, 540
- Blandford & Rees (1978) Blandford, R. D., & Rees, M. J. 1978, Physica Scripta, 17, 265
- Bohlin et al. (1995) Bohlin, R. C., Colina, L., & Finley, D. S. 1995, The Astronomical Journal, 110, 1316
- Chabrier et al. (2000) Chabrier, G., Baraffe, I., Allard, F., & Hauschildt, P. 2000, The Astrophysical Journal, 542, 464
- Domínguez & Ajello (2015) Domínguez, A., & Ajello, M. 2015, The Astrophysical Journal, 813, arXiv:1510.07913
- Domínguez et al. (2013) Domínguez, A., Finke, J. D., Prada, F., et al. 2013, The Astrophysical Journal, 770, 77
- Domínguez et al. (2011) Domínguez, A., Primack, J. R., Rosario, D. J., et al. 2011, Monthly Notices of the Royal Astronomical Society, 410, 2556
- Finke (2013) Finke, J. D. 2013, The Astrophysical Journal, 763, 134
- Finke et al. (2010) Finke, J. D., Razzaque, S., & Dermer, C. D. 2010, The Astrophysical Journal, 712, 238
- Fossati et al. (1998) Fossati, G., Maraschi, L., Celotti, A., Comastri, A., & Ghisellini, G. 1998, Monthly Notices of the Royal Astronomical Society, 299, 433
- Gehrels et al. (2004) Gehrels, N., Chincarini, G., Giommi, P., et al. 2004, The Astrophysical Journal, 611, 1005
- Ghisellini et al. (1998) Ghisellini, G., Celotti, A., Fossati, G., Maraschi, L., & Comastri, A. 1998, Monthly Notices of the Royal Astronomical Society, 301, 451
- Ghisellini et al. (2009) Ghisellini, G., Maraschi, L., & Tavecchio, F. 2009, Monthly Notices of the Royal Astronomical Society: Letters, 396, L105
- Ghisellini et al. (2012) Ghisellini, G., Tavecchio, F., Foschini, L., et al. 2012, Monthly Notices of the Royal Astronomical Society, 425, 1371
- Gilmore et al. (2011) Gilmore, R. C., Somerville, R. S., Primack, J. R., & Domínguez, A. 2011, Monthly Notices of the Royal Astronomical Society, Volume 422, Issue 4, pp. 3189-3207., 422, 3189
- Greiner et al. (2008) Greiner, J., Bornemann, W., Clemens, C., et al. 2008, Publications of the Astronomical Society of the Pacific, 120, 405
- Hartman et al. (1999) Hartman, R. C., Bertsch, D. L., Bloom, S. D., et al. 1999, THE ASTROPHYSICAL JOURNAL SUPPLEMENT SERIES, 123, 79
- Ilbert et al. (2006) Ilbert, O., Arnouts, S., McCracken, H. J., et al. 2006, Astronomy and Astrophysics, 457, 841
- Kataoka et al. (2008) Kataoka, J., Madejski, G., Sikora, M., et al. 2008, The Astrophysical Journal, 672, 787
- Krühler et al. (2008) Krühler, T., Küpcü Yoldaş, A., Greiner, J., et al. 2008, The Astrophysical Journal, 685, 376
- Krühler et al. (2011) Krühler, T., Schady, P., Greiner, J., et al. 2011, Astronomy & Astrophysics, 526, A153
- Maraschi et al. (1995) Maraschi, L., Fossati, G., Tagliaferri, G., & Treves, A. 1995, The Astrophysical Journal, 443, 578
- Maraschi et al. (1994) Maraschi, ., Ghisellini, ., & Celotti, . 1994, IAU Symposium No. 159: Multi-wavelength continuum emission of AGN
- Padovani et al. (2012) Padovani, P., Giommi, P., & Rau, A. 2012, Monthly Notices of the Royal Astronomical Society: Letters, 422, L48
- Pickles (1998) Pickles, A. 1998, Publications of the Astronomical Society of the Pacific, 110, 863
- Poole et al. (2007) Poole, T. S., Breeveld, A. A., Page, M. J., et al. 2007, Monthly Notices of the Royal Astronomical Society, 383, 627
- Rau et al. (2012) Rau, A., Schady, P., Greiner, J., et al. 2012, Astronomy & Astrophysics, 538, A26
- Roming et al. (2005) Roming, P. W. A., Kennedy, T. E., Mason, K. O., et al. 2005, Space Science Reviews, 120, 95
- Ryabinkov et al. (2003) Ryabinkov, A. I., Kaminker, A. D., & Varshalovich, D. A. 2003, Astronomy and Astrophysics, 412, 707
- Salvato et al. (2009) Salvato, M., Hasinger, G., Ilbert, O., et al. 2009, The Astrophysical Journal, 690, 1250
- Salvato et al. (2011) Salvato, M., Ilbert, O., Hasinger, G., et al. 2011, The Astrophysical Journal, 742, 61
- Sambruna et al. (1996) Sambruna, R. M., Maraschi, L., & Urry, C. M. 1996, The Astrophysical Journal, 463, 444
- Sbarrato et al. (2012) Sbarrato, T., Ghisellini, G., Maraschi, L., & Colpi, M. 2012, Monthly Notices of the Royal Astronomical Society, 421, 1764
- Schlafly & Finkbeiner (2011) Schlafly, E. F., & Finkbeiner, D. P. 2011, The Astrophysical Journal, 737, 103
- Shaw et al. (2013) Shaw, M. S., Romani, R. W., Cotter, G., et al. 2013, The Astrophysical Journal, 764, 135
- Skrutskie et al. (2006) Skrutskie, M. F., Cutri, R. M., Stiening, R., et al. 2006, The Astronomical Journal, 131, 1163
- Stecker et al. (1992) Stecker, F. W., de Jager, O. C., & Salamon, M. H. 1992, The Astrophysical Journal, 390, L49
- Urry & Padovani (1995) Urry, C. M., & Padovani, P. 1995, Publications of the Astronomical Society of the Pacific, 107, 803
- Venters & Pavlidou (2007) Venters, T. M., & Pavlidou, V. 2007, in AIP Conference Proceedings, Vol. 921, 163–165