Fame and Obsolescence: Disentangling growth and ageing dynamics of patent citations
Abstract
We present an analysis of citations accrued over time by patents granted by the United States Patent and Trademark Office in 1998. In contrast to previous studies, a disaggregation by technology category is performed, and exogenously caused citation-number growth is controlled for. Our approach reveals an intrinsic citation rate that clearly separates into an – in the long run, exponentially time-dependent – ageing function and a completely time-independent preferential-attachment-type growth kernel. For the general case of such a separable citation rate, we obtain the time-dependent citation distribution analytically in a form that is valid for any functional form of its ageing and growth parts. Good agreement between theory and long-time characteristics of patent-citation data establishes our work as a useful framework for addressing still open questions about knowledge-propagation dynamics, such as the observed excess of citations at short times.
I Introduction & Overview of main results
The structure and evolution of information transfer in collaborative environments continues to be the subject of intense study. In particular, citations by scientific articles Redner (1998); Börner et al. (2004); Redner (2005); Radicchi et al. (2008); Golosovsky and Solomon (2012, 2013) and patents Griliches (1990); Jaffe and Trajtenberg (1999); von Wartburg et al. (2005); Csárdi et al. (2007); Valverde et al. (2007); Sheridan et al. (2012) are being investigated as directly accessible and suitably quantifiable indicators of intellectual connectivity. Basic insight into citation data has been obtained by the application of advanced models for network growth de Solla Price (1976); Barabási and Albert (1999); Dorogovtsev et al. (2000); Krapivsky and Redner (2001); Albert and Barabási (2002); Newman (2003) where the principle of preferential attachment governs the creation of new connections (i.e., citations). However, such growth dynamics is counterbalanced by the typically increased tendency towards obsolescence for old knowledge. As a result, the intrinsic 111The intrinsic citation rate is obtained from the bare total citation rate by a rescaling to account for the extrinsic variation in citability due to the changing number of patents that are generated at time : . years in our analysis. citation rate for patents (articles) at time can be surmised to be of the general form Csárdi et al. (2007); Valverde et al. (2007)
| (1) |
Here is the ageing function Dorogovtsev and Mendes (2000); Zhu et al. (2003); Medo et al. (2011); Wu et al. (2014), and embodies preferential-attachment dynamics through its asymptotic power-law dependence on an individual patent’s (article’s) cumulative number of citations .


| Category | 1 | 2 | 3 | 4 | 5 | 6 |
|---|---|---|---|---|---|---|
| [years] | 222Here showed a moderate residual dependence on the cumulative number of citations. | |||||
| [years-1] | ||||||
| 0.92 | – 333Uncertainties in this category’s ageing-function parameters prevent determination of . | –b | 0.87 | 0.94 | 0.91 |
Various specific functional forms for and have been fitted to real citation data. For the Ansatz (1) to be meaningful, fitting procedures should find that any parameters entering the preferential-attachment kernel are independent of time once an accurate model for ageing of knowledge has been adopted and extrinsic influences, such as the increased number of patents (articles) generated over time, have been controlled for by a suitable normalisation. Here we show that this is indeed the case for patents within given technology categories. More specifically, the validity of (1) is demonstrated by explicit extraction of the ageing function and preferential-attachment kernel, which are found to be of the form
| (2a) | |||||
| (2b) | |||||
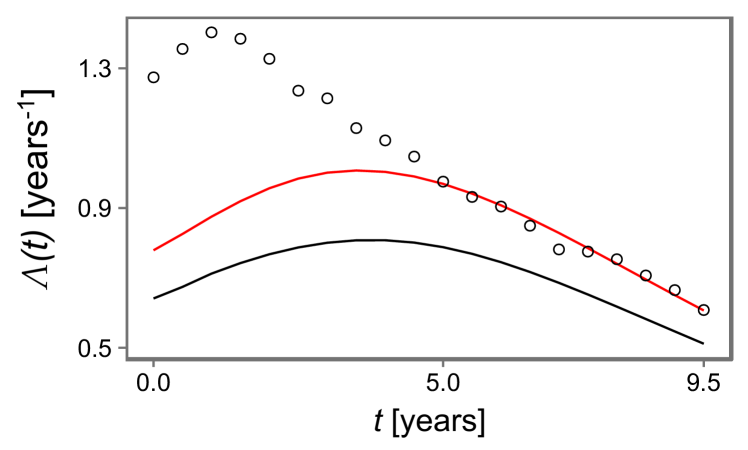
Figure 1 shows results of a fitting procedure that most directly demonstrates the validity of the separation Ansatz (1), and the parameter values found for individual technology categories defined in Ref. Hall et al. (2002) are given in Table 1.
Our present approach 444Three aspects – disaggregation by technology, citation-inflation adjustment, and use of the time lag between granting of a cited patent and the application date of citing patents as the relevant time parameter – differentiate our present approach from the one followed by previous studies of citation data Csárdi et al. (2007); Valverde et al. (2007); Golosovsky and Solomon (2012). establishes the rate expression (1) as a viable description for patent-citation dynamics and so provides the means to investigate general aspects of knowledge flow in greater detail. As an example, we discuss interesting insights that emerge from comparing values for growth-kernel and ageing-function parameters associated with the citation statistics for patents from different technology categories. On a conceptual level, finding ageing to be reliably modeled by an exponential function of time in the long run implies the existence of a finite life time for patents before they become obsolete – in agreement with an early study of patent-citation dynamics Jaffe and Trajtenberg (1999) that also observed exponential ageing 555More recent works Csárdi et al. (2007); Golosovsky and Solomon (2012) postulated ageing functions with asymptotic power-law behavior but concomitantly observed a marked increase of the preferential-attachment exponent over time. Others Valverde et al. (2007) presumed the ageing function to be of Weibull form but fixed in their fits. As shown in Appendix B, exponential ageing best describes the intrinsic citation rate for patents in the long run.. Systematic deviations from the, in the long-term very accurate, exponential-aging model point to currently not understood mechanisms for knowledge propagation at short times that require further study.
As one of our main results, we obtain the fully general analytic expression for the distribution function for citations, which is the fraction of patents having citations at time . For all values , it will satisfy the Master equation Medo et al. (2011)
| (3a) | |||
| whereas for , the corresponding Master equation is | |||
| (3b) | |||
Solving these equations for the most general form of initial conditions allows us to account for the fact that a significant number of patents have already acquired citations by the time they are granted. Assuming only that the citation rate has the form given in (1), we find 666Solution of Eq. (3b) yields . For given , Eq. (3a) is solved by the method of variation of constants, yielding . The explicit result given in Eq. (4a) is obtained by induction.
| (4a) | |||||
| where | |||||
| (4b) | |||||
This result is applicable to any citation dynamics described by a rate that is the product of an ageing part and a citation-number-dependent growth part, irrespective of their explicit functional forms. It also incorporates the fully general initial conditions.
Specializing (4b) to the ageing function given in (2a) yields
| (5a) | |||
| where | |||
| (5b) | |||
quantifies the effect of deviations from exponential ageing that occur at short times . Hence we expect, and indeed observe, . For the purpose of the present work, extracting the parameter from the data enables us to model correctly the citation-number distribution for . See Fig. 2 for a comparison of the theoretical prediction with the data. Table 1 summarizes the values of found for individual technology categories.

Knowing explicitly, it is possible to calculate any citation-related quantity of interest, including the average rate of citation for patents from the cohort; , and the average cumulative number of citations obtained over time; 777For , , as assumed, e.g., in Refs. Medo et al. (2011); Wu et al. (2014), the result (4a) specializes to , yielding and ., which are related via . We only consider here. Figure 3 shows a representative comparison between the average citation rate obtained from actual patent-citation data and the prediction coming out of our model that combines preferential-attachment-type growth with ageing. For the theoretical curves, we have taken into account the empirically measured initial citation distribution . The assumption of purely exponential ageing turns out not to yield a good description of the data for , but good agreement at longer times is achieved simply by setting with the appropriate value for to account for the effect of short-time deviations from exponential ageing. Thus despite the fact that the exact functional form of the ageing function at short times is currently not known, we can accurately model the longer-term behavior of .
| Technology category (after Hall et al. (2002)) | 1 | 2 | 3 | 4 | 5 | 6 |
|---|---|---|---|---|---|---|
| Number of patents granted in 1998 | 32,626 | 34,872 | 20,703 | 35,527 | 32,423 | 33,275 |
| Total citations accrued by cohort | 333,306 | 809,396 | 406,373 | 549,216 | 360,609 | 349,081 |
| Total of inflation-adjusted citations | 301,451 | 606,489 | 345,458 | 435,430 | 316,326 | 322,515 |
The remainder of this Article is organized as follows. We describe the data and methods used for our analysis in Sec. II. General implications of our results for understanding patent-citation dynamics and associated knowledge characteristics are discussed in Sec. III. We present conclusions in Sec. IV and provide relevant additional information in Appendices.
II Methodology for data analysis & fitting
Our data comprise the citation history of all patents granted in the year 1998 by the United States Patent and Trademark Office (USPTO), where each patent is assigned one of six broad technology categories as laid out in Ref. Hall et al. (2002). The cohort of patents granted in 1998 was chosen in order to have both enough data and enough time to conduct a robust analysis of the network evolution. The date of a citation is taken to be the application date of the citing patent. We consider all citations to this cohort up to, and including, those applied for in the year 2007. A detailed summary statistics for our patent-citation dataset is provided in Table 2.
The citations to each patent in our cohort are binned in six-month periods, starting from the grant date of the patent. This establishes two time series; one for the number of additional citations gained within a given six-month period, and one for the total number of citations that have been accrued by the end of each period. These citations are adjusted for ‘citation inflation’ to mitigate extrinsic factors affecting the citation rate: because the number of patent applications in each period and technology category is variable, we divide the nominal application counts by the number of applications in 1998 to scale each citation to an ‘equivalent 1998 citation’. We perform this scaling only within a given technology category based on the approximation that patents mostly cite other patents from the same technology category. The fact that we see consistent exponential aging behavior across most technology categories suggests that this approximation is generally valid. See Table 2 for a listing of both the raw total and ‘inflation-adjusted’ citation numbers for each cohort of patents.
We also bin the data into groups of patents with similar values of at . In order to ensure equal spacing of these bins during the modeling process, we implement logarithmic binning, whereby bin size gets exponentially larger with the number of cumulative citations. There are few patents with a large number of citations, and so the measured citations for these patents have large uncertainties. To mitigate this, we define a threshold, and when the number of accrued citations to a patent exceeds this threshold, the patent gets excluded from the analysis. For our present study, the threshold has been set at the 95th percentile of total accrued citations, which varies with technology category.


To prove separability of the citation rate and extract relevant parameters, we assume, for patents with citations, that the average additional number of citations in , denoted , with months is a good proxy for the citation rate at time . (As shown in Appendix A, our results do not depend on this particular convenient choice of .) We then analyze how these rates change as functions of both time and accumulated citations. In particular, we fit Eq. (2a) to the time dependence of the observed citation rate at various fixed to extract values of [see Fig. 4(a)], and fit Eq. (2b) to the dependence of the observed citation rate at various fixed to extract values of and [cf. Fig. 4(b)]. All fits performed in this work are carried out using a weighted nonlinear least-squares regression with weights proportional to the number of patents represented by each data point. We fit (2a) to times because of a departure from exponential behaviour observed at short times. The results obtained in that way for patents from category 4 (Electrical & Electronic) are shown in Fig. 1. The fact that there is no systematic residual time dependence in the values for and , and no dependence of the extracted on the number of citations , clearly shows the applicability of the separation Ansatz (1) for the citation rate. Repeating the fitting procedure using potential alternative forms for and , as discussed in Appendix B, establishes Eqs. (2a) and (2b) as the most meaningful and accurate models. This allows us to discuss more systematic specifics of the ageing and growth mechanisms.
III Discussion of results & Outlook
III.1 Distribution function for patent citations:
Comparison between
theory and data
The distribution function captures all aspects of patent-citation statistics and is therefore an extremely useful quantity to know. We have obtained its fully general analytic expression in Eq. (4a) for any situation where the citation rate has a separable form as given in Eq. (1). Results obtained from calculating this expression using the functional forms and
with the parameters we have extracted from analyzing citation data for category-4 patents granted in 1998 are plotted in Fig. 2. Comparison with the empirical data for reveals the regions of validity for our model. At large-enough , the agreement is very good over essentially the entire range of . As gets smaller, the region of good agreement shrinks to a limited range of smaller and smaller . Based on this understanding of the properties of the distribution function, the accuracy of our model for calculating any statistical quantity of interest related to patent citations can be inferred.
III.2 Robust preferential-attachment growth
Within our analysis, we observe no systematic deviations from preferential-attachment-type growth. Our extracted values of the exponent vary moderately between the different technology categories but are all broadly consistent with . This value is marginally lower than those typically found previously Golosovsky and Solomon (2013) from citation networks, but still implies super-linear growth dynamics. The initial attractiveness for a patent to be (essentially randomly) cited is quantified by the parameter whose values are in the sensible range across all technology categories. The observed technology-independent universality of the preferential-attachment growth behavior points to the existence of common drivers for citation-based knowledge flow in invention space.
III.3 Technology dependence of short & long-term ageing
Our study has succeeded in establishing the separability of the citation rate into ageing and growth parts, and has also clarified the exact form of the preferential-attachment kernel. However, the functional form of the ageing function was able to be reliably identified as being exponential only for longer times years. As illustrated in Fig. 4(a), the citation rate at shorter times is larger than expected from purely exponential ageing with the extracted lifetime . Nevertheless, the knowledge of exponential ageing occurring in the long run, together with the separability according to (1), make it possible to at least find an accurate model for the distribution of citations for times (see Fig. 2), which can be the starting point for further study into the short-time ageing mechanism.
Similarly to the preferential-attachment parameters, the life time associated with long-term exponential ageing turns out to show some variation across the different technology categories. The broad range is consistent with early results reported in the economics literature Jaffe and Trajtenberg (1999). Furthermore, those technologies that are generally perceived to be faster-changing (categories 2-4) exhibit shorter while those perceived to change more slowly (categories 1, 5 and 6) exhibit longer . See Table 1. The factor that quantitatively embodies short-term deviations from exponential ageing also exhibits an interesting pattern across technologies. It is plausible that the enhancement of knowledge transfer that is observed for some technologies on short time scales does not occur to a significant level for patents from the very heterogeneous and generally slower-changing technology space of categories 1, 5 and 6. This leads to a larger for these categories. In contrast, the faster-developing category 4 is strongly influenced by such short-time effects, rendering its to be smaller.
III.4 Relating patent-citation statistics to knowledge flow: Opportunities and caveats
We treat citations as an indicator or proxy for knowledge flow. We might expect citations in patents to be a high-quality indicator, because they are governed by explicit legal rules, and their inclusion in or exclusion from a given patent has legal consequences Jaffe and de Rassenfosse (2016). Indeed, recent work uses transitive reduction (TR) 888TR removes links without disrupting ‘information flow’, such that, when patent A cites patents B and C, and B also cites C, then the edge connecting A to C is removed, as the information still flows from C to A via B. This edge-removal process is argued to highlight the causal structure of a directed acyclic network, for which the resulting graph is unique. The authors of Ref. Clough et al. (2015) find that TR removes about 80% of links in academic citation networks, but only 15% in patent-citation networks. of citation networks to show that the level of redundancy in the information flow associated with patent citations is much smaller when compared with citations to academic papers Clough et al. (2015). This suggests a stronger link between citation dynamics and knowledge flow in the patent network as compared to networks mapped from article citations (for which both rules and consequences are much less clear). There are, however, reasons to be cautious in interpreting patent citations as indicators of knowledge flow. Citations are made by several parties (including the inventor, the patent attorney, and the USPTO patent examiner 999This is illustrated by a large survey of inventors Jaffe et al. (2000) finding that almost half of the citations on their patents referenced inventions unknown to the inventors before the survey.) and for various reasons Cotropia et al. (2013). Applying our present approach to analyze the statistics of patent citations that originate from different parties acting during the patenting process could shed interesting new light on these various influences Jaffe and de Rassenfosse (2016).
IV Conclusions
We have empirically established that the intrinsic rate of citation for patents within individual technology categories is separable into an ageing function and a preferential-attachment growth kernel. The ageing function depends exponentially on time in the long run, but the functional form characterizing its short-time behavior is currently not known. The life time associated with the exponential ageing and the parameters of preferential-attachment-type growth have been reliably extracted, and variations across technology categories were discussed. Based on the separability of the intrinsic citation rate, the distribution of citations has been obtained as a function of time in an explicitly analytic form that also incorporates a completely general initial citation distribution. This result enables detailed modelling of patent-citation statistics and facilitates future in-depth investigations into mechanisms for knowledge propagation through invention space.
Appendix A Robustness of data analysis with respect to a change in sampling period for incoming citations
For the analysis presented in the main text, we have counted incoming citations received over the interval with months to determine the citation rate at time . As Table 3 shows, different reasonable choices for the sampling period yield the same parameters resulting from fitting.
| [months] | 6 | 4 | 3 |
|---|---|---|---|
| [years] | |||
| [years-1] |
Generally, the optimal choice of will take account of the amount of available data (cohort size; number of incoming citations) and the length of time over which citation statistics is to be modeled. Choosing a larger is advisable, e.g., for analyzing cohorts with few patents and/or incoming citations. In contrast, a shorter may be necessary when working with more-recently-granted patents for which there has been less time to accrue citations.


Appendix B Exploring alternative functional forms describing growth and ageing dynamics in the citation rate
B.1 Alternative preferential-attachment kernels
While preferential-attachment models generally have a kernel that asymptotically approaches a power law Krapivsky and Redner (2001), , different specific functional forms have been proposed to fit real data. Here we provide a comparison between our adopted form , which was also used previously for patent data Csárdi et al. (2007), and a possible alternative for , , which has been applied to model citation growth for scientific publications Golosovsky and Solomon (2012). Table 4 shows results from fitting the relevant parameters to the patent data. Values obtained for the exponent are quite close but have significantly lower uncertainties for our adopted functional form, motivating our particular choice.
| [months] | 6 | 3 | ||
|---|---|---|---|---|
| Model | ||||
| — | — | |||
| — | — | |||
Conceptually, the two functional forms compared here differ in the way citation growth is modeled for patents with small, especially vanishing, number of citations. The underlying causes for determining the initial citation rate (pure chance or some sort of quality/fitness) need to be investigated further. The adherence to different functional forms of revealed in the citation rate for patents and scientific publications could be indicative of an interesting distinction between growth mechanisms responsible for their respective citation dynamics.
B.2 Alternative forms of the ageing function
Various forms of ageing functions have been considered in the context of network-growth models Wu et al. (2014). Besides exponential ageing represented by the functional form given in Eq. (2a) of the main text and deduced also in the early economics literature on patent citations Jaffe and Trajtenberg (1999), expressions with an asymptotic power-law dependence are quite common. In particular, previous studies of citation dynamics Csárdi et al. (2007); Golosovsky and Solomon (2012, 2013) have fitted an ageing function of the form
| (6) |
to the data. Within our approach where patent-citation data are disambiguated by technology category, citation inflation is accounted for, and the application date of patents constitutes the time when incoming citations are generated, the ageing function (6) can quite accurately represent the data, even at short times. See Fig. 5(a). However, as illustrated Figs. 5(b) and 5(c), the parameters and extracted from such superficially accurate fits turn out to have excessively large uncertainties and even show some residual dependence. Table 5 summarizes the consistency of this situation across all technology categories. Thus while the introduction of an additional parameter enables a good fit, no meaningful information can be associated with the fitting parameters. The same type of problem occurs with other three-parameter models such as a stretched-exponential expression and the Weibull form used in Ref. Valverde et al. (2007). In contrast to the explored alternatives, fitting exponential ageing to the data at long times yields robust and meaningful results that enable, e.g., comparisons between different technology categories. These fits also reveal a systematic excess of citations at short times that points to a different mechanism for knowledge flow from that acting at longer times, which warrants further investigation. See Fig. 5(a) and information given in the main text.
| Category | 1 | 2 | 3 | 4 | 5 | 6 |
|---|---|---|---|---|---|---|
| 101010Parameter shows a significant residual dependence on the cumulative number of citations. | ||||||
| [years] | ||||||
| [years-1] |
The tendency to find power laws as ageing functions in previous work could be explained by several mechanisms that conspire to fatten the tail of the citation distributions. Most importantly, the ever-increasing overall number of citing patents and scientific articles creates a citation inflation that, if not accounted for, enhances citation rates at later times. Also, studies employing the method of transitive reduction Clough et al. (2015) indicate that a substantial number of citations in scientific articles are redundant for the purpose of information flow, potentially being included mainly to honor intellectual priority. This practice slows down obsolescence and establishes a class of ‘immortal’ papers Golosovsky and Solomon (2013). No such effect exists for patent citations, as the very small fraction of citations eliminated by transitive reduction attests Clough et al. (2015), thus exposing basic exponential ageing at long times. Finally, the appearance of slower obsolescence could be created through to the influence of autocorrelation effects.
References
- Redner (1998) S. Redner, Eur. Phys. J. B 4, 131 (1998).
- Börner et al. (2004) K. Börner, J. T. Maru, and R. L. Goldstone, PNAS 101, 5266 (2004).
- Redner (2005) S. Redner, Phys. Today 58(6), 49 (2005).
- Radicchi et al. (2008) F. Radicchi, S. Fortunato, and C. Castellano, PNAS 105, 17268 (2008).
- Golosovsky and Solomon (2012) M. Golosovsky and S. Solomon, Phys. Rev. Lett. 109, 098701 (2012).
- Golosovsky and Solomon (2013) M. Golosovsky and S. Solomon, J. Stat. Phys. 151, 340 (2013).
- Griliches (1990) Z. Griliches, J. Econ. Lit. 28, 1661 (1990).
- Jaffe and Trajtenberg (1999) A. B. Jaffe and M. Trajtenberg, Econ. Innov. New Techn. 8, 105 (1999).
- von Wartburg et al. (2005) I. von Wartburg, T. Teichert, and K. Rost, Res. Policy 34, 1591 (2005), and citations therein.
- Csárdi et al. (2007) G. Csárdi, K. J. Strandburg, L. Zalányi, J. Tobochnik, and P. Érdi, Physica A 374, 783 (2007).
- Valverde et al. (2007) S. Valverde, R. V. Solé, M. A. Bedau, and N. Packard, Phys. Rev. E 76, 056118 (2007).
- Sheridan et al. (2012) P. Sheridan, Y. Yagahara, and H. Shimodaira, Physica A 391, 5031 (2012).
- de Solla Price (1976) D. de Solla Price, J. Amer. Soc. Inform. Sci. 27, 292 (1976).
- Barabási and Albert (1999) A.-L. Barabási and R. Albert, Science 286, 509 (1999).
- Dorogovtsev et al. (2000) S. N. Dorogovtsev, J. F. F. Mendes, and A. N. Samukhin, Phys. Rev. Lett. 85, 4633 (2000).
- Krapivsky and Redner (2001) P. L. Krapivsky and S. Redner, Phys. Rev. E 63, 066123 (2001).
- Albert and Barabási (2002) R. Albert and A.-L. Barabási, Rev. Mod. Phys. 74, 47 (2002).
- Newman (2003) M. E. J. Newman, SIAM Review 45, 167 (2003).
- Note (1) The intrinsic citation rate is obtained from the bare total citation rate by a rescaling to account for the extrinsic variation in citability due to the changing number of patents that are generated at time : . years in our analysis.
- Dorogovtsev and Mendes (2000) S. N. Dorogovtsev and J. F. F. Mendes, Phys. Rev. E 62, 1842 (2000).
- Zhu et al. (2003) H. Zhu, X. Wang, and J.-Y. Zhu, Phys. Rev. E 68, 056121 (2003).
- Medo et al. (2011) M. Medo, G. Cimini, and S. Gualdi, Phys. Rev. Lett. 107, 238701 (2011).
- Wu et al. (2014) Y. Wu, T. Z. Fu, and D. M. Chiu, J. Informetrics 8, 650 (2014).
- Hall et al. (2002) B. H. Hall, A. B. Jaffe, and M. Trajtenberg, in Patents, Citations, and Innovations: A Window on the Knowledge Economy, edited by A. B. Jaffe and M. Trajtenberg (MIT Press, Cambridge, MA, 2002) p. 403.
- Note (2) Three aspects – disaggregation by technology, citation-inflation adjustment, and use of the time lag between granting of a cited patent and the application date of citing patents as the relevant time parameter – differentiate our present approach from the one followed by previous studies of citation data Csárdi et al. (2007); Valverde et al. (2007); Golosovsky and Solomon (2012).
- Note (3) More recent works Csárdi et al. (2007); Golosovsky and Solomon (2012) postulated ageing functions with asymptotic power-law behavior but concomitantly observed a marked increase of the preferential-attachment exponent over time. Others Valverde et al. (2007) presumed the ageing function to be of Weibull form but fixed in their fits. As shown in Appendix B, exponential ageing best describes the intrinsic citation rate for patents in the long run.
- Note (4) Solution of Eq. (3b) yields . For given , Eq. (3a) is solved by the method of variation of constants, yielding . The explicit result given in Eq. (4a) is obtained by induction.
- Note (5) For , , as assumed, e.g., in Refs. Medo et al. (2011); Wu et al. (2014), the result (4a) specializes to , yielding and .
- Jaffe and de Rassenfosse (2016) A. B. Jaffe and G. de Rassenfosse, Patent Citation Data in Social Science Research: Overview and Best Practices, Working Paper 21868 (National Bureau of Economic Research, 2016).
- Note (6) TR removes links without disrupting ‘information flow’, such that, when patent A cites patents B and C, and B also cites C, then the edge connecting A to C is removed, as the information still flows from C to A via B. This edge-removal process is argued to highlight the causal structure of a directed acyclic network, for which the resulting graph is unique. The authors of Ref. Clough et al. (2015) find that TR removes about 80% of links in academic citation networks, but only 15% in patent-citation networks.
- Clough et al. (2015) J. R. Clough, J. Gollings, T. V. Loach, and T. S. Evans, J. Complex Networks 3, 189 (2015).
- Note (7) This is illustrated by a large survey of inventors Jaffe et al. (2000) finding that almost half of the citations on their patents referenced inventions unknown to the inventors before the survey.
- Cotropia et al. (2013) C. A. Cotropia, M. A. Lemley, and B. Sampat, Res. Policy 42, 844 (2013).
- Jaffe et al. (2000) A. B. Jaffe, M. Trajtenberg, and M. S. Fogarty, The Meaning of Patent Citations: Report on the NBER/Case-Western Reserve Survey of Patentees, Working Paper 7631 (National Bureau of Economic Research, 2000).