A ghostly damped Ly system revealed by metal absorption lines ††thanks: Based on data obtained with XSHOOTER on the ESO-VLT; Prgm. 084.A-0699(A).
Abstract
We report the discovery of the first ’ghostly’ damped Ly absorption system (DLA), which is identified by the presence of absorption from strong low-ion species at along the line of sight to the quasar SDSSJ113341.29005740.0 with . No Ly absorption trough is seen associated with these absorptions because the DLA trough is filled with the leaked emission from the broad emission line region of the quasar. By modeling the quasar spectrum and analyzing the metal lines, we derive log(H i)(cm-2)21.0 0.3. The DLA cloud is small ( 0.32 pc) thus not covering entirely the broad line region and is located at 39 pc from the central active galactic nucleus (AGN). Although the DLA is slightly redshifted relative to the quasar, its metallicity ([S/H]=0.410.30) is intermediate between what is expected from infalling and outflowing gas. It could be possible that the DLA is part of some infalling material accreting onto the quasar host galaxy through filaments, and that its metallicity is raised by mixing with the enriched outflowing gas emanating from the central AGN. Current DLA surveys miss these ’ghostly’ DLAs, and it would be important to quantify the statistics of this population by searching the SDSS database using metal absorption templates.
keywords:
quasars: absorption lines – quasars: emission lines –quasars: individual: SDSS J113341.29005740.01 Introduction
Quasars are powered by the infall of gas into the gravitational potential well of super-massive black holes, residing at the center of distant galaxies. The infall of gas occurs, preferentially, through the so-called cold flows along the filaments of the cosmic web (van de Voort et al., 2012) that are predicted by simulations (Martin et al., 2016). These cold flows of low metallicity gas can also feed and trigger star formation activities in the host galaxies, hence, enriching their interstellar medium (Sánchez Almeida et al., 2015). Strong AGN-driven outflows, on the other hand, are required to regulate and quench star formation activities, and also prevent overgrowth of the galaxy (and the central black hole) by ejecting the available material back into the intergalactic medium (IGM) and/or circum-galactic medium (CGM; Silk & Rees, 1998; Cano-Díaz et al., 2012; Carniani et al., 2016).
Luminous quasars are capable of launching powerful and energetic outflows of gas up to very large distances. The pristine infalling gas can therefore merge with the enriched outflowing material anywhere from the innermost region of the AGN to the outermost region of the halo of the host galaxy. When the infalling and outflowing gas collide, they get mixed, shocked and compressed to a high density, probably for a short period, before getting evaporated by the incident energetic outflows (Namekata, Umemura & Hasegawa, 2014). If a line of sight to the central AGN passes through this shocked material, one would expect to detect a strong H i absorption in the spectrum with (H i) 1017 cm-2 at the redshift of the quasar (van de Voort et al., 2012; Finley et al., 2013; Fathivavsari et al., 2015, 2016).
Since the gas is compressed to a very small size, it may not fully cover the broad emission line region (BELR) of the quasar. Therefore, for any given neutral hydrogen column density, there could be a combination of the cloud projected angular size and its relative velocity from the AGN for which the partial coverage is such that the leaked emission from the Ly BELR could almost fully fill the strong (or damped) Ly absorption trough. If this happens, one would not detect the corresponding Ly absorption in the quasar spectrum. So far, no such combination of DLA size and relative velocity (from the AGN) has ever been found along quasars’ sightlines. For the first time, in this letter, we report the discovery of such a ghostly DLA cloud along the line of sight to the quasar SDSS J113341.29005740.0 (here after J11330057). The presence of this DLA is revealed through the detection of absorption lines from neutral (e.g. C i or Na i) and low-ion species associated with it. This absorber is part of the Ledoux et al. (2015) sample. These authors systematically looked for C i absorption in the Sloan Digital Sky Survey (SDSS) quasar spectra in a search for cold gas at high redshift. We show that the cloud is compressed to a very small size, and is located very close to the central AGN. We argue that proximity to the quasar’s central engine, and small physical dimension are the common characteristics of ghostly DLAs.
Ghostly DLAs are important objects as (by definition) they always show signature of negligible covering factor of at least the Ly BELR, and probably probe the innermost regions of the AGNs. Current surveys of DLAs miss this class of objects as their employed techniques to find DLAs rely at least partly on the fact that the residual flux at the bottom of the DLA reaches zero intensity (Prochaska & Herbert-Fort, 2004; Noterdaeme et al., 2009), which is not the case in this new class of DLAs. Therefore, we might actually be witnessing the tip of an iceberg as new techniques based on metal absorption line templates would probably find more of these ghostly DLAs in the SDSS spectroscopic database.
2 Observation
The spectrum of the quasar SDSS J11330057 was taken on 2011 January 7, using the XSHOOTER spectrograph (Vernet et al., 2011) mounted on the Very Large Telescope in the course of a program to search for cold gas using neutral carbon (see Ledoux et al., 2015 for more details). The spectrum covers the wavelength range from 3000 Å to 2.5 m with the nominal resolving power of R = 4350, 7450, and 5300 in the UVB, VIS, and NIR arms, respectively, corresponding to slit widths of 1.0, 0.9 and 0.9 arcsec. We used the ESO pipeline v2.5.2 to reduce the raw spectrum. The 11-long slit of the spectrograph provided us with enough spatial pixels free of quasar emission, to perform optimal sky subtraction. Arc lamp spectra were used for wavelength calibration, and the spectrum of a standard star observed during the same night was used to flux calibrate the spectrum.
3 A ghostly DLA
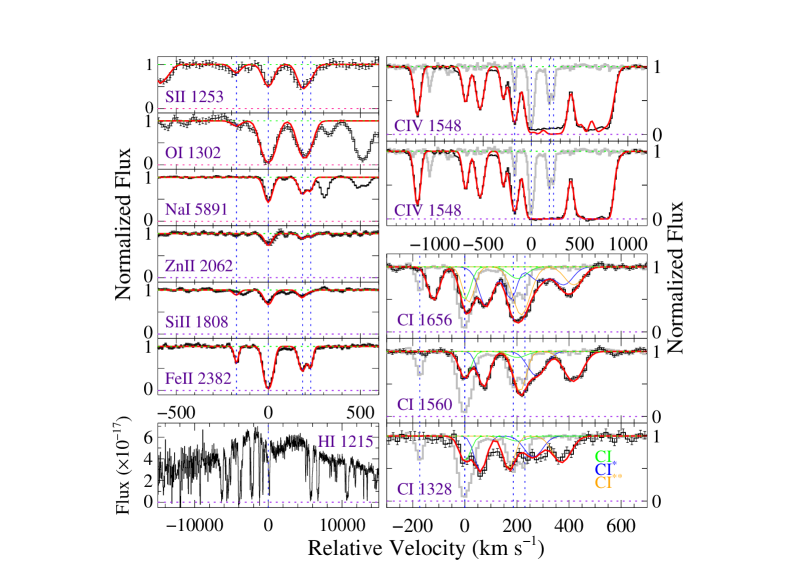
We detect a metal absorption line system in the spectrum of the quasar J11330057, with an absorption redshift coincident with the emission redshift of the quasar. The presence of species like C i, Cl i, Mg i, and especially Na i suggests that the absorber has a high neutral hydrogen column density and is probably a DLA (Petitjean et al., 2000). However, as shown in Fig. 1, no apparent DLA absorption line is detected in the spectrum at the redshift of the low ion species, i.e. = 1.70465. If one assumes that the Ly BELR of the quasar is only partially covered by the DLA, then the leaked Ly emission from the BELR could fill the DLA absorption trough and prevent direct detection. We show below that this is indeed the case, and we demonstrate that the shallow absorption dip seen around 3300 Å in the spectrum is actually a ghostly signature of an otherwise strong DLA absorption (see section 3.2). This shallow absorption feature allows us to constrain the H i column density of this elusive DLA.
3.1 Quasar emission lines
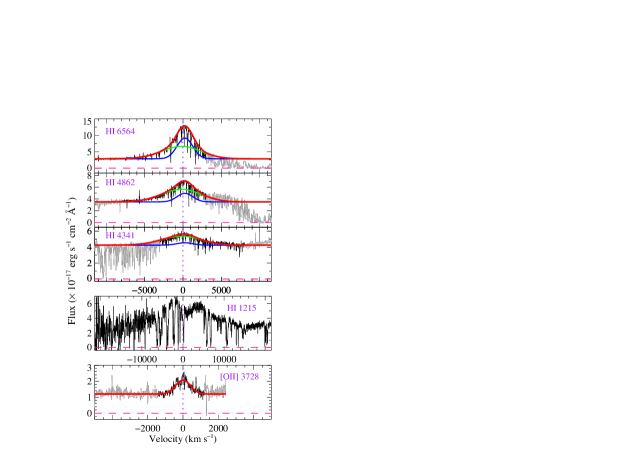
We detect [O ii]3728, Ly, H, H, and H emission lines associated with the quasar, as shown in Fig. 2. A Gaussian function fitted to the [O ii] emission line doublet gives = 1.70441 0.00011, which is adopted as the systemic redshift of the quasar. We simultaneously fit a 2-component Gaussian function on the hydrogen Balmer emission lines, and obtain = 1.70668 0.00002, FWHMN = 2344 km s-1 and = 1.70272 0.00005, FWHMB = 6048 km s-1 as the redshift and FWHM of the narrow and broad components of the fit, respectively (see Fig.2).
 |
 |
 |
3.2 Reconstructing the DLA absorption profile
As mentioned earlier, the DLA absorption trough is almost completely filled with the leaked emission from the BELR of the quasar. In this section, we model the Ly and N v emission lines from the BELR, and predict the amount of neutral hydrogen that is needed to reproduce the shape of the observed spectrum in the Ly spectral region. In our models, we assume that the Ly and N v emission lines are each composed of a narrow and a broad component, similar to what is seen for H-Balmer lines (see section 3.1). During calculations, the redshift of the DLA is fixed to the value obtained for the main component of the low-ion species ( = 1.70465). Below, we briefly explain how the reconstruction is performed.
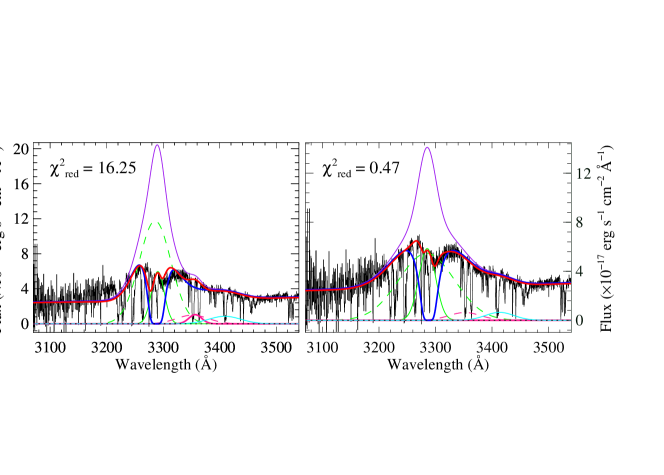
First, we define the quasar’s reddened continuum as a power law function with = +1.5. The power law index, , is obtained by fitting the quasar continuum observed at 3700, 4300, and 4660 Å. The broad component of Ly (dashed green curve in Fig. 3) and N v (dashed pink curve) BEL are then added to this continuum to produce the spectrum seen by the DLA cloud. The resulting spectrum after passing through the DLA is shown as a blue curve in Fig. 3. Here, we assume that the covering factor of the broad component of these emission lines is 1.0. The final simulated spectrum, which is shown as a red curve in Fig. 3, is obtained by adding to the blue curve the narrow components of the Ly and N v BEL profiles, which are assumed to have covering factor of 0.0.
We first tried to reconstruct the observed spectrum with the maximum number of fixed parameters. The result is shown in the left panel of Fig. 3, and the parameters of the fit are listed in the third column of Table 1. In this model, the redshifts and the widths of the emission lines were fixed to those of the H-Balmer lines. The H i column density and the amplitude of the emission lines are the only free parameters in this model. The final fit, which is shown as a red curve in the left panel of Fig. 3, has a reduced chi-square of = 16.25 and does not match the observed spectrum very well especially near the blue wing of the Ly emission line. We, therefore, tried to construct a second model in which we also relax the redshift and the width of the BLR Ly emission line components. The result of this new model, which now fits the observed spectrum more satisfactorily with = 0.47, is shown in the right panel of Fig. 3, and the parameters of the fit are listed in the fourth column of Table 1. This model converges with log (H i) = 21.0. We also checked that H i column densities smaller than 20.70 and larger than 21.30 results in fits with large . Therefore, in this work, we adopt log (H i) = 21.0 0.3. We emphasize that the H i column density is not very sensitive to the choice of the free parameters, thanks to the presence of the shallow dip seen around 3300 Å, which strongly constrains the H i column density to be 1021cm-2.
| Model(1) | Model(2) | ||
| 1 | log (H i) | 21.1 0.30 | 21.0 0.30 |
| 2 | 1.70465 | 1.70465 | |
| 3 | 11.75 | 5.46 | |
| 4 | 0.51 | 1.07 | |
| 5 | 0.99 | 0.63 | |
| 6 | 1.06 | 0.00 | |
| 7 | 1.70272 | 1.70159 | |
| 8 | 1.70668 | 1.70241 | |
| 9 | 1.70272 | 1.70272 | |
| 10 | 1.70668 | 1.70668 | |
| 11 | FWHM | 6048 | 10550 |
| 12 | FWHM | 2344 | 3180 |
| 13 | FWHM | 6048 | 6048 |
| 14 | FWHM | 2344 | 2344 |
3.3 Elemental abundances and depletion
In this DLA, we detect metal absorption lines from O i, O i∗∗, Si ii, Si ii∗, C i, C i∗, C i∗∗, C ii, C ii∗, S ii, Fe ii, Zn ii, Al ii, Al iii, Mg i, Mg ii, Ca ii, Na i, Cl i, C iv, Si iv, and N v. The velocity plots and vpfit (Carswell & Webb, 2014) solutions for some important transitions are shown in Fig. 1 and the derived total column densities are listed in Table 2. We used the same technique as in Fathivavsari et al. (2013) to fit the absorption lines. We simultaneously fit five Fe ii transitions to derive the redshifts and the Doppler -parameters of individual components. The fits to the other low-ion transitions were conducted by fixing the redshifts and the -values to those obtained for Fe ii. The metallicity of the DLA is [S/H] = 0.41 0.30 and [Zn/H] = 0.36 0.30. The abundance of iron relative to sulphur and Zinc (i.e. [Fe/S] = 1.93 0.10, [Fe/Zn] = 1.98 0.10) suggests that the heavy elements are highly depleted onto dust grains. Indeed, the quasar continuum is strongly reddened. Solar photospheric abundances used here were taken from Asplund et al. (2009).
3.4 Partial coverage
The flat-bottomed structure of the C iv absorption profiles suggests that they are saturated. However, as shown in Fig. 1, the residual flux at the bottom of the profiles does not reach zero intensity, implying that the C iv absorber may not be fully covering the C iv BELR of the quasar. In the upper C iv panel in Fig. 1, we show that it is not possible to fit the observed spectrum without correcting for partial coverage. Indeed, after correcting for the residual flux, we could successfully fit the observed spectrum (see the lower C iv panel in Fig. 1). The subtracted residual flux amounts to about 7.5 per cent of the continuum and BLR emission. This implies that 19 per cent of the C iv BELR is not covered by the C iv phase of the cloud.
In our spectrum, we also detect absorption from C i multiplets associated with the DLA in three different spectral regions, with one multiplet (i.e. C i 1560) located on the red wing of the quasar C iv emission line. As shown in Fig. 1, we could successfully conduct a 2-component fit on the C i multiplet transitions without invoking partial coverage. This may imply that the C i-bearing gas fully covers the BELR of the quasar at the corresponding velocity. However, we checked that even if we remove residual flux of up to 10 per cent from the bottom of the C i 1560 absorption lines, we could still consistently fit the C i multiplet transitions, without increasing the of the fit by more than 5 per cent. Therefore, the observed C i multiplet absorption lines are not inconsistent with the presence of partial coverage. Higher spectral resolution would allow a deeper investigation of this issue.
[b] S ii Fe ii Zn ii Si ii O i Na i C i C i∗ C i∗∗ 15.71 14.16 13.20 15.63 16.48 12.94 14.30 14.76 14.74
4 Constraining the DLA location and size from fine structure lines
Partial coverage of the Ly BELR along this line of sight implies that the cloud transverse size should be smaller than the projected size of the BELR whose typical size is of the order of 1 pc (Kaspi et al., 2005). Below, we constrain the DLA size using the physical state of the gas derived from the observation of the C i fine structure transitions.
The observed column density ratios of the C i multiplet populations detected in the DLA are (C i∗)/(C i) 2.88 and (C i∗∗)/(C i) 2.75. The high values of these ratios imply that the fine structure states are thermalized in the cloud. As shown in figure 11 of Jorgenson et al. (2010), the level populations at low densities (i.e. 1000 cm-3) depend on the strength of the incident radiation field, . We extend their calculations to higher values of and find that to match the observations, a radiation field with an intensity of = 1.4 10-16 erg s-1 cm-2 Hz-1 sr-1 is needed. On the other hand, if the density of the gas is high enough (e.g. 1000 cm-3), then collisional excitation alone will be sufficient to thermalize the system. In this case, the presence of the incident radiation field will have no further effect on the population of the fine structure states.
If were known, this would in principle allow us to constrain the density, . Here, we follow the technique introduced by Wolfe et al. ( 2003 ; see also Srianand et al., 2005), using the C ii∗ optical depth, to estimate an upper limit to the intensity of the radiation field, , to which the DLA gas is exposed. Since C ii and C ii∗ absorption lines are saturated in the spectrum, we assume [C/H] = [S/H] and obtain log (C ii) = 17.02. We further assume (C ii∗)/(C ii) 2.0 (see upper panel of figure 4 in Silva & Viegas, 2002) and get log (C ii∗) 17.32. The radiation field intensity, , is determined by assuming a steady state condition and equating the heating rate, , with the cooling rate, . The heating rate is given by
| (1) |
where is the dust-to-gas ratio, , the grains heating efficiency, and , the intensity of the radiation field in erg s-1 cm-2 Hz-1 sr-1. The dust-to-gas ratio is calculated using equation 7 of Wolfe et al. (2003). With minimal depletion model, we get = 0.30 while maximal depletion model results in = 0.48. In this work, we adopt the mean value of = 0.39. Depending on the temperature of the cloud, the grains heating efficiency, , varies between 0.05 and 0.09 (Bakes & Tielens, 1994; Wolfire et al., 1995, see their figure 1). Adopting = 0.07 as in Wolfe et al. (2008) , and using equation 1, we obtain the heating rate as = 2.73 10-7 . The cooling rate, on the other hand, is = 2.8910-20(C ii∗)/(H i) 7.59 10-24 erg s-1 H-1. By equating the cooling rate with the heating rate, we get 2.78 10-17 erg s-1 cm-2 Hz-1 sr-1 as an upper limit to the intensity of the radiation field that is impinging upon the DLA cloud. This value of is 5 times lower than what is needed to thermalize the C i fine structure levels (see above), implying that these fine structure states are thermalized predominantly through collisional excitation.
With the above limit on , the observed (C i∗)/(C i) and (C i∗∗)/(C i) ratios can be reproduced only when > 1000 cm-3. This results in a characteristic size of the cloud of = (H i)/ 0.32 pc. One can also use the quasar luminosity, ( = 2.28 1027 erg s-1 Hz-1), to derive from the upper value on a lower limit of 66 pc for the DLA-quasar separation.
Grains in the DLA clouds are mainly heated by photons with energy = 613.6 eV (Wolfe et al., 2003). As these photons can reach deeper into the cloud, they are absorbed by dust. When this extinction by dust grains is taken into account, the lower limit to the DLA-quasar separation decreases to 39 pc.
5 Summary and Conclusions
We reported the discovery of the first ghostly DLA found along the line of sight to the quasar SDSS J11330057. No Ly absorption line is seen in the quasar spectrum at the redshift of the detected low-ion species such as C i, Na i, Ca ii, etc because the leaked emission from the Ly BELR fills the DLA absorption trough. The DLA cloud is small ( 0.32 pc), and is located at 39 pc from the central AGN thus not covering entirely the broad line region.
Interestingly, this ghostly DLA has characteristics similar to those of the ’eclipsing’ DLA found along the line of sight to the quasar J08230529 (Fathivavsari et al. 2015). Both DLAs have very small sizes and are located close to the central AGN. However, in contrast to the newly found ghostly DLA, the eclipsing DLA towards J08230529 shows strong DLA absorption profile in the quasar spectrum. This implies that the eclipsing DLA, with a transverse size of 2.3 (H i) 9.1 pc, blocks most of the radiation emitted by the quasar BELR. Because of the sub-parsec size of the ghostly DLA, most emission from the quasar Ly BELR is freely passing by the DLA and consequently filling the DLA absorption trough, resulting in the observed spectral profile shown in Fig. 3. It could be possible that the two (ghostly and eclipsing) DLAs are from the same population and are just two stages of the same flow. Eclipsing DLAs could turn into ghostly DLAs as strong outflowing material from the central AGN strikes and compresses them into clouds of smaller size and higher density. Statistical study of a large sample of ghostly and eclipsing DLAs would in principle allow us to confirm whether there is any connection between the two absorbers, and what importance they have over the whole DLA population.
References
- Asplund et al. (2009) Asplund, M., Grevesse, N. et al., 2009, ARA&A, 47, 481
- Bakes & Tielens (1994) Bakes, E. L. O., Tielens, A. G. G. M., 1994, ApJ, 427, 822
- Cano-Díaz et al. (2012) Cano-Díaz, M., Maiolino, R. et al., 2012, A&A, 537,8
- Carniani et al. (2016) Carniani, S. et al., 2016, A&A, 591, 28
- Carswell & Webb (2014) Carswell R.F., Webb J. K., 2014, vpfit, Astrophysics Source Code Library ascl:1408.015
- Fathivavsari et al. (2013) Fathivavsari, H., Petitjean, P. et al., 2013, MNRAS, 435, 1727
- Fathivavsari et al. (2015, 2016) Fathivavsari, H., Petitjean, P. et al., 2015, MNRAS, 454, 876
- Fathivavsari et al. (2016) Fathivavsari, H., Petitjean, P. et al., 2016, MNRAS, 461, 1816
- Finley et al. (2013) Finley, H. et al., 2013, A&A, 558, 111
- Jorgenson et al. (2010) Jorgenson, R. A. et al., 2010, ApJ, 722, 460
- Kaspi et al. (2005) Kaspi, S. et al., 2005, ApJ, 629, 61
- Ledoux et al. (2015) Ledoux, C., Noterdaeme, P. et al., 2015, A&A, 580, 8
- Martin et al. (2016) Martin, D. C. et al., 2016, ApJ, 824, 5
- Namekata, Umemura & Hasegawa (2014) Namekata, D., Umemura, M., Hasegawa, K., 2014, MNRAS, 443, 2018
- Noterdaeme et al. (2009) Noterdaeme, P., Petitjean, P. et al., 2009, A&A, 505, 1087
- Petitjean et al. (2000) Petitjean, P., Aracil, B. et al., 2000, A&A, 359, 457
- Prochaska & Herbert-Fort (2004) Prochaska, J. X., Herbert-Fort, S., 2004, PASP, 116, 622
- Sánchez Almeida et al. (2015) Sánchez Almeida, J., Elmegreen, B. G. et al., 2015, ApJ, 810, 15
- Silk & Rees (1998) Silk, J., Rees, M. J., 1998, A&A, 331, 1
- Silva & Viegas (2002) Silva, A. I., Viegas, S. M., 2002, MNRAS, 329, 135
- Srianand et al. (2005) Srianand, R., Petitjean, P. et al., 2005, MNRAS, 362, 549
- van de Voort et al. (2012) van de Voort, F., Schaye, J. et al, 2012, MNRAS, 421, 2809
- Vernet et al. (2011) Vernet, J. et al., 2011, A&A, 536, 105
- Wolfe et al. (2003) Wolfe, A. M., Prochaska, J. X., Gawiser, E., 2003, ApJ, 593, 215
- Wolfe et al. (2008) Wolfe, A. M. et al., 2008, ApJ, 681, 881
- Wolfire et al. (1995) Wolfire, M. G. et al., 1995, ApJ, 443, 152