Detection of polarized quasi-periodic microstructure emission in millisecond pulsars
Abstract
Microstructure emission, involving short time scale, often quasi-periodic, intensity fluctuations in subpulse emission, is well known in normal period pulsars. In this letter, we present the first detections of quasi-periodic microstructure emission from millisecond pulsars (MSPs), from Giant Metrewave Radio Telescope (GMRT) observations of two MSPs at 325 and 610 MHz. Similar to the characteristics of microstructure observed in normal period pulsars, we find that these features are often highly polarized, and exhibit quasi-periodic behavior on top of broader subpulse emission, with periods of the order of a few s. By measuring their widths and periodicities from single pulse intensity profiles and their autocorrelation functions, we extend the microstructure timescale - rotation period relationship by more than an order of magnitude down to rotation periods 5 ms, and find it to be consistent with the relationship derived earlier for normal pulsars. The similarity of behaviour is remarkable, given the significantly different physical properties of MSPs and normal period pulsars, and rules out several previous speculations about the possible different characteristics of microstructure in MSP radio emission. We discuss the possible reasons for the non-detection of these features in previous high time resolution MSP studies along with the physical implications of our results, both in terms of a geometric beam sweeping model and temporal modulation model for micropulse production.
Subject headings:
pulsars: general — pulsars: individual (J0437-4715, J2145-0750) — methods: observational — techniques: polarimetric1. Introduction
Millisecond pulsars (MSPs), having rotation periods ranging from about one
millisecond to few tens of milliseconds, have contributed significantly to our
understanding of stellar evolution and the pulsar radio emission process.
Believed to arise as the end products of mass accretion from a companion, the
high rotation frequencies of these objects imply that the co-rotating
magnetosphere (and hence the radio emission region) is significantly smaller in
these sources compared to normal period pulsars. Nonetheless, previous studies
have shown that although MSPs have drastically different physical parameters as
compared to those of normal period pulsars, there are striking similarities in
their radio emission properties as well as interesting differences (e.g.
Kramer et al. 1998; Sallmen 1998; Kramer et al. 1999a).
Single pulses in normal period pulsars are known to exhibit a rich variety of
short time-scale variations. In particular, microstructure emission has been
long known to be a common feature of single pulse emission (first detected by
Craft et al. 1968), and typically involves intensity variations at milli-period
timescales, corresponding to timescales of a few hundred microseconds for
normal period pulsars (e.g. Hankins 1972). Previous studies have shown that
these features have typical widths for a given pulsar, and often appear as a
train of
quasi-periodic pulses, with their timescales showing a strong correlation with
the pulsar period (e.g. Kramer et al. 2002; Mitra et al. 2015).
The characterization of microstructure emission in MSPs still remains as one of
the elusive aspects of the field. The single pulse properties (excluding giant
radio pulses) of only 4 MSPs have been explored till date — PSR J0437-4715
(Jenet et al. 1998), PSR B1534+12 (Sallmen 1998), PSR J1713+0747 (Liu et al.
2016) and PSR B1937+21 (Jenet et al. 2001). Jenet et al. 1998 did one of the
highest time resolution single pulse studies ever done on MSPs, observing the
MSP J0437-4715 at L band, and reported that there was no evidence of
microstructure down to a time resolution of 80 ns. Similar reports were
provided by Sallmen 1998 for B1937+21 and B1534+12, and by Liu et al. 2016 for
J1713+0747, claiming the absence of microstructure down to sub-microsecond time
resolutions. However, the very limited number of such studies, particularly
with high time resolution and sensitivity at low frequencies, leave a
significant parameter space of this field unexplored.
Observations of sub-structures in MSP single pulses is challenging for a
good number of reasons. On one hand, they are known to be relatively less
luminous compared to their slower counterparts, and on the other, they require
significantly higher time resolutions to study. While observations at low
frequencies are favorable owing to the steep spectra of these sources, the
effects of the interstellar medium, unless removed, pose a challenge to very
high time resolution studies. Hence, in order to do such studies, one requires
a telescope with very high sensitivity to be capable of detecting single
pulses with good SNRs, as well as an appropriate backend capable of mitigating
the dispersive effects of the interstellar medium with coherent dedispersion
over reasonably large bandwidths. The Giant Metrewave Radio Telescope (GMRT)
provides a unique platform to revisit some important unanswered questions on
the
single pulse properties of MSPs, capitalizing on its high sensitivity at metre
wavelengths, and the recent development of a real-time coherent dedispersion
system (De & Gupta 2016). In this paper, we present results from a study of
the full polarization properties of single pulses in two millisecond pulsars,
concentrating on the characteristics of microstructure emission and its
timescales.
2. Observations
The GMRT is a multi-element aperture synthesis telescope, consisting of 30
antennas, each with a diameter of 45 metres, separated by a maximum baseline of
25 km (Swarup et al. 1997). It can also be used for studies of compact objects
like pulsars, by adding the signals from the antennas in an array mode (Gupta
et al. 2000). We present observations of two MSPs (PSR J0437-4715 and PSR
J2145-0750) at 325 MHz and 610 MHz, selected based on their catalogued fluxes
at 400 MHz (S400 100 mJy) and Dispersion Measures (DM 20 pc/cc).
As we expect to see microstructure emission at time scales of 0.001 P, the
criterion for the
selection of frequency bands was such that the expected scattering time scale
at each frequency band (see Table 1) was smaller than the
expected microstructure timescales. Wherever possible, we divided our observing
time into multiple epochs to capitalize on serendipitous increase in the pulsar
flux density due to refractive scintillation.
The observations were carried out using the Phased Array (PA) voltage beam mode
(typically combining 14 - 16 antennas) of the GMRT Software Backend (GSB; Roy
et al. 2010), which records the full Nyquist time resolution dual polarization
voltage spectra for a given bandwidth, from a single phased array beam of the
telescope. The recorded voltages were subsequently coherently dedispersed using
an offline version of the recently developed real-time coherent dedispersion
pipeline (De & Gupta, 2016). The coherently dedispersed voltages (for two
circular polarizations) were used to construct Stokes spectra with the desired
time resolution (see Table 1). The time resolution used was
optimized to detect sub-structures in single pulses with enough SNR, as well as
to have similar phase resolutions for the two pulsars. Frequency dependent
instrumental gains were corrected using the time averaged spectra for each
polarization signal, while frequency dependent phases due to instrumental
delays and Faraday rotation were corrected by fitting the linear polarisation
angle of the average profile as a function of frequency across the band. The
specific details of the observing parameters used for each epoch, along with
the known parameters of the pulsars are given in Table 1.
| Pulsar Name | Frequency Band | Bandwidth | Duration | NP | Resolution | MJD | Period | DM | S400 | RM | |
|---|---|---|---|---|---|---|---|---|---|---|---|
| MHz | MHz | sec | s (deg) | ms | pc/cc | mJy | rad m-2 | s | |||
| J0437-4715 | 610 | 32 | 1500 | 260534 | 0.96 (0.06) | 57367 | 5.7574 | 2.6448 | 550 | 0.0 | 0.004 |
| J2145-0750 | 610 | 32 | 1920 | 119608 | 3.84 (0.08) | 57367 | 16.0524 | 8.9976 | 100 | -1.3 | 0.031 |
| J2145-0750 | 325 | 32 | 600 | 37377 | 3.84 (0.08) | 57367 | 16.0524 | 8.9976 | 100 | -1.3 | 0.351 |
| J0437-4715 | 325 | 32 | 1200 | 208427 | 0.96 (0.06) | 57380 | 5.7574 | 2.6448 | 550 | 0.0 | 0.047 |
| J2145-0750 | 325 | 32 | 1500 | 93444 | 3.84 (0.08) | 57381 | 16.0524 | 8.9976 | 100 | -1.3 | 0.351 |
| J0437-4715 | 610 | 32 | 900 | 156320 | 0.96 (0.06) | 57389 | 5.7574 | 2.6448 | 550 | 0.0 | 0.004 |
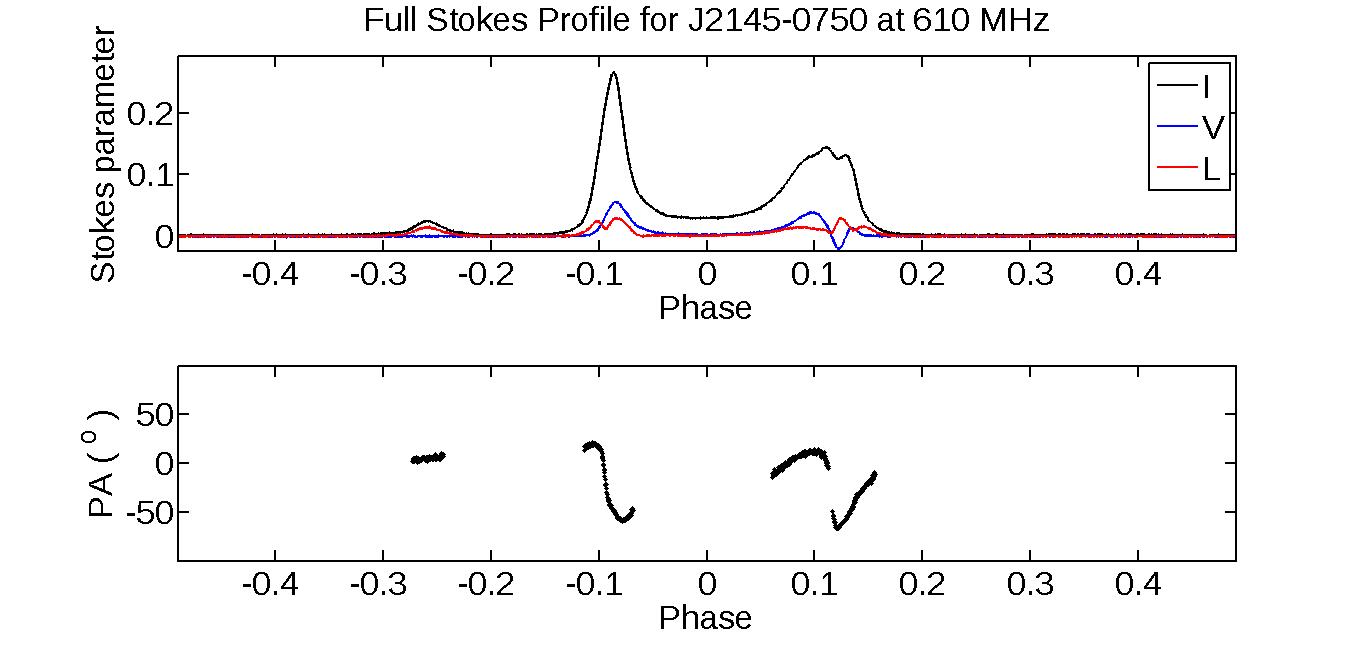
3. Data Analysis
The baselines for the individual Stokes parameters , , and were
adjusted to zero mean for all the data sets. We use the symbol
to represent the total linear polarized intensity, and
to represent the angle of the linear
polarization. For the individual folded profiles, we plot only if
exceeds three times the baseline root mean square (RMS) noise. For PSR
J2145-0750, we did not detect a significant number of single pulses with high
SNR (peak10 baseline rms) in our 325 MHz data, and hence we do not include
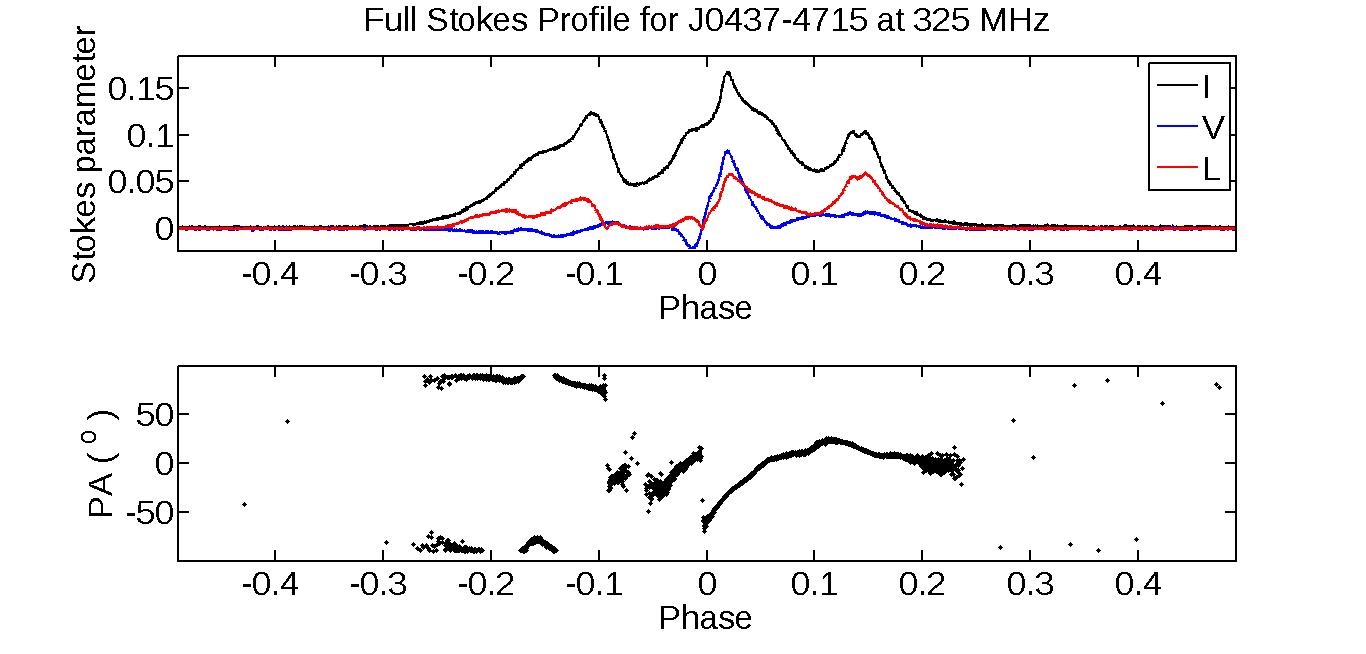
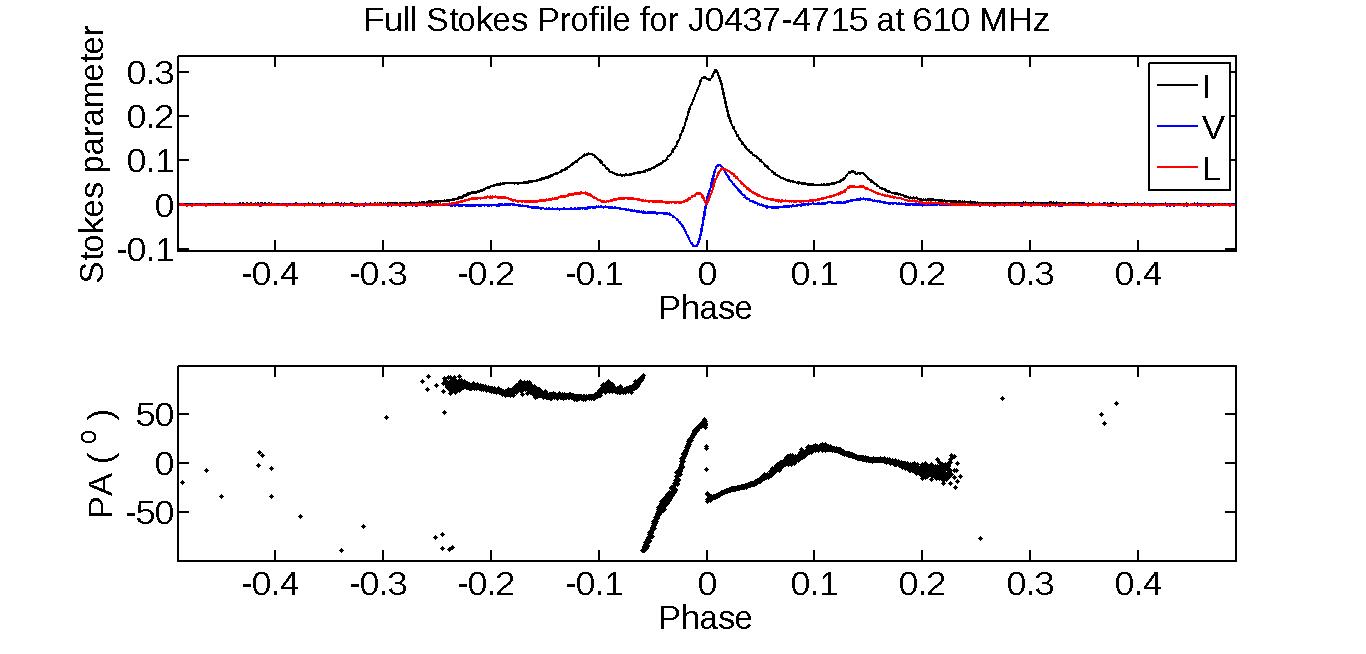
this data in our subsequent analysis. The folded profiles from our observations
at each frequency band are given in Figures 1 and
2, for the pulsars J0437-4715 (at 325
MHz and 610 MHz) and J2145-0750 (at 610 MHz) respectively, which are consistent
with previously published polarization profiles at these frequencies (Navarro
et al. 1997; Stairs et al. 1999).
3.1. Autocorrelation Function
The timescales of microstructure emission, i.e., their widths and periodicity
(if present) are of fundamental importance in microstructure studies. The
Autocorrelation Function (ACF) is a useful tool to measure these timescales in
individual pulses, as well as to detect the presence of ‘preferred’ timescales
(if any) in a large ensemble of pulses. We use the definition of the ACF given
in Lange et al. 1998 for our analysis. In normal period pulsars, the ACFs of
individual subpulses are primarily dominated by a smooth bell shaped curve
centered at zero lag, with micropulses forming weak (or occasionally strong)
modulations on the broader decline of the ACF. In cases where quasi-periodic
microstructure is present, they form periodic maxima in the ACF, with the time
lag of the first peak representing the characteristic separations of the
micropulses (e.g. Cordes at al. 1990).
3.2. Searching for periodic microstructure
We searched for the presence of microstructure in our data set by browsing
through hundreds of single pulses from each observation. While we did attempt
to find the presence of microstructure numerically, as done previously using
ACF slope-flattening / maxima searches (e.g. Lange et al. 1998), we found that
the diverse morphology of single pulses, along with the lack of a large number
of single pulses with very high SNR made such automated techniques difficult to
implement accurately. Hence, for each pulsar (at each frequency band),
we manually browsed through the brightest single pulses (with a peak SNR
threshold above a certain value) closely examining their morphology and ACFs.
When periodic micropulses were found by visual inspection of the single pulse
time series, we cross-checked the ACF for the presence of periodic maxima
consistent with the separations and widths of the time domain features, and if
present, recorded the first maxima in the ACF as the periodicity of the
micropulses. Since both pulsars in our sample have low DMs, we also examined
the off-pulse region around pulses which show microstructure, along with the
corresponding zero DM time series, to exclude the possibility of RFI features
mimicking microstructure, and did not find evidence for such contamination.
Unless mentioned otherwise, we refer only to timescales of Stokes I in
subsequent discussion.
4. Results
4.1. PSR J0437-4715
We found a large number of single pulses with high SNR (with threshold set at
peak 15 baseline RMS) from this source — detecting 100 pulses at 325
MHz and 800 pulses at 610 MHz . The brightest single pulses are
often highly polarized narrow spikes of emission, with widths 10 s and
no sub-structure apparent down to our time resolutions, consistent with
previous reports by Jenet et al. 1998. Manually browsing these pulses, we
found a significant number ( 10 %) of pulses exhibiting microstructure
at 610 MHz (which are not necessarily the brightest pulses in the data set). We
further detected microstructure in a few bright pulses at 325 MHz, although the
number of such pulses was lower due to the relatively lower SNR of the data. A
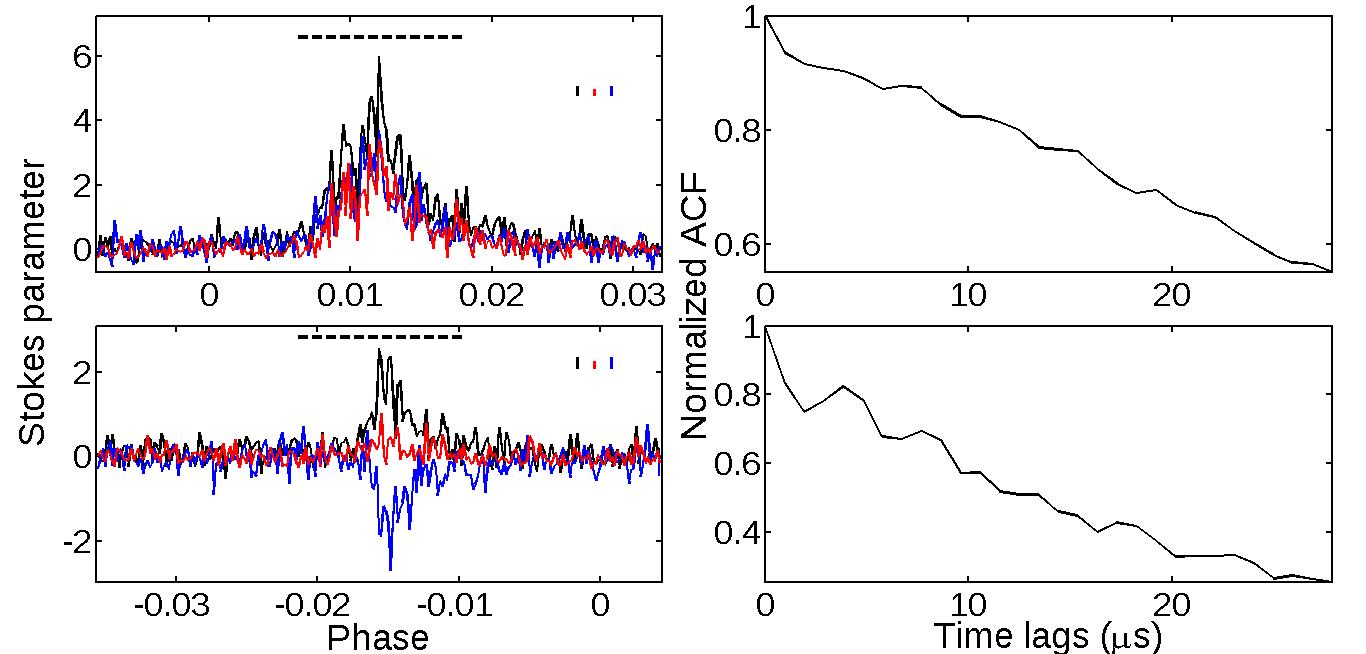
few such sample pulses from this source, exhibiting polarized quasi-periodic
microstructure are shown in Figure 1.
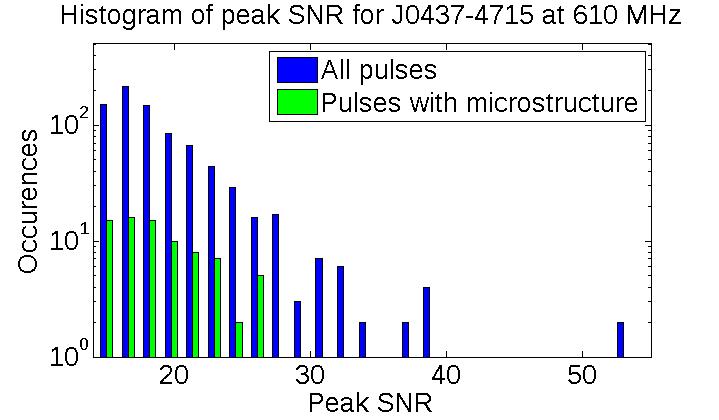
Micropulses, when present, are typically highly polarized, and appear either
in the form of a train of 3 or more quasi-periodic modulations, or in the form
of single pairs of micropulses. The modulations appear in Stokes I, L and V,
and are typically weak compared to the underlying subpulse emission. As
most micropulses appear in the form of close unresolved trains, it was not
possible to measure their widths from the single pulse ACFs. Hence, we
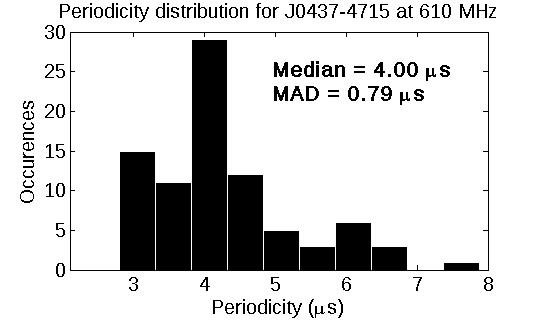
recorded only the micropulse periodicities from the ACFs, and show their
distribution in Figure 3, along with the SNR distribution of
all pulses and pulses which exhibit microstructure. We note, however, that
when micropulses are resolved, their widths are typically 2 s, and
hence unresolved with typical periodicities of 4 s. The smaller
number of bright pulses exhibiting microstructure at 325 MHz did not allow us
to construct meaningful distributions. Nonetheless, we report a median
periodicity of 4.72 s found in quasi-periodic microstructure for this
source at 325 MHz.
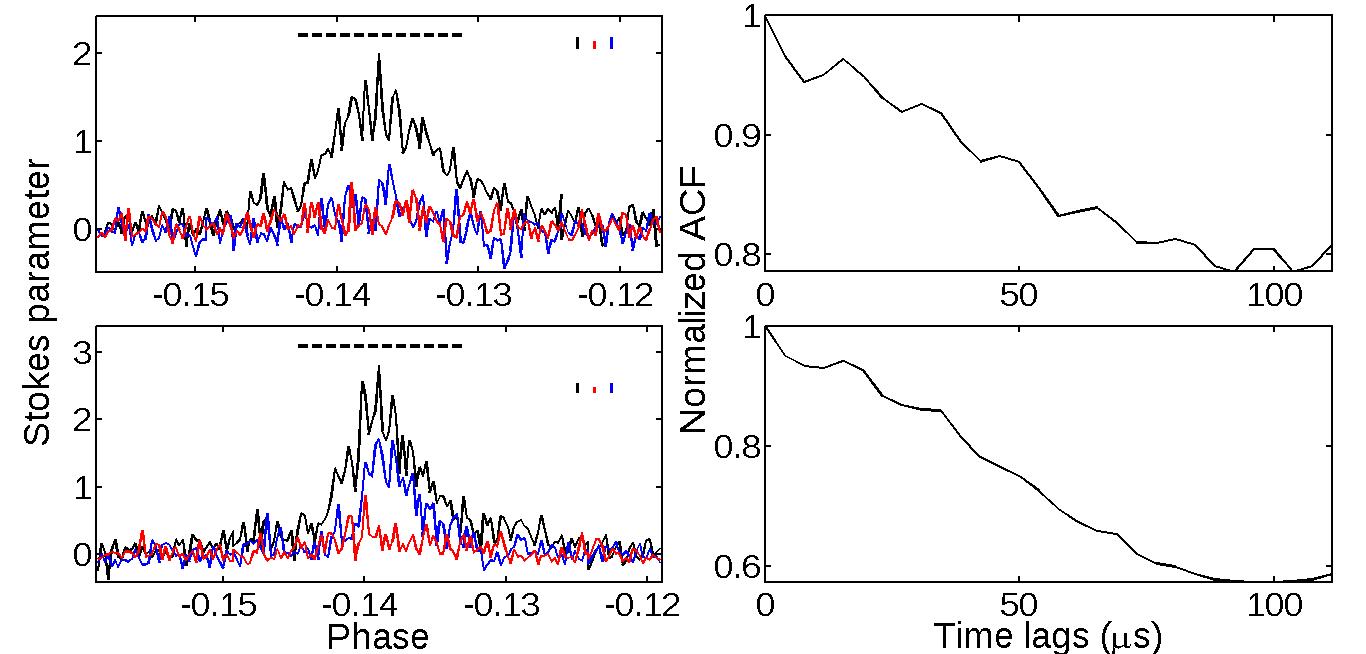
4.2. PSR J2145-0750
We did not detect a significant number of single pulses with high SNR (peak
10 baseline RMS) in any of the two observing epochs for this source at 325 MHz.
However, in the single observing epoch at 610 MHz, we found single
pulses with peak 15 baseline RMS. Browsing these single pulses, we found a
good fraction ( 15 %) of the pulses to exhibit polarized quasi-periodic
microstructure. Similar to J0437-4715, the brightest pulses are devoid
of microstructure and exhibit a broad emission component only, while the
relatively fainter pulses exhibiting microstructure consist of a broad subpulse
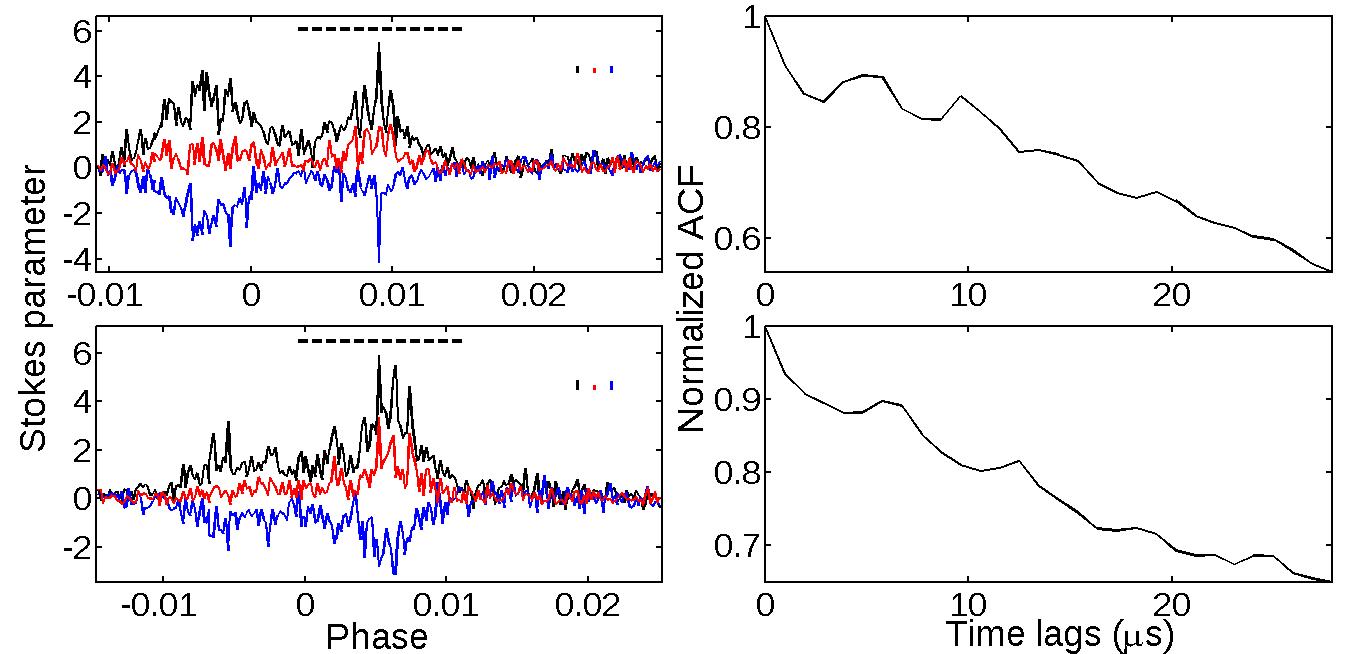
component with weak modulations. A few typical pulses exhibiting
quasi-periodic microstructure are shown in Figure 2.
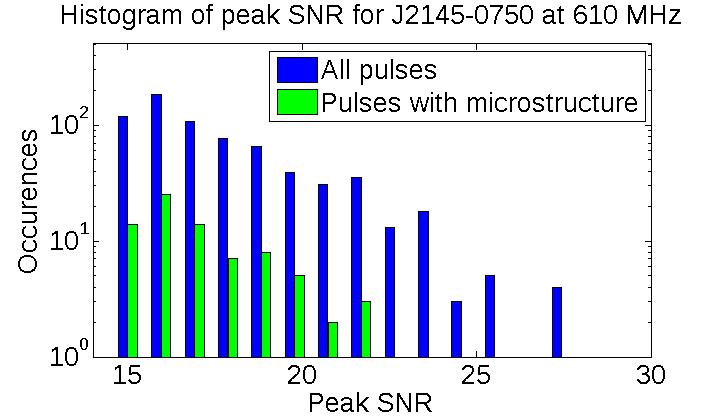
We find micropulses to be highly polarized in this source, occasionally showing
very high levels of circular polarization (see for example, the lower panel in
Figure 2 (a)). Resolved micropulses are virtually
absent in this source, as they always appear in quasi-periodic trains of 4 or
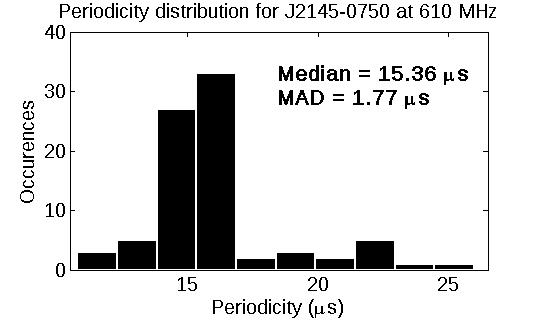
more micropulses. As a result, we recorded only the periodicities of
the microstructure from the single pulse ACFs, and show their distribution in
Figure 3, along with the distribution of SNR, as in the case
of J0437-4715. Nonetheless, the microstructure periodicities suggest that the
individual micropulse widths are 8 s.
5. Discussion
The origin of microstructure emission remains as one of the most perplexing
unanswered questions in our understanding of pulsar radio emission even though
it is well established that microstructure is indeed an integral component of
the emission process. In this paper, we have reported on the first detections
of microstructure emission in millisecond pulsars, which suggests that despite
of the significant differences in the physical parameters of their
magnetospheres, microstructure remains as one of the fundamental properties of
radio emission in these sources. Indeed, the observation that the pulses
exhibiting microstructure are typically not the brightest pulses in
our data set suggests that there is likely an ensemble of weaker pulses below
our detection threshold which exhibit microstructure, thereby indicating that
it may be a fairly common occurrence in MSPs.
It is instructive to reflect upon the reasons for non-detection of these
features in previous high time resolution studies of MSPs. Firstly, it is
important to note that the majority of previous single pulse studies of MSPs
have had very limited sensitivity towards detection of single pulses, and have
concentrated on statistics of accumulated pulses over many periods (e.g. Jenet
et al. 2001). Our study is one of the first reports of high sensitivity, high
time resolution observations at relatively low frequencies (at and below 600
MHz), which forms an ideal combination for detection of micropulses from MSPs.
Interestingly, Jenet et al. 1998 did a study on J0437-4715 with similar
sensitivities at 1.4 GHz, and claimed that there was no evidence for
microstructure emission. However, we note that their analysis concentrated on a
search for microstructure features in the average ACF of single pulses, which
often does not show the expected ‘breaks’ when microstructure is weak or does
not have a preferred timescale (Cordes et al. 1990). More recently, Liu et al.
2016 reported on the non-detection of microstructure emission in PSR J1713+0747
at L band, by analyzing the properties of the averaged ACF as well as single
pulse ACFs of the brightest pulses. We note that higher frequency
non-detections may also be due to a steeper spectrum of micropulses compared to
subpulse emission (as shown for B2016+28 by Cordes et al. 1990).
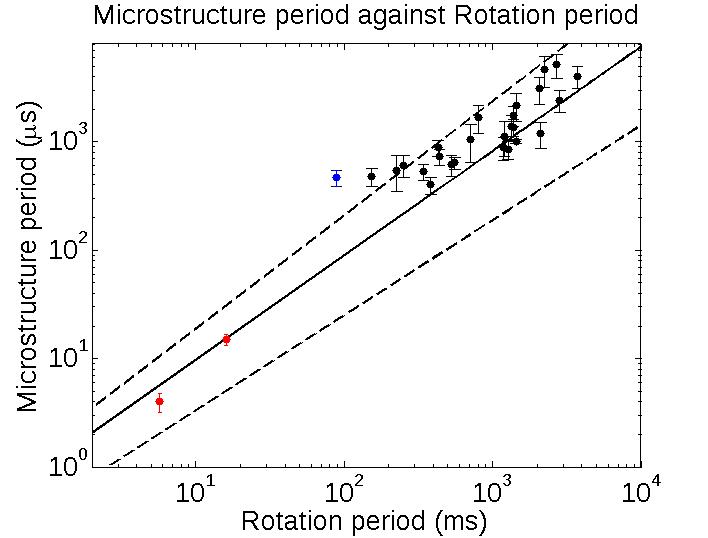
We now use our results to examine the microstructure quasiperiodicity - pulsar rotation period relationship down to the millisecond rotation periods, using the median quasi-periodicity of the distributions (Figure 3) as the typical periodicity and their median absolute deviation (MAD) as the characteristic scatter. Since we find micropulses to be mostly unresolved from the underlying quasi-periodicity, it is difficult to estimate their intrinsic widths and hence, we do not discuss the micropulse width - rotation period relationship. We use previously reported microstructure periodicites in Kramer et al. 2002 (Table 2) and Mitra et al. 2015 (Table 3) along with our new results to extend the relationship. Note that previous reports combine observations from multiple frequencies of observation, and in cases where multiple reports were present (at different frequencies, different analysis techniques or for different subpulse components), we only used the results with reported uncertainty estimates and averaged their timescales for our analysis. While there is some weak evidence for change in microstructure timescales across frequencies, the dependence is known to be very weak (e.g. Kramer et al. 2002; Hankins et al. 1976; Ferguson & Seiradakis 1978). Hence, we do not expect such averaging to change the properties of the relationship significantly. As shown in Figure 4, we derive a relationship of
| (1) |
where is the typical microstructure periodicity in units of s
and is the rotation period in units of ms. The uncertainties shown are at
95% confidence level. The relationship is consistent with the linear
relationships derived by Cordes et al. 1979 and Mitra et al. 2015 from data for
only normal period pulsars. This result indicates that there is a striking
similarity of the properties of microstructure emission in normal and recycled
pulsars.
Lastly, we note that while we have presented here an analysis of the timescales
of Stokes I only, we were also able to measure the periodicities of Stokes V
and Stokes L in cases where micropulses were highly polarized. While we did
find that the periodicities in Stokes I, V and L were largely similar, the
lower SNR of the Stokes V and L profiles prevented a statistically accurate
conclusion about their consistency. Additionally, the low SNR of the Stokes L
profiles did not allow a close examination of the behavior of the PA across
individual micropulses. Indeed, recent reports by Mitra et al. 2015 have
suggested that the periodicities in these parameters are consistent with each
other, leading them to argue that microstructure does not arise from
single particle curvature radiation in vacuum.
However, the stability of the micropulse timescale - rotation period
relationship down to millisecond periods does support a geometric origin of
microstructure, wherein micropulses are formed by sweeping beams of radiation
arranged longitudinally across the emission region (with constant angular
widths 0.18o). We note that the reported inconsistency of the
polarization signatures only rule out single particle curvature radiation as
the
origin of micropulse emission, but do not necessarily rule out a geometric
origin. Additionally, a radial / temporal origin of micropulse production is
also a plausible alternative. In this model, micropulses arise from a radial
modulation of the emission region, created either during the plasma production
process or by modulation during propagation. It must be noted, however, that
the
modulation mechanism must be directly associated with the pulsar
rotation period (for example, by means of rotation dependent electromagnetic
fields; Cordes et al. 1990) to account for the strong dependence of periodicity
with the rotation period. Clearly, future theoretical progress in this field
coupled with observations of a larger number of pulsars are required to resolve
these issues.
6. Summary
In this paper, we have presented the first report of detections and statistics
of quasi-periodic microstructure emission in recycled millisecond pulsars. We
find these micropulses to be often highly polarized, forming typically weak
modulations on a broader subpulse envelope. By estimating microstructure
periodicities from the single pulse ACFs, we report the first detections of
‘preferred’ microstructure periodicity in millisecond pulsars. This result
allows us to extend the microstructure timescale - rotation period relationship
by more than an order of magnitude, and thus put constraints on the geomteric
sweeping and temporal modulation models of micropulse emission. While we cannot
draw statistically significant conclusions about the detailed polarization
signatures of micropulses from our data, future high sensitivity observations
at low frequencies are expected to resolve these aspects. In particular, the
significantly larger bandwidths of the upgraded GMRT (uGMRT), which is
currently being commissioned, is likely to allow an even larger scale study of
microstructure emission in millisecond pulsars, encompassing not only their
full polarization properties but also their spectral evolution characteristics,
explored using simultaneous dual-frequency observations.
Acknowledgements
We thank the staff of the GMRT who have made these observations possible. GMRT is run by the National Centre for Radio Astrophysics of the Tata Institute of Fundamental Research. We would like to thank R. T. Gangadhara for valuable discussions, as well as the anonymous referee for the comments that helped significantly improve the paper. KD acknowledges support from a fellowship provided by the Kishore Vaigyanik Protsahan Yojana (KVPY) scheme of the Department of Science and Technology, Government of India. Partial support was provided by JC Bose Fellowship of Prof. Arnab Rai Choudhuri. This research has made use of NASA’s Astrophysics Data System Bibliographic Services.
References
- Cordes & Lazio (2002) Cordes, J. M. & Lazio, T. J. W., 2002, arXiv:astro-ph/0207156.
- Cordes et al. (1990) Cordes, J. M., Weisberg, J. M. & Hankins, T. H., 1990, AJ, 100, 1882.
- Cordes (1979) Cordes J. M., 1979, Aust. J. Phys., 32, 9.
- Craft et al. (1968) Craft, H. D., Comella, J. M. & Drake, F. D., 1968, Nature, 218, 1122.
- De & Gupta (2016) De, K. & Gupta, Y., 2016, ExA, 41, 67.
- Ferguson & Sieradakis (1978) Ferguson D. C., Seiradakis J. H., 1978, A&A, 64, 27.
- Gupta et al. (2000) Gupta, Y., Gothoskar, P., Joshi, B. C., et al., 2000, Pulsar Astronomy - 2000 and Beyond, ASP Conference Series, Vol. 202, p. 277.
- Hankins (1972) Hankins, T. H., 1972, ApJ, 177, L11.
- Hankins et al. (1976) Hankins T. H., Cordes J. M., Rickett B. J., 1976, BAAS, 8, 10.
- Jenet et al. (1998) Jenet, F. A., Anderson, S. B., Kaspi, V. M., et al., 1998, ApJ, 498, 365.
- Jenet et al. (2001) Jenet, F. A., Anderson, S. B. & Prince, T. A., 2001, ApJ, 546, 394.
- Kramer et al. (1998) Kramer, M., Xilouris, K. M., Lorimer, D. R., et al., 1998, ApJ, 501, 270.
- Kramer et al. (1999) Kramer, M., Lange, C., Lorimer D. R., et al., 1999, ApJ, 526, 957.
- Kramer et al. (2002) Kramer, M., Johnston, S. & van Straten, W., 2002, MNRAS, 334, 523.
- Lange et al. (1998) Lange, Ch., Kramer, M., Wielebinski, R., et al., 1998, A&A, 332, 111.
- Liu et al. (2016) Liu, K., Bassa, C. G., Janssen, G. H., et al., 2016, MNRAS, 463, 3239.
- Manchester et al. (2005) Manchester, R. N., Hobbs, G. B., Teoh, A., et al., 2005, AJ, 129, 4, 1993.
- Mitra et al. (2015) Mitra, D., Arjunwadkar, M. & Rankin, J. M., 2015, ApJ, 806, 236.
- Navarro et al. (1997) Navarro, J., Manchester, R. N., Sandhu, J. S., et al., 1997, ApJ, 486, 1019.
- Roy et al. (2010) Roy, J., Gupta, Y., Pen, Ue-Li, et al., 2010, ExA, 28, 25.
- Sallmen (1998) Sallmen, S. M., 1998, Thesis (PhD), Univeristy of California, Berkeley, 4177.
- Stairs et al. (1999) Stairs, I. H., Thorsett, S. E. & Camilo, F., 1999, ApJS, 123, 627.
- Swarup et al. (1997) Swarup, G., Ananthakrishnan, S., Subrahmanya, C. R., et al., 1997, High-Sensitivity Radio Astronomy, Proceedings of a meeting held at Jodrell Bank, University of Manchester, January 22-26, 1996. p.217.