A model for approximately stretched-exponential relaxation with continuously varying stretching exponents
Abstract
Relaxation in glasses is often approximated by a stretched-exponential form: . Here, we show that the relaxation in a model of sheared non-Brownian suspensions developed by Corté et al. [Nature Phys. 4, 420 (2008)] can be well approximated by a stretched exponential with an exponent that depends on the strain amplitude: . In a one-dimensional version of the model, we show how the relaxation originates from density fluctuations in the initial particle configurations. Our analysis is in good agreement with numerical simulations and reveals a functional form for the relaxation that is distinct from, but well approximated by, a stretched-exponential function.
I Introduction
The relaxations of out-of-equilibrium disordered systems can be strongly non-exponential. In many cases the time-dependence of relaxation follows the Kohlrausch-Williams-Watts stretched-exponential function:
| (1) |
where the stretching exponent parameterizes the degree of departure from a simple exponential. This functional form has been used to describe the mechanical, electric, and magnetic response of a remarkably broad range of materials, including structural glasses and polymers Williams and Watts (1970); Legrand et al. (1987); Ediger et al. (1996), spin and magnetic glasses Chamberlin et al. (1984); Coey et al. (1987), charge- and spin-density wave carriers Kriza and Mihaly (1986); Mihály et al. (1991), amorphous silicon Kakalios et al. (1987), and a crumpled sheet of mylar Kramer and Lobkovsky (1996).
Numerous models of the transport and trapping of electrons or defects have been constructed to deduce this mathematical form Grassberger and Procaccia (1982); Klafter and Shlesinger (1986); Palmer et al. (1984); Scher et al. (1991); Phillips (1996); Jund et al. (2001); Sturman et al. (2003); Lemke and Campbell (2011). However, few models address the spatial structure of crowded particles, which is important for understanding the non-exponential mechanical response of disordered particulate media such as structural glasses and soft materials, including foams, colloids, and granular matter Knight et al. (1995); Ono et al. (2003); Mattsson et al. (2009); Zou (2010).
Here we study glassy relaxation in a simplified computer simulation model of cyclically sheared particles, which we analyze in real-space. The simplest version of the model that we study is the antithesis of complexity: particles are confined to one dimension, where they interact repulsively, and only with their two neighbors. We show how a wide distribution of timescales and approximate stretched-exponential relaxation can arise from these simple ingredients. In addition, by making the interactions only slightly more complex (i.e., by allowing attractive or repulsive interactions with equal probability), we show that the stretching exponent, , can be varied between and by changing the driving amplitude.
The basic mechanism underlying the behavior of both model variants is simple and robust: particles that are crowded, due to random initial conditions, must get out of each other’s way in order to relax. In the models we study, density fluctuations occur on a wide range of scales due to the initial conditions – such disorder would be present in a glass. Because longer-wavelength crowding requires more time to expand, the end result is a broad distribution of relaxation timescales.
Relaxation of sheared suspensions.— Our model is based on simulations of a non-Brownian viscous suspension under cyclic shear. These simulations were introduced by Corté et al. Corte et al. (2008) to explain irreversibility and self-organization in particle suspensions, and they display a wealth of phenomena, including a dynamical phase transition for strains smaller than a critical amplitude Corte et al. (2008); Menon and Ramaswamy (2009); Xu and Schwarz (2013). Qualititative analogies with glassy systems were recently found near this critical point, such as spatial correlations and diverging timescales Tjhung and Berthier (2015, 2016). There are expected to be extremely homogeneous spatial distributions near the critical point Hexner and Levine (2015); Tjhung and Berthier (2015), which were observed in a closely related experiment Weijs et al. (2015). The model was also found to support multiple transient memory effects Keim and Nagel (2011); Keim et al. (2013); Paulsen et al. (2014). These transient memories are an analog in fluids of the multiple transient memories found earlier in charge-density-wave conductors Coppersmith et al. (1997); Povinelli et al. (1999). Here, we study the relaxation dynamics.
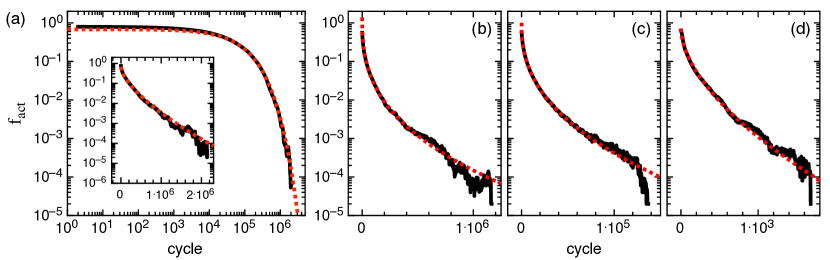
In the simulation, particles of diameter are distributed randomly in a box of area at area fraction with periodic boundary conditions. An affine shearing deformation is applied to the particle centers, with a strain amplitude that grows continuously from to . The particles are then returned to the initial configuration at zero strain. In this simplified picture of a sheared suspension, particles are allowed to overlap and pass through one another. Two particles are said to “collide” if they overlap at any point in the cycle. To simulate the effect of collisions, each colliding particle is given a small displacement in a random direction at the end of the cycle. During a given cycle, a particle is called “active” if it collides with at least one other particle (and it gets multiple kicks if it overlaps with multiple particles). These displacements have a random magnitude between and . Except where otherwise stated, we set and . (The qualitative behavior is independent of these values.) Figure 1 shows the fraction of active particles, , versus cycle number. The data follow an approximately stretched-exponential form with .
II Model variants studied
We wish to uncover the minimal features of this two-dimensional model that produce the approximate stretched-exponential decay. To this end, we consider a simplification of this model to one dimension, following ref. Corte et al. (2008), where point particles are randomly distributed on a line of length and are swelled cyclically to diameter . After each cycle, particles are displaced by a random amount between and for each collision with another particle. Figure 1b shows that in this one-dimensional model, versus cycle number has a stretched-exponential form ().
The remainder of this paper is devoted to two even simpler variants of this one-dimensional model, which we study in a range of amplitudes where the particles always reach a quiescent state (i.e., Corte et al. (2008)). In both variants, particles interact in one dimension with only their two nearest neighbors. In both cases, the models exhibit approximately stretched-exponential relaxation.
In the “neutral model” (Fig. 1c and section V), the kicks are all of the same magnitude and in opposite directions for the two colliding particles. The kicks are either attractive (bringing the particles closer together) or repulsive (pushing them apart) with equal probability. Thus, the center of mass of the particles is conserved during each collision.
In the “purely-repulsive model” (Fig. 1d and section IV), the collisions again preserve the center of mass but are always repulsive with fixed size . We emphasize that this interaction rule produces fully deterministic dynamics: the initial particle positions exactly specify the evolution of the system.
III Approach
To understand these dynamics, we first consider the structure of the final state. For both models, in the limit of , the final configuration consists of clusters of particles spaced apart by exactly , with larger gaps separating the clusters from one another. Our approach will be to address the relaxation of the particles that will end up in a cluster of final size . At any point in time, we denote the fraction of active particles among this population as . Then we can recover the total relaxation by summing over all these separate populations:
| (2) |
where is the fraction of final clusters having particles when the swelling diameter is .
We will consider both the purely-repulsive case (Fig. 1d) and the repulsive-attractive case (Fig. 1c). We note that the final cluster size distribution, , depends only on the initial positions and not on the dynamics for these two cases, since their collision rules conserve center of mass. This is because any group of overlapping particles will conserve its center of mass as it expands, and when two neighboring groups merge into a larger group, particles then expand about the new center of mass of the combined group.
We begin by deriving this distribution, , since it is the same in both models. We will then determine the relaxation timescale and form of the , which differ in the two models. We can then obtain expressions for by plugging into eqn. 2.
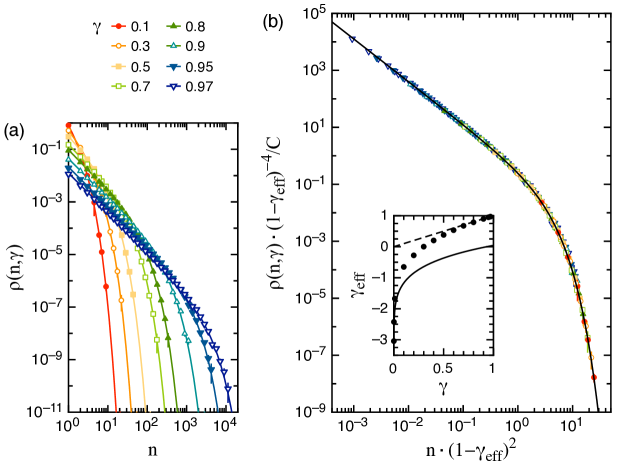
Cluster size distribution.— Figure 2a shows measurements of the distribution of cluster sizes in the limit of small . The data have a power-law form with a cutoff that depends on ; larger clusters are produced for larger .
Here we show how density fluctuations in the initial (random) configuration of particles lead to this final cluster distribution. These density fluctuations create regions of overlapping particles in the initial configuration that have two possible fates: either they expand in isolation if they are sufficiently far away from other particles, or they merge with a neighboring group, which can in turn expand and merge with another group. Thus, small overlapping groups of particles should only be counted as small clusters if they never get incorporated into a larger group. Therefore, to calculate the size of the cluster in which a particle will eventually reside, one must find the largest group of particles to which it could belong. The procedure is then to consider long-wavelength density variations first, and then look on smaller and smaller scales, until a set of particles is identified that will join together by the end of the simulation.
We label the initial positions by from left to right on the interval , choosing the origin so that the leftmost particle of one of the final clusters is at . To form a cluster of at least size , there must be particles within an interval of length in the initial configuration. Thus, we seek the largest for which .
To estimate the , we note that the gaps between neighboring particles, , are random variables drawn from an exponential distribution. Thus, we can model the as steps on a random walk that starts at and ends at .
Approximating the and as being continuous, this problem can be mapped onto to a first-crossing problem with a known solution Beghin and Orsingher (1999). In particular, changing variables to and , we seek the first crossing of the constant boundary by a Brownian bridge with and . This mapping yields the probability distribution of the first crossing occurring at , which corresponds to the particle at the far left of the system belonging to a cluster of size . Since there are particles in that cluster, we scale this result by in order to obtain the distribution of cluster sizes:
| (3) |
where is determined by the normalization condition , for each swelling size .
We note that this mapping to a Brownian bridge is only valid when the cluster size, , can be approximated as a continuous variable. This can be done in the dual limit and . For smaller , the discreteness of introduces an error so that this expression in no longer exact.
We can also solve for in the limit of small by observing that in this case, the motions of the particles during relaxation will be negligible. Thus, can be approximated by the initial distribution of overlapping groups of particles. To derive this distribution, we consider the gaps between points that are randomly placed on a line of length . The probability that the distance between two adjacent points is larger than is given by . Thus, the probability that particles of diameter form a contiguous chain is proportional to , which can be expressed as an exponential in with a decay constant of .
Figure 2 shows that we can describe the entire range of data using eqn. 3, if we treat as a fitting parameter, . We find near , indicating good agreement with the first-passage model. As decreases, the depart from . We can describe the limit of small by matching the decay constant in the exponential in eqn. 3 to as argued above; namely . Thus, we can interpolate between these two limiting cases for intermediate . Figure 2 shows that this fitting form, which is exact in the two limits, gives an excellent description of the data for all relevant .
Connection to slip avalanches.— The distribution of cluster sizes in these one-dimensional swelling models has a parallel to slip avalanches, which occur during the deformation of amorphous materials Denisov et al. (2016). In particular, a simple model of slip avalanches Dahmen et al. (2009, 2011) has a basic mechanism that is shared with the swelling model: small active regions can trigger other regions to become active, thus forming a chain reaction that leads to a single large avalanche. The scaling and cutoff of avalanche size in the mean-field version of the model Dahmen et al. (2009, 2011) match our results for the 1D center-of-mass conserving swelling models. A mapping between the swelling and avalanche models thus provides an alternative derivation of the scaling in eqn. 3. (Note that while the exponents are universal, the prefactors are model specific Dahmen et al. (2009).) Going the other direction, our analysis of cluster sizes that is based on a Brownian bridge (for ) and initial overlaps () could provide fresh insight into slip avalanches.
Generating clusters of a given size.— In the following two sections, we will address the relaxation within a cluster of size , namely, versus time. In order to study these systems numerically, we have developed an algorithm to randomly generate the positions of particles so that their final state is a single isolated cluster of size .
We start by placing particles at random on a line of length with periodic boundary conditions. If these particles are evolved under swelling to size (in the limit ), all the particles will merge into a single cluster that wraps around the entire system, so that there are no edges to the cluster. To avoid this, we swell the particles to size for some . If is too large, the system will break up into multiple clusters. We thus test smaller and smaller , until the end result is a single cluster with a gap between only one pair of particles. Returning to the initial configuration, we “cut” the system between these two particles, so that they are explicitly at the ends of the cluster. Generating many clusters of exactly size in this way, we can study the average properties of .
IV Purely-repulsive model
In this section, we will derive the behavior of versus time in the purely-repulsive model (Fig. 1d), where particles receive only repulsive kicks. We will then use it to predict the behavior of .
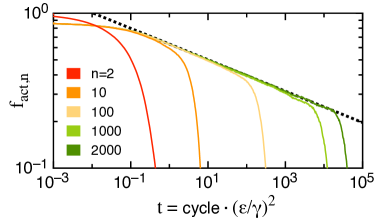
Relaxation within a cluster.— A natural unit of time is given by considering two overlapping particles in isolation, which will take cycles to separate. Hereafter for the purely-repulsive model, we rescale times by and distances by . We find our results are independent of in these units, for .
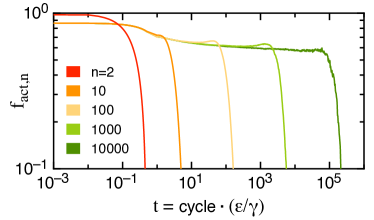
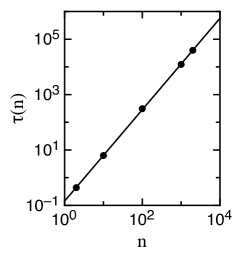
Figure 3 shows , averaged over many clusters. The function approaches a plateau and then falls precipitously to zero at a characteristic time, , which grows with . We plot the characteristic timescale in Fig. 4a. This timescale is found to grow as a power law:
| (4) |
where we measure and .
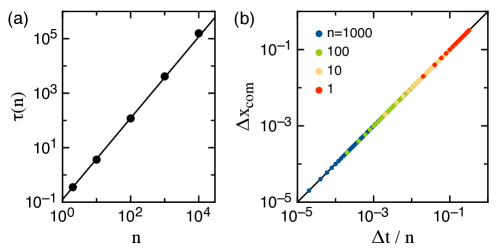
In the remainder of this section, we present an argument that gives . We start by considering an initial condition where all particles are evenly spaced, having the same finite overlap with their nearest neighbors. On the left side of the cluster, relaxation begins with the leftmost particle moving by per cycle. Meanwhile, all the particles in the “bulk” receive canceling kicks and are thus not displaced, but because they are still kicked they are still considered to be active. Once the leftmost particle moves off its neighbor, the two leftmost particles are then mobile, and can gradually move to the left on average. Relaxation proceeds as a “chain” of particles, each with an overlap or gap to the next particle of size , translates to the left. Once this chain moves off the bulk, it increases its size to particles, and decreases the size of the bulk by particle. (Note that although the center of mass of this chain is moving to the left, another chain on the right-hand-side of this group of particles is moving to the right, and the center of mass of the entire overlapping group of particles remains fixed.)
As shown in Fig. 4b, the center of mass of a chain of size moves at a speed . Thus, the stage where the leftmost particles are moving off the bulk will last a duration , where . Summing over all stages, we get a total relaxation timescale:
| (5) |
We now consider the function . The random initial particle positions can be decomposed into Fourier modes that capture the density fluctuations on all length-scales. Specifically, we decompose the displacements of the initial particle positions from their final positions on an interval of width that contains the entire cluster. For convenience, we use a “half-range” cosine series, , which is complete and orthogonal on the interval . Here, the particle index, , runs from to . The lowest Fourier mode () compresses the particles towards the center of the cluster when .
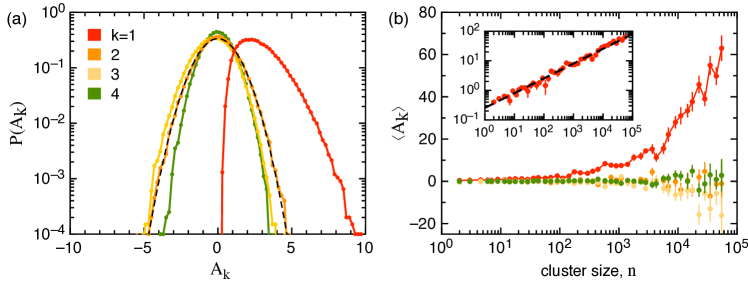
Figure 5a shows the probability distribution of the for the lowest four modes for a cluster of size . Notably, is always positive, whereas the other coefficients are grouped around zero. We can understand this by noting that a negative would correspond to an expanded center of the cluster, which would thus not merge into a single cluster over the course of the relaxation. Higher modes can however be negative, as they decorate this long-wavelength central compression. Thus, the mean of is positive, whereas the mean of higher tend to zero.
Figure 5b shows how this mean, , varies with cluster size, . The inset shows that grows as . This scaling follows from noting that each of the particles can contribute randomly to the mode, giving it fluctuations of order . Yet the resulting cannot be negative, so the rectified fluctuations have a mean of the same size.
The timescale for relaxation of a single cluster will be determined by this lowest mode, not only because its coefficient dominates for large , but also because it represents the longest lengthscale over which particles must be transported. In this mode, all particles have finite overlap with their neighbors, and the overlap is approximately: , where as shown in Fig. 5b. Plugging into eqn. 5 and converting to an integral, we find: , in good agreement with the data in Fig. 4a.
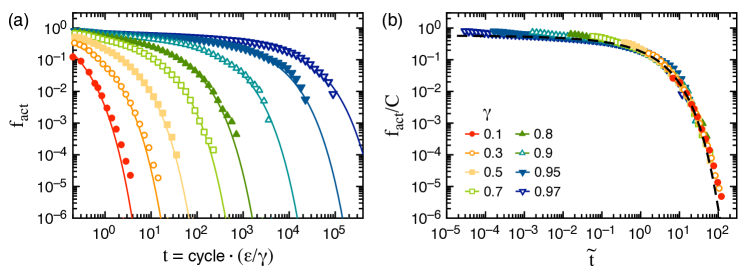
Reconstructing the relaxation dynamics.— Harnessing the results thus far, we can now write down a formula for by using the decomposition in eqn. 2. We use eqn. 3 for , and we find that the data are approximated reasonably well by a step function of height and duration given by eqn. 4. Plugging into eqn. 2 and approximating the sum with an integral, we find the simple form:
| (6) |
where is the complementary error function, and we have introduced a rescaled time:
| (7) |
with and as defined in eqn. 4. The only dependance of eqn. 6 on is through and (the latter via only ).
In Fig. 6, we show relaxation data for a wide range of . The data follow the prediction as a function of time, and they collapse cleanly when plotted in rescaled coordinates, and . The only discrepancy is at early times, where the data peel away slightly from the prediction (visible in Fig. 6b). This is because the are higher for (see Fig. 3). To account for these finer features, one could construct a more detailed approximation to the data. However, our approach is to take the absolute simplest model (i.e., a step function) to highlight how well the full relaxation data can be described with only the basic structure of its components.
V Neutral model
In this section, we will derive the behavior of versus time in the neutral model (Fig. 1c), where particles receive repulsive or attractive kicks with equal probability. We will then use it to predict the behavior of . We will show that the display two distinct timescales, which leads to a wide range of possible stretching exponents as the swelling amplitude, , is varied.
Relaxation within a cluster.— Figure 7 shows for several final cluster sizes, , where in this model we rescale time by , corresponding to the number of cycles for a particle to diffuse by its diameter. The data decay gradually at first and then fall to zero. For but before this drop-off, we find a good fit to a power law:
| (8) |
As in the previous section, we extract a characteristic timescale, , from these curves. Here, to isolate the sharp drop-off from the more gradual relaxation that precedes it, we measure the time when falls below . Figure 8 shows that the data follow a power law (eqn. 4), as in the purely-repulsive case. Here we measure and . (We note that in the repulsive-attractive case, the same decomposition of the initial particle positions into Fourier modes applies. However, estimating a timescale for relaxation within a single Fourier mode is complicated by the fact that particles can be kicked towards each other in this model.)
Reconstructing the relaxation dynamics.— We now reconstruct by plugging these results into the original decomposition, eqn. 2. Because the power-law decay in is the same for all values of , we can simply factor this term out of the sum. The remaining sum can be analyzed in the same manner as in the previous section. Thus, we find to follow eqn. 6 with an additional factor that is given by eqn. 8. In particular,
| (9) |
Notably, depends on both and in this model variant. The existence of two distinct timescales comes from the fact that the initial power-law relaxation of a cluster is independent of its size, , whereas the total lifetime of a cluster depends strongly on .
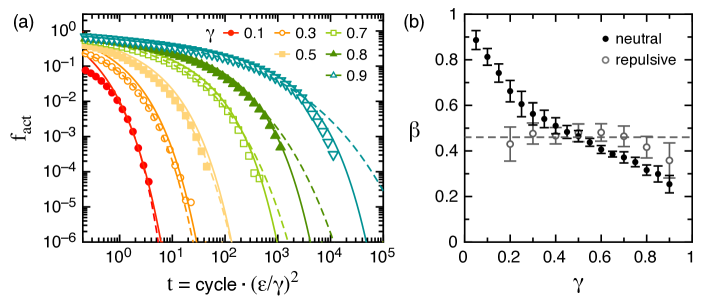
Figure 9a shows our prediction for at several values of , which describe the data well. (Once again, we note that the curves peel off the data at early times – in this case our power-law approximation of overshoots the data for small , especially for small clusters, as shown in Fig. 7.)
We also fit the data at each swelling amplitude to a stretched-exponential. For small and intermediate , these fits describe the data very well. For and , the fits do well at early times, but they are clearly not good at the tails. Yet, even when we have as small as (for ), our functional form, eqn. 9, captures the data remarkably well, spanning more than decades in time.
Figure 9b shows the values of the stretching exponent, , obtained from our fits. We find that varies over a wide range in the neutral model, approaching for small and continuously dropping down to for . In contrast, is not a strong function of in the purely repulsive model. Thus, we see that the crucial difference between the relaxation in the two models stems from the form of the relaxation within an individual cluster – in the neutral case, possesses a power-law decay, whereas in the purely-repulsive model, is approximately constant. In supercooled liquids, the stretching exponent decreases as temperature is lowered Cavagna (2009). Our neutral-interaction particle model exhibits this nontrivial behavior simply by increasing the swelling size, . The extreme stretching is associated with larger clusters of interacting particles that must relax.
VI Conclusion
Our results provide a concrete example of an extremely simple set of dynamics that produces a wide range of stretching exponents. We have shown that randomness in the initial particle positions is sufficient to produce stretched-exponential relaxation, even when the collision rule is completely deterministic. Allowing the collisions to be repulsive or attractive with equal probability, a wide range of stretching exponents could be obtained, depending on the swelling size.
Both one-dimensional model variants studied here are well fit by stretched-exponential relaxation (eqn. 1), but we have derived alternative functional forms for these particular models. Thus, for our purposes eqn. 1 may be viewed as a convenient two-parameter fitting function Menon et al. (1992); Apitz and Johansen (2005).
In both model variants, density fluctuations in the initial state lead to a broad distribution of cluster sizes, which was a key ingredient in understanding the dynamics of the two models. However, the value of the power-law exponent describing the lifetime of a cluster of size (eqn. 4) was not particularly important for obtaining long tails in the relaxation; apparently does not have to be fine tuned to yield approximately stretched-exponential behavior.
More broadly, we have found that this simple model that was introduced for a non-Brownian suspension looks to be a good model for glassy dynamics. Indeed, several signatures of glassy behaviors have recently been reported in a two-dimensional version of the model Tjhung and Berthier (2015, 2016). Here we have shown that both two-dimensional and one-dimensional versions of the model exhibit glassy relaxations. We expect this is because the model captures fluctuations in density, which would clearly be there in a glass. Future work could study relaxation in similar models of sheared amorphous solids where the density is much larger Regev et al. (2013); Fiocco et al. (2014). In the simple model variants we studied, particles interact because of randomness, and they must get out of each other’s way to relax. This disorder is what gives rise to the slow relaxation. This remarkably simple set of rules is just sufficient to generate this nontrivial behavior, and is therefore a promising avenue for studying glassy systems.
Acknowledgements.
We are grateful to Leo Kadanoff, our teacher, mentor, and friend, for many years of scientific discussions. He had the ability to understand complex interacting systems by isolating the common simple ingredients. This has been an inspiration to all of us in the soft-matter physics community. We thank Thomas A. Caswell for assistance optimizing the simulations, and Karin Dahmen and Daniel Hexner for stimulating conversations. This work was supported by NSF Grant DMR-1404841 and by NSF MRSEC DMR-1420709. J.D.P. acknowledges the Donors of the American Chemical Society Petroleum Research Fund for partial support of this research. Use of computation facilities funded by the US Department of Energy, Office of Basic Energy Sciences, Division of Materials Sciences and Engineering, Award No. DE-FG02-03ER46088 is gratefully acknowledged.References
- Williams and Watts (1970) G. Williams and D. C. Watts, “Non-symmetrical dielectric relaxation behaviour arising from a simple empirical decay function,” Transactions of the Faraday society, 66, 80–85 (1970).
- Legrand et al. (1987) D. Legrand, W. Olszewski, and J. Bendler, “Anelastic response of bisphenol-a polycarbonate,” Journal of Polymer Science Part B: Polymer Physics, 25, 1149–1152 (1987).
- Ediger et al. (1996) M. D. Ediger, C. Angell, and S. R. Nagel, “Supercooled liquids and glasses,” The journal of physical chemistry, 100, 13200–13212 (1996).
- Chamberlin et al. (1984) R. V. Chamberlin, G. Mozurkewich, and R. Orbach, “Time decay of the remanent magnetization in spin-glasses,” Physical review letters, 52, 867 (1984).
- Coey et al. (1987) J. M. D. Coey, D. Ryan, and R. Buder, “Kohlrausch thermal relaxation in a random magnet,” Physical review letters, 58, 385 (1987).
- Kriza and Mihaly (1986) G. Kriza and G. Mihaly, “Stretched-exponential dielectric relaxation in a charge-density-wave system,” Physical review letters, 56, 2529 (1986).
- Mihály et al. (1991) G. Mihály, Y. Kim, and G. Grüner, “Dielectric relaxation of the pinned spin-density wave in (TMTSF)2 PF6,” Physical review letters, 66, 2806 (1991).
- Kakalios et al. (1987) J. Kakalios, R. Street, and W. Jackson, “Stretched-exponential relaxation arising from dispersive diffusion of hydrogen in amorphous silicon,” Physical review letters, 59, 1037 (1987).
- Kramer and Lobkovsky (1996) E. M. Kramer and A. E. Lobkovsky, “Universal power law in the noise from a crumpled elastic sheet,” Physical Review E, 53, 1465 (1996).
- Grassberger and Procaccia (1982) P. Grassberger and I. Procaccia, “The long time properties of diffusion in a medium with static traps,” The Journal of Chemical Physics, 77, 6281–6284 (1982).
- Klafter and Shlesinger (1986) J. Klafter and M. F. Shlesinger, “On the relationship among three theories of relaxation in disordered systems,” Proceedings of the National Academy of Sciences, 83, 848–851 (1986).
- Palmer et al. (1984) R. G. Palmer, D. L. Stein, E. Abrahams, and P. W. Anderson, “Models of hierarchically constrained dynamics for glassy relaxation,” Physical Review Letters, 53, 958 (1984).
- Scher et al. (1991) H. Scher, M. F. Shlesinger, and J. T. Bendler, “Time-scale invariance in transport and relaxation,” Physics Today, 44, 26–34 (1991).
- Phillips (1996) J. Phillips, “Stretched exponential relaxation in molecular and electronic glasses,” Reports on Progress in Physics, 59, 1133 (1996).
- Jund et al. (2001) P. Jund, R. Jullien, and I. Campbell, “Random walks on fractals and stretched exponential relaxation,” Physical Review E, 63, 036131 (2001).
- Sturman et al. (2003) B. Sturman, E. Podivilov, and M. Gorkunov, “Origin of stretched exponential relaxation for hopping-transport models,” Physical review letters, 91, 176602 (2003).
- Lemke and Campbell (2011) N. Lemke and I. A. Campbell, “Stretched-exponential behavior and random walks on diluted hypercubic lattices,” Physical Review E, 84, 041126 (2011).
- Knight et al. (1995) J. B. Knight, C. G. Fandrich, C. N. Lau, H. M. Jaeger, and S. R. Nagel, “Density relaxation in a vibrated granular material,” Physical review E, 51, 3957 (1995).
- Ono et al. (2003) I. K. Ono, S. Tewari, S. A. Langer, and A. J. Liu, “Velocity fluctuations in a steadily sheared model foam,” Physical Review E, 67, 061503 (2003).
- Mattsson et al. (2009) J. Mattsson, H. M. Wyss, A. Fernandez-Nieves, K. Miyazaki, Z. Hu, D. R. Reichman, and D. A. Weitz, “Soft colloids make strong glasses,” Nature, 462, 83–86 (2009).
- Zou (2010) L.-N. Zou, “Spectral responses in granular compaction,” Physical Review E, 81, 031302 (2010).
- Corte et al. (2008) L. Corte, P. Chaikin, J. P. Gollub, and D. Pine, “Random organization in periodically driven systems,” Nature Physics, 4, 420–424 (2008).
- Menon and Ramaswamy (2009) G. I. Menon and S. Ramaswamy, “Universality class of the reversible-irreversible transition in sheared suspensions,” Physical Review E, 79, 061108 (2009).
- Xu and Schwarz (2013) S.-L.-Y. Xu and J. Schwarz, “Contact processes in crowded environments,” Physical Review E, 88, 052130 (2013).
- Tjhung and Berthier (2015) E. Tjhung and L. Berthier, “Hyperuniform density fluctuations and diverging dynamic correlations in periodically driven colloidal suspensions,” Physical review letters, 114, 148301 (2015).
- Tjhung and Berthier (2016) E. Tjhung and L. Berthier, “Criticality and correlated dynamics at the irreversibility transition in periodically driven colloidal suspensions,” Journal of Statistical Mechanics: Theory and Experiment, 2016, 033501 (2016).
- Hexner and Levine (2015) D. Hexner and D. Levine, “Hyperuniformity of critical absorbing states,” Physical review letters, 114, 110602 (2015).
- Weijs et al. (2015) J. H. Weijs, R. Jeanneret, R. Dreyfus, and D. Bartolo, “Emergent hyperuniformity in periodically driven emulsions,” Physical review letters, 115, 108301 (2015).
- Keim and Nagel (2011) N. C. Keim and S. R. Nagel, “Generic transient memory formation in disordered systems with noise,” Physical review letters, 107, 010603 (2011).
- Keim et al. (2013) N. C. Keim, J. D. Paulsen, and S. R. Nagel, “Multiple transient memories in sheared suspensions: Robustness, structure, and routes to plasticity,” Physical Review E, 88, 032306 (2013).
- Paulsen et al. (2014) J. D. Paulsen, N. C. Keim, and S. R. Nagel, “Multiple transient memories in experiments on sheared non-brownian suspensions,” Physical review letters, 113, 068301 (2014).
- Coppersmith et al. (1997) S. Coppersmith, T. Jones, L. Kadanoff, A. Levine, J. McCarten, S. Nagel, S. C. Venkataramani, and X. Wu, “Self-organized short-term memories,” Physical review letters, 78, 3983 (1997).
- Povinelli et al. (1999) M. Povinelli, S. Coppersmith, L. Kadanoff, S. Nagel, and S. C. Venkataramani, “Noise stabilization of self-organized memories,” Physical Review E, 59, 4970 (1999).
- Beghin and Orsingher (1999) L. Beghin and E. Orsingher, “On the maximum of the generalized brownian bridge,” Lithuanian Mathematical Journal, 39, 157–167 (1999).
- Denisov et al. (2016) D. Denisov, K. Lörincz, J. Uhl, K. Dahmen, and P. Schall, “Universality of slip avalanches in flowing granular matter,” Nature communications, 7 (2016).
- Dahmen et al. (2009) K. A. Dahmen, Y. Ben-Zion, and J. T. Uhl, “Micromechanical model for deformation in solids with universal predictions for stress-strain curves and slip avalanches,” Physical review letters, 102, 175501 (2009).
- Dahmen et al. (2011) K. A. Dahmen, Y. Ben-Zion, and J. T. Uhl, “A simple analytic theory for the statistics of avalanches in sheared granular materials,” Nature Physics, 7, 554–557 (2011).
- Cavagna (2009) A. Cavagna, “Supercooled liquids for pedestrians,” Physics Reports, 476, 51–124 (2009).
- Schrenk and Frenkel (2015) K. J. Schrenk and D. Frenkel, “Communication: Evidence for non-ergodicity in quiescent states of periodically sheared suspensions,” The Journal of chemical physics, 143, 241103 (2015).
- Menon et al. (1992) N. Menon, K. P. O’Brien, P. K. Dixon, L. Wu, S. R. Nagel, B. D. Williams, and J. P. Carini, “Wide-frequency dielectric susceptibility measurements in glycerol,” Journal of non-crystalline solids, 141, 61–65 (1992).
- Apitz and Johansen (2005) D. Apitz and P. Johansen, “Limitations of the stretched exponential function for describing dynamics in disordered solid materials,” Journal of applied physics, 97, 063507 (2005).
- Regev et al. (2013) I. Regev, T. Lookman, and C. Reichhardt, “Onset of irreversibility and chaos in amorphous solids under periodic shear,” Physical Review E, 88, 062401 (2013).
- Fiocco et al. (2014) D. Fiocco, G. Foffi, and S. Sastry, “Encoding of memory in sheared amorphous solids,” Physical review letters, 112, 025702 (2014).