∎
22email: gleirsch,irlbeck@in.tum.de 33institutetext: S. Wagner 44institutetext: Institute of Software Technology, University of Stuttgart, Germany
44email: Stefan.Wagner@informatik.uni-stuttgart.de 55institutetext: D. Golubitskiy 66institutetext: Roland Berger Strategy Consultants GmbH, München, Germany
66email: Dmitriy.Golubitskiy@rolandberger.com
Introduction of Static Quality Analysis in Small and Medium-Sized Software Enterprises: Experiences from Technology Transfer
Abstract
Today, small and medium-sized enterprises (SMEs) in the software industry face major challenges. Their resource constraints require high efficiency in development. Furthermore, quality assurance (QA) measures need to be taken to mitigate the risk of additional, expensive effort for bug fixes or compensations. Automated static analysis (ASA) can reduce this risk because it promises low application effort. SMEs seem to take little advantage of this opportunity. Instead, they still mainly rely on the dynamic analysis approach of software testing.
In this article, we report on our experiences from a technology transfer project. Our aim was to evaluate the results static analysis can provide for SMEs as well as the problems that occur when introducing and using static analysis in SMEs. We analysed five software projects from five collaborating SMEs using three different ASA techniques: code clone detection, bug pattern detection and architecture conformance analysis. Following the analysis, we applied a quality model to aggregate and evaluate the results.
Our study shows that the effort required to introduce ASA techniques in SMEs is small (mostly below one person-hour each). Furthermore, we encountered only few technical problems. By means of the analyses, we could detect multiple defects in production code. The participating companies perceived the analysis results to be a helpful addition to their current QA and will include the analyses in their QA process. With the help of the Quamoco quality model, we could efficiently aggregate and rate static analysis results. However, we also encountered a partial mismatch with the opinions of the SMEs. We conclude, that ASA and quality models can be a valuable and affordable addition to the QA process of SMEs.
Keywords:
software quality small and medium-sized software enterprises static analysis code clone detection bug pattern detection architecture conformance analysis quality modelsThe final publication is available at http://link.springer.com.
1 Introduction
Small and medium-sized enterprises (SMEs) play an important role in the global software industry. In many countries, such as the US, Brazil or China, these companies represent up to 85% of all software organisations (Richardson and Von Wangenheim, 2007) and carry out the majority of software development (Mishra and Mishra, 2006). Compared to large corporations, SMEs are faced with special conditions such as limited resources, lack of expertise or financial insecurity.
Problem statement.
While there are many articles focusing on process improvement in SMEs (Kautz, 1999; Mishra and Mishra, 2006; von Wangenheim et al, 2006), we found no study that considers specific quality assurance (QA) techniques or quality models and their application in this context. However, QA constitutes an important and resource intensive activity. Automated static analysis (ASA) techniques and associated quality models seem to be suitable for SMEs. These companies usually do not have dedicated quality assurance departments and, therefore, could benefit from highly automated, pre-packaged techniques. The benefits of such techniques lie in their low-cost application (Baca et al, 2008) and their potential to detect critical quality defects (Zheng et al, 2006; Ayewah et al, 2007). Such defects are risky for further development and increase costs as they might for example entail effort for bug fixes. Detecting these defects at a low cost approach is a promising way for small software enterprises to implement efficient quality assurance.
Research Objective.
Our overall objective is to improve the quality assurance processes at SMEs in a way that suits their specific context. In this article, we focus on the question whether SMEs can benefit from the quality assurance paradigm static analysis and associated quality models. Is it possible to introduce ASA techniques into their existing projects with low effort? What kind of defects can be found using these techniques? Is the perceived usefulness for the enterprises strong enough to justify the needed effort? Finally, can we employ quality models to help in the interpretation of the analyses for an explicit understanding of quality? Answering these questions will support decision makers in SMEs in planning quality assurance improvements in the future.
Contribution.
We report on our experience in analysing five projects of five SMEs using three different ASA techniques: code clone detection, bug pattern detection and architecture conformance analysis. We evaluate the effort that is needed to introduce these techniques, the pitfalls we came across and how the participating enterprises evaluated the presented techniques as well as the defects we discovered in their software projects. Furthermore, we illustrate our experience in enhancing the static analyses by applying the Quamoco quality model, explain where it confirmed our results and compare its results to the opinions of our study participants.
Results.
Our study reveals that the effort needed to introduce and apply static analysis techniques is low and affordable for SMEs. Using these techniques, we found critical defects even in production code. After the presentation of the results, all participating SMEs plan to apply the presented techniques in the future. Our study showed that a quality model provides help to interpret the vast amount of findings gained from static analyses. Nevertheless we suggest to pay attention to extreme measures apart from the quality model results. Our study shows that there is a mismatch between the ratings provided by the quality model and the opinion of the study participants concerning many quality characteristics.
Outline.
In Section 2, we describe the research context of our work, present our guiding research questions, give a short overview of the applied techniques and models and explain the procedure we chose. Section 3 displays the results of our work which we discuss in detail in Section 4. The possible threats to validity of our work are illustrated in Section 5. Relations of the presented work to other approaches are presented in Section 6. We conclude our report in Section 7 and share our perspective on future research.
2 Approach
We describe our experiences of transferring ASA technology to SMEs and its use in quality models. This section illustrates the research context, i.e. the participating enterprises, our guiding research questions, the examined techniques and models, the study objects we employed to gather our experiences and, finally, the procedure we used to answer our research questions.
2.1 Research Context
The basis of our research was the collaboration with five SMEs, all resident in the Munich area and selected through personal contacts and a series of information events and workshops. Details regarding the selection process can be found in Section 2.6. Following the definition of the European Commission (2003), one of the participating enterprises is micro-, two are small- and two are medium-sized considering their number of staff and annual turnover. The presented research is based on the experience with these enterprises gathered in a project from March 2010 to April 2011.
2.2 Study Subjects and Objects
Study Subjects (SS).
For our investigation, we collaborate with five SMEs (“study subjects”). These companies cover various business and technology domains, e.g. corporate and local government controlling, form letter processing as well as diagnosis and maintenance of embedded systems. Four of them are involved in commercial software development, one in software quality assurance and consulting. The latter could not provide a software system of their own development.
For each company, we involve one study participant (SP) who assumes three roles: (1) our SME contact and representative, (2) a stakeholder, executive manager, project leader, supervisor or developer responsible for or deeply interested in a study object and, finally, (3) an industrial partner supportively participating in our research project. Throughout our study, the SPs are assumed to be partially accompanied by other assistants or SME staff.
Study Objects (SO).
Our study objects consist of five software systems briefly described in Table 1. These systems contain between 100 and 600 kLoC. The SOs 1, 2, 4 and 5 have been developed in software projects by the corresponding SPs. One study participant, however, did not offer a software system of his own. Following his suggestion, we chose the humanitarian open-source application OpenMRS111http://www.openmrs.org to be SO 3. This system is a development of the multi-institution, non-profit collaborative OpenMRS. For this SP, we additionally consulted the OpenMRS core developers for technical questions.
The development of all systems started seven years at the earliest before we conducted our study in 2010. The SO project teams comprise less than ten persons. Except for OpenMRS, the teams are located in the Munich area. The development of SO 1 and 2 had already been finished the start of our study.
| SO | Platform | Sources | Size [kLoC] | Business Domain |
|---|---|---|---|---|
| 1 | C#.NET | closed, commercial | Corporate controlling | |
| 2 | C#.NET | closed, commercial | Embedded device maintenance | |
| 3 | Java | open, non-profit | Health information management | |
| 4 | Java | closed, commercial | Local government controlling | |
| 5 | Java | closed, commercial | Document processing |
2.3 Research Questions
Our overall research objective is to evaluate the transfer of innovative quality assurance measures to SMEs. We structure this objective into three major research questions. The first two analyse the benefit of static analysis techniques, the third one explores the use of quality models:
RQ 1
Which problems occur while introducing and applying static analysis techniques at SMEs?
SMEs show special characteristics, such as generalist employees instead of specialists for quality assurance. Hence, it needs to be simple and straightforward to introduce and apply static analysis to be useful for SMEs. We further break this down into two sub-questions and indicate our expectations:
RQ 1.1 Which technical problems occur?
Static analysis is tightly coupled to tools that perform and report the analysis. Hence, the ease of introducing and applying static analysis also depends on how many and which technical problems the software engineers need to solve.
RQ 1.2 How much effort is necessary?
If the effort to set up the analyses is too large, SME will rule out their application as they cannot afford to allocate additional capacities on QA. Therefore, we analyse the effort spent on the introduction and application.
Expectations for RQ 1: From our experience, we expect several technical problems with the configuration of the tools as well as the preparation of the code bases of the SMEs as the analyses require source code as well as executables. The introduction effort should not take more than a few person-days per analysed project.
RQ 2
How useful are automated static analysis techniques for SMEs?
Beyond the question of how easy or problematic it is to introduce and apply static analyses in SMEs, we are interested whether the techniques can produce useful results for the developers and quality engineers. Even a small effort should not be spent if there is no return on investment. Again, we break this question down into two sub-questions and define our expectations:
RQ 2.1 Which defects can be found?
We investigate usefulness by analysing the types and numbers of defects found by using the static analysis tools at the SMEs. If critical defects can be found, the application of the techniques is considered useful. We neither focus on specification defects and whether they can be found at all, nor do we perform cause-and-effects analyses for defects except for some criticality assessments.
RQ 2.2 How do the companies perceive the usefulness?
Motivated by metrics discussed in Davis (1989), we add the subjective perception of our study participants. How do they interpret the results of the static analysis tools? Do they believe they can work with those tools and are they going to apply them in their future projects? This way, we augment the information we gained from defect analysis.
Expectations for RQ 2: We expect automated static analysis to be useful for SMEs because of the low effort required for set-up and execution. Most problems found will probably be related to maintainability, but we also expect to uncover some critical defects. Overall, we presume that the companies will have a positive impression of the techniques.
RQ 3
To what degree do the results of ASA, study participants and quality models match?
Findings generated by ASA techniques have to be interpreted in the context of overall software quality. This perspective shows to SMEs whether their software products fulfil overall quality requirements and were these products can be improved. It is unclear whether quality models help SMEs to estimate their projects’ quality, reveal general deficiencies apart from singular findings and if their application is worth the effort. We will describe two sub-questions together with our expectations:
RQ 3.1 Are individual ASA results well reflected in the quality model results?
Static analyses can be used to estimate the quality of a certain software product. High clone rates or a considerable number of bug pattern findings indicate poor software quality. Nevertheless, too many findings can be confusing. We want to know whether the outcomes of the applied ASA techniques are similar to the results of the Quamoco quality model and if the quality model provides further insights at less complexity.
RQ 3.2 Do the results of the quality model match the opinions of the study participants?
Quality models allow quality engineers to transform findings into ratings of different quality characteristics. Nevertheless, each company develops a self-perception of their product concerning these characteristics, which is normally based on an intuitive understanding of these attributes. We want to find out whether a quality model confirms the self-estimation of SMEs and whether it offers different or additional insights.
Expectations for RQ 3: We suppose that the quality model is calibrated well enough for the individual results of ASA to be visible in the assessment results of the model. As suggested by previous studies (Wagner et al, 2013), we assume that there will be a good match between the study participants’ opinions and the assessment results.
2.4 Static Analysis Techniques
Static analysis refers to the analysis of computer programs without their execution. It includes manual techniques, such as reviews and inspections, as well as automated techniques. We use the term static quality analysis to emphasise the understanding of static analysis results from the perspective of software quality attributes. Manual analyses are time-consuming and prone to missing problems in the huge amount of code to be analysed. Automation has high potential to detect simple and reoccurring problems in source code. A detection of the correct usage of “==” instead of “equals” to compare strings in Java, should not be the task of human reviewers. They should concentrate on the more subtle and domain-related problems.
From the interviews with our study participants and the experiences at our research groups, we chose three important types of techniques and specialised tools which we introduce in detail below. Technically, we employ the open-source tool ConQAT222http://www.conqat.org for code clone detection and architecture conformance analysis as well as for results processing of bug pattern detection.
Code Clone Detection.
Modern programming languages, particularly object-oriented ones, offer various abstraction mechanisms to facilitate reuse of code fragments but copy-paste is still a widely employed reuse strategy. This often leads to numerous duplicated code fragments – so-called clones – in software systems. As stated in the surveys of Koschke (2007) and Roy and Cordy (2007), cloning is problematic for software quality for several reasons:
-
•
Cloning unnecessarily increases program size and thus efforts for size-related activities like inspections and testing.
-
•
Changes, including bug fixes, to one clone instance often need to be made to the other instances as well, again increasing efforts.
-
•
Changes performed inconsistently to duplicated source code fragments can introduce bugs.
Code clone detection is an automated static analysis technique that detects duplicated code fragments. One of the most important metrics offered by this technique is unit coverage which is the probability that an arbitrarily chosen unit of the source code is part of a clone. A unit represents an uncommented and normalised source code statement which originally may have spanned several text lines. Another metric called blow-up denotes the ratio of the unit count of the current software by the unit count of a hypothetical software without clones (Juergens and Göde, 2010). Moreover, two terms are important for clone detection: A clone class defines a set of similar code fragments and a clone instance is a representative of a clone class (Juergens et al, 2009b).
We differentiate between conventional clone detection and gapped clone detection. During conventional clone detection, clones are considered to be syntactically similar copies; only variable, type or function identifiers can be changed (Koschke, 2007). In contrast, gapped clone detection reveals clones with further modifications; statements can be changed, added or removed (Koschke, 2007). While clones are an indicator of bad design, the difference between the two approaches is that only the results of gapped clone detection can reveal defects that lead to failures, which arise by unconscious, inconsistent changes in instances of a clone class. We use both approaches in our study to investigate both aspects of clone detection.
Clone detection is supported by a number of freely available and commercial tools. The most popular of them are CCFinder333http://www.ccfinder.net, ConQAT, CloneDR444http://www.semanticdesigns.com/Products/Clone, and Axivion Bauhaus Suite555http://www.axivion.com. The former two are free, while the latter two are commercial. We employ ConQAT in our investigation because our research group has experience with its usage.
Bug Pattern Detection.
By this term we refer to a technique for the automated detection of a variety of defects. Bug patterns have been thoroughly investigated, e.g. by Zheng et al (2006), and compared with other frequently used software quality assurance techniques such as code reviews or testing (Wagner et al, 2005). Bug patterns represent a scalable approach to efficiently reveal defects or possible causes thereof. According to Wagner et al (2008), this technique can already be cost-efficient by detecting three defects that would not have appeared otherwise until system use. Their rules aim at structural patterns recognisable from source code, executables and meta-data such as source code comments and debug symbols to gain as much knowledge as possible from a static perspective. This knowledge encompasses obvious bugs, rather complex heuristics for latent defects, e.g. code clones, and less critical issues of coding style. For example, uncallable method defined in anonymous class or never called are among the frequently activated rules for Java. These are triggered whenever the applicable code fulfils these conditions.
Because of the large variety of defects, as classified by Beizer (1990), there is no complete classification schema for bug patterns yet. A reason for this might be that generally applicable defect classifications are rare, vague or difficult to use in practice (Wagner, 2008). The tools we apply classify their rules according to the consequences of findings such as security vulnerability, performance loss or functional incorrectness. By the term finding we denote that a rule was triggered at a specific location. Findings themselves are often categorised by their severity and their confidence levels.
Many of the rules are realised by means of individual lexers and parsers, by using compiler infrastructures or by more reusable means such as pattern or rule languages and machine learning. Rules for latent defects and coding style often stem from abstract source code metrics as discussed, e.g., by Ferzund et al (2008). Among the wide variety of tools666http://en.wikipedia.org/wiki/List_of_tools_for_static_code_analysis available for bug pattern detection, are splint777http://splint.org for C, cppcheck888http://cppcheck.sourceforge.net for C++, FindBugs999http://findbugs.sourceforge.net (Ayewah et al, 2008) for Java, FxCop101010http://msdn.microsoft.com/en-us/library/bb429476\%28v=vs.80\%29.aspx for C# or Coverity Static Analysis for all of these languages (Bessey et al, 2010). In our study, we use the free tools FxCop and Gendarme for C# and PMD and FindBugs for Java.
Architecture Conformance.
Architectural erosion denotes the problem that structural knowledge of a system often is lost over its lifetime (Feilkas et al, 2009; Fiutem and Antoniol, 1998; Rosik et al, 2008). The documented and the implemented architectures are drifting apart. This effect leads to a decrease in system maintainability. To counteract this, different approaches are in use to compare the conformance of a system’s implementation with its intended architecture.
Passos et al (2010) identify three static concepts existing for architecture conformance analysis: Reflexion Models (RM), Source Code Query Languages (SCQL) and Dependency Structure Matrices (DSM).
Reflexion Models (Koschke and Simon, 2003) compare two models of a system and assess their conformance. The first model usually represents the intended architecture, the second one the implementation of the system (Knodel and Popescu, 2007). The intended architecture consists of components and allowed relationships between components, expressed as rules. Each component itself can contain sub-components. The system’s source code is mapped to these components and then analysed for conformance to the given rules. This technique is used by the commercial tools SonarJ111111http://www.hello2morrow.com/products/sonarj and Structure101121212http://www.headwaysoftware.com as well as the open-source tools ConQAT and dependometer131313http://source.valtech.com/display/dpm/Dependometer.
There are tools using SCQL like Semmle.QL (de Moor et al, 2007) or DSM like Lattix (Sangal et al, 2005) not further explained here. Both of these concepts rely strongly on the realisation of the system and cannot provide an architecture specification that is independent of the system’s implementation (Deissenboeck et al, 2010b).
Apart from this technical perspective, the quality of an architecture specification is a crucial factor for the success of architecture conformance. Imprecise, inconsistent, invalid, outdated, coarse-granular or incomplete specifications also decrease the quality of findings produced by architecture conformance analysis and hinder the effective creation of reflexion models. Moreover, the strong connection of architecture and system rationales and quality makes it risky to perform architecture conformance analysis on the basis of a defective architecture specification.
In summary, architecture conformance analysis techniques highlight the often neglected topic of architecture and offer a way to automatically analyse its impact on the code. The technique is fragile in case of defective architecture specifications but offers possibilities to actively discuss the influence of architectural decisions on the system implementation. We apply ConQAT for architecture conformance analysis. A detailed description of its architecture conformance feature can be found in the work of Deissenboeck et al (2010b).
2.5 Quality Models and Quality Assessment Models
Besides static analysis tools, we evaluate the benefit of quality models. Following ISO/IEC 25010 (2011), quality models “categorise product quality into characteristics.” Hence, they mainly define what software quality consists of. In a broader sense, as discussed by Deissenboeck et al (2009), quality models are able to assess or even predict the quality of a software system. Hence, quality models exist, among others, as simple taxonomies, guidelines, checklists, metrics or stochastic models. The aim of quality models is to make the abstract concept of software quality more tangible. This can result in taxonomies used as checklists for quality requirements, metrics used for an overall quality assessment or analyses for detecting critical parts of a software system.
The work on software quality models began in the 1970s with early taxonomies from Boehm et al (1978) and McCall et al (1977). They broke quality down into what is colloquially called “-ilities” such as reliability or maintainability. This influenced the standard ISO/IEC 9126 (2003) and its successor ISO/IEC 25010 (2011). These taxonomies have shown to be too abstract to be used by developers in their daily work (Wagner et al, 2009). The metrics proposed have proven to be difficult and the quality attributes are hard to be refined further (Kitchenham and Pfleeger, 1996; Al-Kilidar et al, 2005). Therefore, the standards are not yet widely used (Wagner et al, 2012b). Other researchers proposed more structured quality models. For example, Dromey (1995) used a generic quality model split into quality attributes, components and component properties as well as their interrelations. This way, he could express the impacts of specific properties on the quality attributes more precisely.
The German research project Quamoco141414http://www.quamoco.de/ used the preliminary work of its project partners (Deissenboeck et al, 2007; Plösch et al, 2009) to develop a detailed and explicit meta-model for quality models and build a broad, completely operationalised quality model called base model (Wagner et al, 2012a). On the top level, the Quamoco quality models use quality characteristics well-known from ISO/IEC 25010 (2011), on the bottom level, they apply concrete measures. In the base model, these are static measures collected either automatically by ASA tools or manually by reviews. The base model is split into several modules, a root module and several technology-specific ones. Between quality characteristics and low level measures, Wagner et al (2012a) introduced the concept of a product factor which is similar to the component properties of Dromey (1995). Product factors bridge the gap between the different abstractions by being more directly measurable as well improving the traceability of the impact on the quality characteristics.
Furthermore, Wagner et al (2012a) describe a quality assessment method based on the aforementioned quality model. It uses the collected data for the measures together with aggregation rules, so-called evaluation specifications, for the product factors. Such specifications define how the measures associated to product entities translate into the degree of presence of product factors. They are also calibrated using a large number of open-source systems (Lochmann, 2012). There are similar specifications that describe (using weights) how the various product factors impact the quality characteristics. The overall assessment result is then a value between 1 and 6 according to German school grades (1 is the best, 6 the worst). In empirical validations (Wagner et al, 2012a), such results have shown to be significantly correlated to expert opinions. The base model and tooling are available as open source, the base model is also accessible in a Web version.151515http://www.in.tum.de/webportal/explorer.html
We introduced an example bug patterns above: the rule uncallable method defined in anonymous class of FindBugs. It can measure the product factor Uselessness of a Method which is part of the module on object orientation. Each product factor has a short description:
A method is useless if it is never referenced but nevertheless explicitly defined. Note: This factor regards completely unnecessary code which could be deleted without any effect, whereas the “unnecessarily complicated” factor regards code that is too complicated due to an apparent programming mistake.
This is a factor that influences several quality characteristics of a software system negatively. The quality model contains impacts to Resource Utilisation, Analysability and Functional Correctness. These, in turn, influence higher-level characteristics. For example, Resource Utilisation influences Performance Efficiency which influences Quality. For evaluating the product factor and its influenced quality characteristics, we need to measure the degree to which the product factor is present in a product. To do so, we have assigned measures to the product factor. In our example, these are Uncallable method defined in anonymous class and Never called for Java. Both can be collected automatically by the tool FindBugs. We collect the number of findings in relation to the size of the product (e.g. measured in LoC) and assign an evaluation result to the product factor using an evaluation specification. Hence, many findings would lead to a large degree of uselessness of methods which, in turn, could lead to a bad grade such as a 5. This way, the measurements and evaluations at large constitute an overall grade of product quality.
To make building Quamoco quality models and using them in the assessment of software systems feasible, the project developed extensive tool support. There is a complete tool chain containing the Quamoco quality model editor for building the model and the assessment toolkit ConQAT for measuring and calculating the assessment results (Deissenboeck et al, 2011). We used the Quamoco base model together with the Quamoco tool chain in our study.
2.6 Procedure
This section explains the planned milestones of our investigation (Steps 1–4). It explains the start of our research (Step 1) and addresses our research questions, i.e. which data have to be collected and how to achieve that (Step 2) as well as how and under which conditions our analyses have to be carried out (Steps 3–4). Steps 2 and 3 take place during a single, collaborative two-week sprint per participating enterprise with at least one sprint meeting at the beginning, the middle and the end of the sprint. During a sprint, the respective study participant has to provide support for technical questions, such as check-out of the source code or configuration of the build process and has to attend the sprint meetings.
2.6.1 Step 1: Workshops and Interviews
First, we conduct a series of workshops and interviews to motivate industrial partners to participate in our project and then to understand their context and their needs. We start with an information event where we explain the general theme of transferring QA techniques and propose first directions. With all study participants (i.e. the companies that agree to join the project), we conduct a kick-off meeting and a workshop to create a common understanding, discuss organisational issues and plan the complete schedule. In addition, the SPs present the corresponding study objects and their needs concerning software quality. To intensify our knowledge of these systems and problems, for each participant, we perform a semi-structured interview with two interviewers and a varying number of interviewees (i.e. SP including optional staff). Both interviewers take notes and consolidate them. We then compare all interview results to find commonalities and differences. After that, we hold one or two consolidation workshops to discuss our results and plan the further investigations.
2.6.2 Step 2: Raw Data Collection
The source code of at least three versions of the study objects, e.g. major releases chosen by the companies, is retrieved for the application of the chosen techniques for RQ 1 to analyse effects over time. For bug pattern detection and architecture conformance analyses, we retrieve or build executables packed with debug symbols for each of these configurations. For architecture conformance, we also need an appropriate architecture specification. Accordingly, all study participants have to provide project artefacts as far as available, i.e. source code, build environment and/or debug builds, as well as documentation of source code, architectural specification and project management information. Since the project budget is limited, we cannot afford the additional effort of creating these project-specific artefacts if unavailable.
2.6.3 Step 3: Measurement and Analysis
We apply each technique to the gathered raw data via corresponding tool runs and inspect the results, i.e. findings and statistics. To get comparable results, we follow a generic procedure for each analysis technique which is presented here. A detailed description of the respective process for each technique can be found in the following paragraphs.
-
I.
Introduction (once per study object):
Individual steps for preparation such as completion of technical and conceptual prerequisites, installation and configuration of tools, setup of aggregation mechanisms, filters and visualisations to obtain tangible results. -
II.
Application (once per SO version or analysis run):
-
1.
Readjustment (optional): Readjustment of the tools according to version specific characteristics (e.g. new path, excluded code, filtering of false positives or reconfiguration of the tools).
-
2.
Run analysis: Run of the ASA tool or Quamoco tool chain, generation of results.
-
3.
Inspection: Inspection, filtering and discussion of findings, identification of false positives.
-
1.
To provide answers to RQ 1, we consider problems arising and efforts spent while following the structure of the presented procedure for each technique. The tool runs as well as the application of the quality model and the discussion with the study participants in sprint meetings enable us to derive answers for RQ 2.1 (the classification of findings as defects, their discussion and analysis) and RQ 3.1 (the comparison of individual ASA results with the results of the quality model).
One person per technique carries out the presented steps (I.1–II.3) for all SOs and versions. We discuss below in detail how we perform the procedure for each of the investigated techniques.
Code Clone Detection (CD).
We use the clone detection feature (Juergens et al, 2009a) of ConQAT 2.7 for all SOs. In conventional clone detection, the configuration consists of two parameters: the minimal clone length and the source code path. In gapped clone detection, parameters such as maximal allowed number of gaps per clone and maximal relative size of a gap are required in addition. Based on the experience of our group and initial experimentation, we set the minimal clone length to 10 lines of code, the maximal allowed number of gaps per clone to 1 and the maximal relative size of a gap in our analysis to 30%. After providing the needed parameters we run the analysis.
To inspect the analysis metrics and particular clones, ConQAT provides a list of clones, lists of instances of a clone, a view to compare files containing clone instances and a list of discrepancies for gapped clone analysis. This data is used to recommend corrective actions. In a series of clone detection runs over different SO versions, we monitor trends, i.e. how the metrics evolve.
Bug Pattern Detection (BP).
For Java-based systems we install and configure FindBugs 1.3.9 and PMD161616http://pmd.sourceforge.net 4.2.5. In C#.NET contexts we use Gendarme171717http://www.mono-project.com/Gendarme 2.6.0 and FxCop 10.0.
Aside from applying all rules, we choose two additional tool settings which we consider to be relevant for the SOs to gain two focused quality perspectives:
-
1)
Selected categories addressing correctness, performance and security.
-
2)
Selected rules for unused or poorly partitioned code and bad referencing.
The tool settings are determined during preliminary analysis test runs. Categories and rules which are considered not important – based on discussion with the study participants as well as requirements non-critical to the SOs’ application domains – are ignored during rule selection. For additional and language-independent metrics (e.g. lines of code without comments; code-comment ratio; number of classes, methods and statements; depth of inheritance and nested blocks; comment quality) as well as for result preparation and visualisation, we apply ConQAT. To simplify the issue of defect classification for our investigation, we only distinguish between rules for bugs (obvious defects), smells (simple to very complex heuristics for latent defects) and pedantry (less critical issues with focal point on coding style). The readjustment of the tools to different versions involves a revision of the rule selection, a filtering of findings and an adjustment of the list of files to analyse. Next, we analyse the finding reports resulting from the tool runs. This step involves besides the filtering of findings, primarily by rule criticality or finding frequency, the inspection of source code to confirm the severity of and confidence in these findings and to determine corrective actions. To get feedback and to confirm our conclusions from the findings, we discuss them with our study participants during a workshop.
Architecture Conformance Analysis (AC).
We start with the analysis of the architectural specification of each SO and extract relevant information. Subsequently we contact system architects and validate our perception. After installation of ConQAT, we create a reflexion model containing components and their mapping to code parts (e.g. packages, namespaces, classes). We exclude code parts from the analysis that are not relevant (e.g. certain external libraries). Then ConQAT checks the conformance of the system to the reflexion model. Every existing dependency that is not allowed by the architectural rules represents a defect. Defects are visualised by the tool on the level of components and on the level of classes. To eliminate tolerated architecture violations and to validate the created reflexion model, we discuss and classify every found defect together with the corresponding study participant. This allows us to group similar defects and to gain a general understanding.
Architecture conformance analysis requires an architectural specification of the system which circumscribes allowed and forbidden dependencies between logical components and their mapping onto the code. We are aware that this specification might be missing in some of our study objects. Unfortunately, project constraints (time, budget) hinder us and our study participants to reconstruct an architectural specification at least for our investigation if it is missing. Moreover, we want to emphasise that this reconstruction is associated with large efforts. This circumstance will also influence the evaluation and discussion of this technique.
Quality Model (QM).
We make use of the existing Quamoco base model181818http://www.in.tum.de/webportal/explorer.html with its operationalisations for Java and C# to assess the quality of the SOs. We analyse all of them with respect to the base model using the Quamoco tool chain (Wagner et al, 2012a). Accordingly, we install Quamoco which includes a setup of ConQAT. To adapt Quamoco for our study we select the appropriate model module (Java or C#) and configure the paths to the source code and executables. After running the analysis, we collect tool measurements, grades for the quality characteristics and their relations.
To answer RQ 3.1, we use the clone coverage value from the clone detection results, the total number of findings per thousand lines of code and the number of critical findings from the bug pattern results as well as the number of architecture violations from the architecture conformance results where available. Using this information, we order the SOs by their rank regarding each of these sums. The higher the number of findings or violations, the lower the rank. Similarly, we form a rank order using the overall quality grade from the Quamoco assessment. This allows us to compare each ranking from the static analysis tools directly with the aggregated result from the Quamoco assessment.
2.6.4 Step 4: Questionnaire
We use two kinds of questionnaires during the project. The first one aims at answering RQ 3.2, the second one is intended to address RQ 2.2.
Comparison of Quality Model Results and Study Participants’ Opinions.
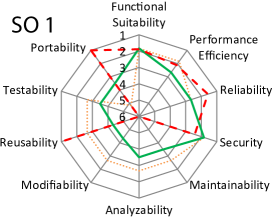
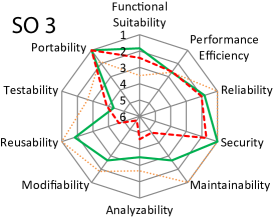
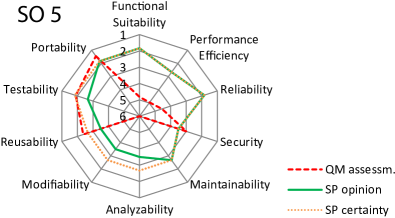
By means of a questionnaire, the companies estimate six characteristics of their systems’ quality which are taken from the Quamoco quality model: functional suitability, performance efficiency, reliability, security, maintainability and portability. Concerning maintainability, which is well elaborated in the Quamoco quality model, we are interested in four sub-attributes which we include in the questionnaire: analysability, modifiability, reusability and testability. The companies are allowed to give two estimations for each of the attributes:
-
1)
An estimation for each attribute of the quality of their product, ranging in 7 levels from Insufficient to Excellent.
-
2)
An estimation of how sure they are of their ratings, ranging in 7 levels from Unconfident to Confident.
Finally, we compare the outcome of the questionnaires with the rating offered by the quality model.
Experience in Static Analysis Techniques.
First, we evaluate the experience of the participating enterprises regarding software quality as well as static analysis techniques. Second, we determine the perceived usefulness of ASA techniques for SMEs and whether our study participants plan to use the presented techniques in their future projects. Thus, we perform a survey on our study subjects using a questionnaire containing nine questions (Q1–9) which can be found in Tables 9 and 10 in Appendix A. The study participants fill out this questionnaire and we evaluate the answers. To avoid the risk of biased or too narrowly formulated answers, we use open and closed questions. This way we contribute to RQ 2.2.
2.7 Protocol of Study Preparation (Step 1) and Execution (Steps 2–4)
We held the information event of Step 1 of our procedure in July 2009 and invited more than thirty SMEs 12 of which finally participated. Of these companies, five committed to act as study participants. The other companies were not showing commitment because of reasons we did not investigate further. We conducted the kick-off meeting in March 2010, the interviews between March and July and, finally, two consolidation workshops in July 2010. We used these meetings to analyse the experience of the enterprises, to present and identify interesting topics related to software quality and to agree on a procedure and milestones for our collaboration.
Steps 2 and 3 were conducted in two-week sprints with each of the five study participants from October 2010 to January 2011. At the beginning of each sprint, the study participants gave us an introduction to their study object, its background and rationales. We met technical prerequisites (Step 2) such as remote access to the code repository and build environment, the installation of required libraries and IDEs, the availability of architectural information and the identification of irrelevant parts of the study objects such as generated code. Additionally, we explained to the study participants how we were going to perform the analyses of the study objects and which goals we wanted to achieve.
We conducted Step 3, the measurement and analysis concentrating on the three ASA techniques, during the whole sprint. Due to time constraints, quality models could not be considered in the sprints and were postponed to the time after the sprints. After one week we held an intermediate meeting where we discussed potential problems with the study participants and presented the progress of our analyses. At the end of each sprint, we organised a final meeting with them to discuss of our findings and their criticality. Furthermore, we explained how the SPs could introduce and apply the three techniques. In January 2011 and after the sprints, we carried out the quality model analyses for each study object. The analyses could benefit from the experience and knowledge we had gained in the sprints.
In addition, we distributed a questionnaire for RQ 3.2 (Tables 10 & 9) to each of the study participants. We held the final project workshop at the end of February 2011. We presented the results and findings of the three ASA techniques and the quality model to all study participants and discussed the outcomes. After the final project workshop, we provided each of them with another questionnaire (Table 13) to answer RQ 2.2.
3 Results
In the following, we present results for each technique for research questions RQ 1 and 2 and describe our findings for RQ 3 using a quality model.
3.1 Code Clone Detection
3.1.1 RQ 1.1 – Technical Problems
Code clone detection turned out to be the most straightforward and least complicated of the three techniques. It has some technical limitations, however, that could hinder its application in certain software projects.
A major issue was the analysis of projects containing both markup and program code like JSP or ASP.NET. Since ConQAT supports either a markup language or a programming language during a single analysis run, the results for both languages need to be aggregated. To avoid this complication and concentrate on the code implementing the application logic, we only considered the code written in the programming language and ignored the markup code. Nevertheless, spending the effort of combining markup and program clone detection would provide more accurate results.
Another technical obstacle was filtering out generated code from the analysed code base. In one SO, large code portions were generated by the parser generator ANTLR191919http://www.antlr.org. We excluded such code files from our analysis using regular expressions.
Finally, the technique as applied is limited in the types of detectable clone classes. One may come across semantic clones, i.e. code fragments which exhibit highly similar input-output behaviour but they differ too much to be recognised as normal or gapped clone instances. Chapter 4 refers to possible solutions to these issues.
3.1.2 RQ 1.2 – Spent Effort
| Phase | Work Step |
Clone
Detection |
Bug Pattern Det. |
Architecture
Conformance |
Quality Model |
|---|---|---|---|---|---|
|
I.
Introduction |
Individual procedure for preparation |
setup:
|
conception: | ||
| aggregation: | reflexion model: | ||||
|
II.
Application |
1. Readjustment | n/a | |||
| 2. Run analysis | |||||
| 3. Inspection | , gapped: |
Table 2 gives an overview of the needed effort. The time required to introduce clone detection is small compared to the other two ASA techniques under study. The ease of introduction of clone detection is achieved due to the minimalist configuration of the analysis which, in the simplest case, includes the path to the source code and the minimal length of a clone. Our estimations were made under the assumption that relevant tool manuals (Deissenboeck et al, 2010a) have already been consulted.
For all SOs, it took less than an hour to configure clone detection, to get the first results and to investigate the longest and most frequent clones. Running the analysis itself took less then five minutes.
In case of gapped clone detection, it took a considerable amount of time to determine whether a discrepancy is intended or whether it represents a defect. To speed up the rest of our procedure, ConQAT supports the intended discrepancies to be fingerprinted and excluded from further analysis runs.
3.1.3 RQ 2.1 – Found Defects
| SO | Ver. | Analysed Units [kUnits] | Cloned Units [kUnits] |
Blow-up
[%] |
Unit
Coverage [%] |
Longest Clone [Units] | Most Clone Instances |
|---|---|---|---|---|---|---|---|
| I | 15.9 | 3.5 | 119.5 | 22.2 | 112 | 39 | |
| 1 | II | 25.3 | 5.8 | 118.9 | 23.0 | 117 | 39 |
| III | 32.3 | 7.8 | 119.2 | 24.0 | 117 | 39 | |
| I | 35.4 | 14.3 | 143.1 | 40.5 | 63 | 64 | |
| 2 | II | 41.6 | 18.9 | 150.2 | 45.4 | 132 | 47 |
| III | 39.9 | 14.6 | 137.4 | 36.7 | 89 | 44 | |
| I | 51.7 | 9.4 | 114.5 | 18.2 | 79 | 21 | |
| 3 | II | 56.8 | 8.6 | 111.2 | 15.1 | 52 | 20 |
| III | 61.6 | 8.4 | 110.0 | 13.7 | 52 | 19 | |
| I | 8.9 | 6.0 | 238.8 | 68.0 | 217 | 22 | |
| 4 | II | 22.4 | 17.3 | 309.6 | 77.6 | 438 | 61 |
| III | 38.3 | 30.4 | 336.0 | 79.4 | 957 | 183 | |
| I | 196.3 | 48.7 | 122.3 | 24.8 | 141 | 72 | |
| 5 | II | 211.3 | 53.4 | 122.7 | 25.3 | 158 | 72 |
| III | 208.6 | 53.2 | 122.8 | 25.5 | 156 | 72 | |
The Tables 3 and 4 show detailed results of conventional and gapped code clone detection for three versions of each SO. As explained in Section 2.4, the column “Analysed Units” shows numbers smaller than the actual code size given in Table 1.
The results of conventional clone detection can be interpreted as an indicator of bad design and software maintainability problems, but they do not point at actual defects. Nevertheless, these results indicate code parts as candidates for improvement. The following three types of clones were detected in all analysed systems to a certain extent: cloning of exception handling code, cloning of logging code and cloning of interface implementation by different classes.
In the analysed systems, unit coverage varied between 14 and 79% (Table 3). Koschke (2007) reports on several case studies with unit coverage values between 7 and 23% and one case study with a value of 59%, which he defines as extreme. Therefore, SO 1, 3 and 5 exhibit normal clone rates according to Koschke. The clone rate in SO 2 is higher than the rates reported by Koschke, and for SO 4 it is extreme. Regarding maintenance efforts, the calculated blow-up for each system may indicate a risk. For example, version III of SO 4 is more than three times bigger as its hypothetically equivalent system containing no clones. SO 4 shows that cloning can increase over time, while SO 3 reveals that it is possible to reduce the amount of its code clones.
| SO | Ver. | Analysed Units [kUnits] | Cloned Units [kUnits] |
Blow-up
[%] |
Unit
Coverage [%] |
Longest Clone [Units] | Most Clone Instances |
|---|---|---|---|---|---|---|---|
| I | 13.3 | 3.0 | 119.9 | 22.3 | 34 | 39 | |
| 1 | II | 21.0 | 4.5 | 117.9 | 21.5 | 37 | 52 |
| III | 27.1 | 6.0 | 117.4 | 22.1 | 52 | 52 | |
| I | 24.3 | 4.6 | 116.3 | 19.0 | 156 | 37 | |
| 2 | II | 34.7 | 8.7 | 123.2 | 25.0 | 156 | 37 |
| III | 37.1 | 9.4 | 123.7 | 25.3 | 156 | 37 | |
| I | 46.7 | 12.0 | 124.4 | 18.2 | 73 | 123 | |
| 3 | II | 46.1 | 10.0 | 120.0 | 15.1 | 55 | 67 |
| III | 49.1 | 10.0 | 118.6 | 20.5 | 55 | 64 | |
| I | 7.8 | 4.5 | 192.1 | 58.6 | 42 | 34 | |
| 4 | II | 18.8 | 11.0 | 206.2 | 59.8 | 51 | 70 |
| III | 32.2 | 19.2 | 211.1 | 59.5 | 80 | 183 | |
| I | 142.3 | 29.4 | 117.4 | 20.7 | 66 | 68 | |
| 5 | II | 154.0 | 32.8 | 118.0 | 21.3 | 85 | 78 |
| III | 151.9 | 32.7 | 118.2 | 21.5 | 85 | 70 | |
Code clones are considered harmful because they increase the chance of unconscious, inconsistent changes, which can lead to faults (Juergens et al, 2009b). These changes can be detected using gapped clone detection. Table 4 shows corresponding results. We found a number of such changes in the cloned code fragments, but we could not classify them as defects, because we lacked knowledge about the SOs. Despite our workshop discussions, the study participants were not able to definitely classify these discrepancies as defects. This indicates that gapped clone detection is a more resource demanding type of analysis. Nevertheless, in some clone instances we identified additional instructions or deviating conditional statements compared to other instances of the same clone class. Gapped clone detection does not cross method boundaries, since experiments showed that inconsistent clones that cross method boundaries in many cases did not capture semantically meaningful concepts (Juergens et al, 2009b). This explains why metrics such as cloned units or unit coverage (Table 4) may differ from values observed with conventional clone detection (Table 3). The smaller numbers in column “Analysed Units” of Table 4 result from the exclusion of units not meaningful for the gapped variant, e.g. source code outside from method definitions.
3.1.4 RQ 2.2 – Perceived Usefulness
Following the feedback obtained from the questionnaire (see Q1–Q8 in Tables 9 and 10 in Appendix A), two study participants had limited experience with clone detection, the other three did not consider it at all (Q2). Three participants estimated the relevance of our clone detection results to their projects as high, the other two estimated it as medium relevant (Q3). SO 2 and 4 had high clone rates. The participant responsible for SO 2 considered this as medium relevant. For SO 4, the SP considered its clone rates as highly relevant. The relevance is underpinned by one SP’s argument that “clone detection is only feasible with tool support” which we demonstrated (see Q1 in Table 10). Another interesting statement was that “clones are necessary within short development cycles.” Finally, all SPs evaluated the importance of using clone detection in their projects as medium to high and plan to introduce this technique in the future (Q5).
3.2 Bug Pattern Detection
3.2.1 RQ 1.1 – Technical Problems
We can confirm that bug patterns are a powerful technique to gather a vast variety of information about potentially defective code. However, most of its effectiveness and efficiency is achieved through carefully done, project-specific fine-tuning of the many setscrews available. This is confirmed by Boogerd and Moonen (2009) and Ruthruff et al (2008). In the following, we mention three important issues:
First, the impact of findings on product quality factors or characteristics of interest and their consequences for the project (e.g. corrective actions, avoidance or tolerance) were difficult to determine by the tool-provided rule categories, the severity and confidence information. Based on our experience, we identified the following study object characteristics this impact depends on:
-
•
Required usage-level qualities, e.g. security, safety, performance, usability
-
•
Required internal qualities, e.g. code maintainability, reusability
-
•
Technologies, i.e. language, framework, platform, architectural style
-
•
Criticality of the context, the findings belong to, e.g. platform or driver code
Second, some rules exhibited many false positives, either because their technical way of detection is fuzzy or because a definitely precise finding is considered not relevant in a project-specific context. The latter case requires an in-depth understanding of each of the rules, the impacts of findings and, subsequently, a proper redlining of rules as pedantry or, actually, irrelevant. We neither measured the rates of false positives nor investigated costs and benefits thereof as our focus lay on the identification of the most important findings only.
Third, due to restricted selection and filtering mechanisms within the tools as well as lack of knowledge about the SO life cycles, we were hindered to apply and calibrate appropriate rule selectors and findings filters. We saw that the usefulness of results is crucially influenced by the conversion of project-specific information on rule impacts into queries for rule selection and findings filtering. The tools largely differ in their abilities to achieve this task via their graphical or command-line interfaces.
We addressed the first two issues by group discussion also with our study participants and improved rule selection and findings filtering to principally avoid the finding reports to get overloaded or prone to false positives of the second kind. The third issue could also only be compensated by manual efforts. As most finding reports were quite homogeneously encoded and technically well accessible, we utilised ConQAT to gain statistical information for higher-level quality metrics as listed in Step 3 of our procedure. Chapter 4 refers to approaches to better overcome these issues.
3.2.2 RQ 1.2 – Spent Effort
Table 2 gives an overview of efforts. We achieved the initial setup of a single bug pattern tool in less than an hour. This estimation excluded the time needed to gain previous knowledge about the internal structure of the SO such as, e.g. its directory structure and third party code. We used the ConQAT framework to flexibly run the tools in a specific setting and for further processing of the finding reports. Having good knowledge of this framework, we completed the analysis setup for an SO (selection of rules, adjustment of bug pattern parameters and framework setup) in about half a day.
The runs took between a minute and an hour depending on code size, rules selection and other parameters. Hence, bug pattern detection should at least be selectively included into automated build tasks. Part of the rules are computationally complex and some tools frequently required more than a gigabyte of memory. The manual effort after the runs can be split into inspection and readjustment. The inspection of a report took us a few minutes up to half an hour. Readjustment of the rule selector and the findings filter requires deep knowledge of the type, objectives and evolution history of an SO. As we could not gain this knowledge in our two-week sprints (see Section 2.6), readjustment was only done roughly and, hence, took no more than half an hour.
3.2.3 RQ 2.1 – Found Defects
We conducted bug pattern analysis in three selective tool settings according to Step 3 but only for one version of each SO. Table 5 summarises noticeable findings that have been most critically rated by the tools, exhibited relatively high frequencies or have been extraordinarily remarkable. For all SOs, the filtered finding reports confirmed the defects focused or expected by these settings. We used “*” to label findings which have been explained to our study participants and consensually confirmed as critical at the final project workshop. Without going into the quantities and details of single findings, we summarise language-specific results:
- C#
-
Among the rules with the most critical or frequent findings in SO 1 and 2, FxCop and Gendarme reported empty exception handlers, visible constants and poorly structured code. There was only one kind of findings related to correctness consensually considered to be critical in SO 1, namely unacceptable loss of precision through wrong cast during an integer division used for accounting calculations (Table 5).
- Java
-
Among the rules with the most critical or frequent findings in SO 3, 4 and 5, FindBugs and PMD reported unused local variables, missing validation of return values, wrong use of serialisable (mainly SO 3) and extensive cyclomatic complexity, class or method size, nested block depth, or parameter list (SO 3, 4 and 5). There have only been two kinds of findings related to correctness consensually considered to be critical, both in SO 5, namely foreseeable access of a null pointer and an integer shift beyond 32 bits in a basic date-time calculation component (Table 5).
Independent of the programming language and concerning security and stability, we detected the pattern problematic method call in four out of five SOs (e.g. frequently in SO 3 and 5: constructor calls overwritable method) and found a number of defects related to error prone handling of pointers. Concerning maintainability, the SOs exhibited missing or unspecific handling of exceptions, manifold violations of code complexity metrics and various forms of unused code.
| Tool (Lang.) | Rule or (G)roup of Rules | Study Objects (Ver.) | Most affected Qualities | ||||
| III | III | III | II | II | |||
| C# | C# | J | J | J | |||
| FxCop (C#) | Empty/general except. handlers | 106 | 47 | - | - | - | Maintainability |
| Nested use of generic types | 17 | 24 | - | - | - | ||
| Gendarme (C#) | Deep namespaces with depth | 0 | 35 | - | - | - | |
| Visible constants | 338 | 18 | - | - | - | Security | |
| Suspicious type conversion | 3* | 0 | - | - | - | Correctness | |
| Gend., PMD | G: Problematic method calls | 2 | 8 | i | 0 | i | Secur., stability |
| G: Extensive class/method size or parameter count; too many fields | 20 | 1 | i | i | i | Maintainability | |
| PMD (Java) | G: Empty methods | - | - | i | 0 | i | |
| Cyclomatic complexity | - | - | 256 | 49 | 938 | ||
| FindBugs (Java) | G: Unused fields/variables | - | - | 132 | 0 | 2 | |
| G: Inefficient string manipulation | - | - | 49 | 0 | 0 | Performance | |
| G: Corrupted serialisable | - | - | 12 | 0 | 0 | Correctness | |
| Integer shift beyond 32 bits | - | - | 0 | 0 | 4* | ||
| Return values not validated | - | - | 32 | 0 | 0 | Correctn., secur. | |
| Access of a null pointer | - | - | 1 | 0 | 2* | Secur., stability | |
| Maximum Metrics (suggestions in parentheses) | |||||||
| PMD | Max. cyclomatic complexity () | - | - | 78 | 156 | 216 | Maintainability |
| ConQAT | Max. nested block depth () | 11 | 13 | 19 | 17 | 14 | |
3.2.4 RQ 2.2 – Perceived Usefulness
According to the questionnaire (see Q1–Q8 in Tables 9 and 10 in Appendix A), all of the study participants considered our bug pattern findings to be medium to highly relevant for their projects (Q3). The sample findings, we presented during our final project workshop, particularly Table 5, were perceived as critical enough to be treated if they had been found during the development of the SOs. However, the SPs did not perceive these findings as threats to the business success of the SOs. The low number of consensually critical findings correlated well with the fact that the technique was known to all SPs and that most of them have good knowledge thereof and regularly used such tools in their projects, at least monthly, at milestone or release dates (Q1-2). Monthly use of FindBugs and PMD, as confirmed by the SP of SO 4, largely explains its relatively positive BP situation. However, three of the SPs could gain additional education in this technique (Q4). One stated that the presented analyses are “often not feasible in projects externally conducted at the customer’s site” (Q8). Nevertheless, all the participants indicated to use bug patterns as an important QA instrument in their future projects (Q5).
3.3 Architecture Conformance Analysis
3.3.1 RQ 1.1 – Technical Problems
We observe two general problems that prevent or complicate each architectural analysis: The absence of system architecture specification and the usage of dynamic patterns of architecture design, i.e. a programming technique that increases flexibility through postponing type binding and identification until run-time.
For two of the SOs, no architectural specification was existent. In case of SO 3, the SP was aware of the lack of such documentation. Nevertheless, they feared that the time involved and the sheer volume of code to be covered exceeds the benefits. The need to update the specification, within several months or each time a new release is coming out, was stated as an additional argument. For SO 5, the specification was missing because the project was taken over by SS 5 from a different organisation that was not documenting the architecture at all, for reasons we could not determine. The SP argued that any later specification of the architecture would be too expensive.
In SO 2, a dynamic design pattern was implemented so that no static dependencies could be found between defined components. The components belonging to the system are connected at run-time. Hence, architecture conformance analysis could not be applied. Additional configuration files used for dynamic patterns have not been taken into account by the tools we used.
Architecture conformance analysis needs two ingredients apart from the architecture specification: The source code and the executables of a system to resolve symbolic references. This is a potential barrier because the source has to be compilable to be analysed.
Another technical problem occurred while using ConQAT. Dependencies to components solely existing as executables were not recognised by the tool. Hence, all rules belonging to compiled components with missing source could not be analysed.
Finally, we could apply this technique to two systems without any technical problems. An overview of all SOs with respect to their architectural properties can be found in Table 6.
3.3.2 RQ 1.2 – Spent Effort
Table 2 gives an overview of efforts. The first step in applying this technique would be the creation of an appropriate architecture specification. As explained in Section 2.6.3, we had to leave this out. Hence, we faced two situations: Either we could use the specification to build a reflexion model of the system or the study object was lacking such a specification.
In case of a missing specification, we asked the study participants to give reasons for the situation and why neither an a-priori specification nor an a-posteriori reconstruction was considered. For SO 3, the study participant argued that the cost-value ratio of a later reconstruction would be too bad considering the effort to maintain it. As the system is changing continuously and its development is distributed to many locations, the study participant decided against an architecture specification. During the evolution of SO 5, such a specification was never produced. As SO 5 grew to a size of 560 kLoC and its inner structure got more complex, the effort for the creation of an architecture specification was considered too costly by its SP. As explained in the last section, technical obstacles were hindering the application of the technique for SO 2. The effort that was required to create the two other architecture specifications (SO 1, SO 4) could not be precisely estimated by the study participants. We think that it is difficult to exactly determine the whole time that was spent on creating a specification because this conceptual artefact is usually influenced by many project specific characteristics and tasks.
The most time consuming task was to inspect the architecture specification and to understand their content, to discuss them with system architects and to identify relevant code fragments, which took us in total up to one day. The initial configuration of ConQAT including the creation of the reflexion model could be achieved in less than one hour.
Table 6 shows the number of modelled components and the rules that were needed to describe allowed connections. The analysis run finished in less than ten seconds. The time needed for the interpretation of the analysis results is of course dependent on the amount of defects found. For each defect, we were able to find the causative code parts within one minute. We expect that the effort needed for bigger systems will only increase linearly but will stay small in comparison to the benefit that can be achieved using architecture conformance analysis.
| SO | Architecture | Version | Violating Component Relationships | Violating Class Relationships |
|---|---|---|---|---|
| 12 Components
20 Rules |
I | 1 | 5 | |
| 1 | II | 3 | 9 | |
| III | 2 | 8 | ||
| 2 | dynamic pattern | n/a | n/a | n/a |
| 3 | undocumented | n/a | n/a | n/a |
| 14 Components
9 Rules |
I | 0 | 0 | |
| 4 | II | 1 | 1 | |
| III | 2 | 4 | ||
| 5 | undocumented | n/a | n/a | n/a |
3.3.3 RQ 2.1 – Found Defects
As shown in Table 6, we observed several discrepancies in the analysed SOs across nearly all versions. Only one version did not contain architecture violations. Overall, we found three types of defects in the analysed SOs. Each defect represents a code location showing a discrepancy to the architecture specification. All defects we found could be avoided if this technique had been applied. In the following, we explain the types of defects found and classified together with the study participants. All findings were rated by the study participants as critical.
-
•
Circumvention of abstraction layers: Abstraction layers (e.g. presentation layer) provide a common way to structure a system into logical parts. The defined layers are hierarchically depending on each other, reducing the complexity in each layer and allowing to benefit from structural properties like exchangeability or flexible deployment of each layer. These benefits vanish once the layered concept is harmed by dependencies between layers that are not connected to each other. In our case, e.g. the use of the data layer by the presentation layer was a typical defect.
-
•
Circular dependencies: We found undocumented circular dependencies between two components. We consider them – whether or not documented – as defects themselves because they affect principles of well designed architectures. Two components that are depending on each other can only be used together and can thus be considered as one component. The reuse of these components is strongly restricted. Their source code is harder to understand and to maintain.
-
•
Undocumented use of common functionality: Every system’s internals make use of a set of common functions (e.g. for date-time manipulation) which are often grouped into a “library” component to be easily accessed and maintained. Thus, it is important to have an overview of where these functions are actually used. Our investigation showed such dependencies that were not covered by the architecture specification.
-
•
Data dependencies between components: Aside from using external methods or remote procedures, components are often also using data structures defined in other components, e.g. classes, enumerations or user interface elements. Such dependencies can occur in various contexts, e.g. field declarations, method arguments or inheritances. Data dependencies between components are often not obvious and should therefore be documented.
3.3.4 RQ 2.2 – Perceived Usefulness
Following the feedback gained from the questionnaire (see Q1–Q8 in Tables 9 and 10 in Appendix A), we observed that four out of five study participants did not know about the possibility of automated architecture conformance analysis (Q1). Only one of them already checked the architecture of their system, but in a manual way and infrequently. Confronted with the results of the analysis, all participants rated the relevance of the presented technique as medium to highly relevant (Q3). One of them stated that, as a new project member, it is easier to become acquainted with a software system if its architecture conforms to its documented specification (Q3). All participants agreed on the usefulness of this technique and plan its future application in their projects (Q5).
3.4 Quality Models
3.4.1 RQ 3.1 – Matching with ASA Results
For this research question, we compare the evaluations of the SOs that one can get by manually looking at the numbers of findings and violations directly with the aggregated and weighted evaluation of the Quamoco quality model. This comparison gives us the opportunity to investigate whether the aggregation has an effect. We can find out some differences but not determine any exact causes for them.
We used the findings and violations from ASA as well as the Quamoco assessment grades to form rank orders for the SOs. The result is shown in Table 7. The Quamoco model assessment ranks SO 2 as best with a grade of 1.5 and SO 5 last with a grade of 4.5. There is a large spread considering the grade range from 1 to 6 and only the grades of SO 1 and SO 3 are so close that the order might be questionable. More details can be found in Tables LABEL:tab:rq3.1 and 12 in Appendix A.
| SOs ranked by | |||||
|
Rank |
Clone Detection
|
Bug Pattern
|
Bug Pattern
|
Architecture Conformance
|
Quality Model Overall Grade |
| 1. | 3 (13.7%) | 4 (0.49) | 2, 3, 4 (0) | 4 (4) | 2 (1.5) |
| 2. | 1 (24.0%) | 2 (0.67) | 1 (9) | 4 (2.0) | |
| 3. | 5 (25.5%) | 5 (1.69) | 3 (2.5) | ||
| 4. | 2 (36.7%) | 3 (2.41) | 1 (3) | 1 (2.8) | |
| 5. | 4 (79.4%) | 1 (4.68) | 5 (6) | 5 (4.5) | |
Clone Coverage vs. Overall Grade.
Extreme clone rates of more than 79% lead to the last place of SO 4 while SO 3 ranks best with a rather low clone coverage of almost 14%. SO 1 and SO 5 have similar clone coverage around 25%. SO 2 ranks fourth with a clone coverage of almost 37%. Surprisingly, the clone coverage results are not reflected in the quality grades. The worst ranked SO 4 in terms of cloning reaches rank 2 in the quality grades. Instead, other study objects, which possess normal clone rates (SO 1, SO 5), are ranked worst by the quality model. In summary, code clone coverage as a single factor gives strongly different quality rankings in comparison to the results given by the quality model.
Total Bug Pattern Findings vs. Overall Grade.
The numbers of total bug pattern findings per 1000 lines of code range from 0.49 to 4.68. The highest rank is achieved by SO 4 with SO 2 as a close second. SO 3 and SO 1 are ranked as the worst. This ranking is close to the one from the quality model assessment. The only difference is that SO 5 is on the third position when purely counting findings while the aggregated assessment ranks it last. Aggregation and weighting based on a calibration over various open source systems introduces a view differing from purely counting findings.
Critical Bug Pattern Findings vs. Overall Grade.
Because there were only a few critical bug pattern findings, we cannot completely separate them by ranks. SO 2, SO 3 and SO 4 did not show any critical findings and are ranked best. SO 1 is on position 4 with three critical findings and SO 5 on position 5 with six critical findings. Apart from the differentiation of three SOs, this is an even better fit to the quality model ranking. The worst SOs are ranked exactly the same. Therefore, concentrating on critical findings seems to provide a picture similar to the aggregated quality model result.
Architecture Conformance Violations vs. Overall Grade.
Finally, the results for architecture conformance violations are limited because we only have two SOs for this technique. We can rank them. SO 4 is on the best position with four violations while SO 1 ranks second with nine violations. We cannot say if the overall ranking would be similar to the ranking from the quality model, but the order of the two SOs is the same. The quality model also sees SO 4 as having a better quality than SO 1. Hence, these evaluations seems similar.
3.4.2 RQ 3.2 – Comparison to the Study Participants’ Opinions
Following our procedure, we received three answered questionnaires from the study participants for SO 1, 3 and 5. Their evaluation revealed differing results compared to the grades given by the quality model. Three radar charts, as illustrated by Figure 1, show the estimated rating and confidence by the study participants as well as the result of the quality model. The three SPs rated their study object in most of the characteristics better than it is was done by the quality model. The most interesting deviation occurs for “maintainability”, where each of the three study objects achieved a bad (SO 3: grade 4.76) or even the worst possible grade (SO 1 and 5: grade 6), whereas all study participants gave better ratings.
Interestingly, all of the study participants reported that they were quite confident (5 out of 7) of their estimation. Accordingly, there is a mismatch between the ratings provided by the quality model and the opinion of the SPs. Tables 12 and 13 provide further details.
3.5 Summary and Overview of Results
Table 8 depicts the most relevant findings among the results and answers to RQ 1, 2 and 3 in the previous sub-sections. This overview will be reflected and further interpreted in the following discussion.
| RQ | Clone Detection (CD) | Bug Pattern Detection (BP) | Architecture Conformance (AC) |
|---|---|---|---|
|
1.1
Technical obstacles |
F1) multiple languages and semantic clones
F2) false positives by generated code |
F3) hard estimation of criticality and false positives
F4) difficult rule selection and findings filtering |
F5) non-existent architecture specification (2 SOs)
F6) usage of dynamic patterns (1 SO) |
|
1.2
Spent effort |
F7) low effort for CD
F8) medium effort for gapped CD |
F9) high effort for aggregating data
F10) needs frequent readjustment |
F11) high effort for understanding of specification
F12) low effort of application F13) effort for application scales with number of findings F14) creation of a missing architecture specification is too costly |
|
2.1
Found defects |
F15) two of five SOs exhibited high clone rates
F16) no evidently inconsistent changes F17) large clone classes |
F18) few consensually critical findings in two of five SOs
F19) many language-independent code complexity issues |
F20) four types of critical findings
F21) avoidable defects in productive code |
|
2.2
Perceived usefulness |
F22) CD was relatively new to participants
F23) perceived as useful and planned to be introduced |
F24) already in use but should be enhanced |
F25) AC was new to participants
F26) all partners rated AC medium to highly important and plan its application |
| RQ | Quality Model (QM) |
| 3.1 Matching with ASA |
F27) QM ranking is similar to critical BP and AC rankings but differs slightly from total BP ranking
F28) QM ranking differs strongly from CD ranking |
| 3.2 Matching with SP |
F29) mismatch between the QM and the study participants’ assessment
|
4 Discussion
In the following, we discuss the results of Section 3, particularly focusing Table 8 which summarizes our findings (denoted by Fx), some general observations as well as possible solutions to critical problems and lessons learned from performing our analyses.
4.1 Reflection of Results
Regarding RQ 1.1, we faced some obstacles during introduction and application of all ASA techniques. For RQ 1.2, clone detection required relatively low effort (F8) whereas the other two techniques took significantly more time to be conducted (F8, F8). Regarding RQ 2.1, we found large clone classes in SO 2 and 4 (F8), aside from smells and pedantry a sufficient202020Following Wagner et al (2008), three released bugs would suffice to justify ASA efforts. number of pattern-based bugs in SO 1 and 5 (F8), and unacceptable architecture violations in SO 1 and 4 (F8). For RQ 3, the quality model assessment was different from both, the ASA results (F8, F8) and the opinions of the study participants.
4.2 General Observations
Observation 1: Code clone detection and architecture conformance analysis were quite new to our study participants as opposed to bug pattern detection (F8, F8).
This may result from the fact that checking coding guidelines or style as well as simple bug pattern detection are standard features of modern development environments. However, we consider it as important to know that code clone detection can indicate critical and complex relationships residing in the code at minimum effort (F8). Through our work we made our SPs aware of the usefulness of architecture conformance analysis (F8), both in the case of available architecture specification and the construction of a specification.
Observation 2: As expected, we found that all of the three techniques can be introduced and applied with resources affordable for small enterprises.
Except for readjustment phases at project initiation or after substantial product changes, we assume that the effort of readjusting the settings for the techniques (F8) stays very low. This effort is compensated by the time earned through narrowing results to successively more relevant findings. Moreover, our SPs predominantly perceived the discussed and demonstrated techniques as useful (F8, F8) for their future projects (see Q5 in Table 9 and Q8 in Table 10).
Observation 3: We perceived our analyses of the study objects to be successful in finding the expected maintainability issues as well as few critical defects (F8, F8, F8).
We share this perception with our study participants as they considered our results to be relevant (see Q3 in Table 9). In our questionnaire, we asked about their expectations on the results. The background of the SME collaboration and the answers to Q6 and Q7 indicate two expectations of the SPs: First, they are interested in getting a more precise idea of their SO’s current quality. Second, they want to improve their capabilities, i.e. to intensify their QA provisions, ASA tool usage and team communication. This reflects our own expectations.
Observation 4: Quality models provided different rankings in comparison to single ASA techniques (F27, F28).
We found a mixed picture in comparing the rankings of single ASA techniques and the aggregated and weighted rankings of the Quamoco quality model. Two rankings were almost the same as the quality model ranking: Critical bug pattern findings and architecture violations. The total bug pattern ranking was similar but ranked one SO differently and the clone detection ranking was completely different. This means that the aggregation in the model leads to notably different evaluation results for the SOs. The critical bug patterns findings were ranked similar. This could mean that we considered findings to be critical which were weighted strongly in the quality model. Assuming that the designers of the quality model created sensible aggregations, our results suggest that it gives distinct and useful information from merely counting findings and violations. We conclude that a quality model can provide a more strongly argued view on the quality of a software system. This view can be achieved in an automated and more efficient manner which, in turn, is affordable for SMEs.
Observation 5: Quality models saved time in application compared to ASA techniques.
It took us less than 90 minutes to run the analysis and to inspect the findings. Quality models reduce the effort in comparison to the individual use of ASA techniques, especially for bug pattern detection. This fact substantiates when taking into account that the Quamoco tool chain performs several automated analyses and uses more rules than we had chosen for our individual analyses.
Observation 6: Contrary to our expectation, we partially observed a strong mismatch between the opinions of the study participants and the ratings of the quality model (F8).
Such a mismatch was observable although the study participants already knew of the (partially critical) defects we found by static analysis. The mismatch might stem from the fact that the quality model and the SPs apply different instruments to evaluate a certain software system. Our quality model mainly aggregates ASA findings to assess quality characteristics: Software quality is evaluated using technical information which predominantly resides in a system’s source code. Hence, bug pattern detection is the dominating method.
A study participant has different access to study objects and their quality assessment. The SP usually knows the course of events throughout the SO life cycle, the measures being taken, the structure of the system, the problems that arose and the money that has been spent for different actions. His understanding of software quality characteristics is based on intuition rather than an explicit quality model. Accordingly, he weighs his knowledge, tries to estimate different characteristics and reasons about his confidence.
In contrast, there are factors used by the quality model which the study participant may not include in his estimation or ascribe a lesser importance or continuity of observation to them. Possible factors are e.g. the amount of clones in the code or the usage of default cases in switch statements. Such factors can hardly be estimated by humans without the usage of static analyses but form the basis for the quality model assessment. It is also possible that a study participant is not well prepared to process the huge amount of different aspects and static analysis warnings and, hence, neglects some information. We cannot give a clear answer to whether the quality model or the study participants achieve a better quality assessment.
4.3 Overcoming Obstacles and Limitations in RQ 1.1 and 2.1
Technical problems during ASA (RQ 1.1) and limitations in finding defects (RQ 2.1) are strongly governed by the effort spent and the techniques applied for incorporating highly specific knowledge about the SOs into the analysis, e.g. very careful fine-tuning of the ASA tools, clone and bug-pattern filters or architecture models. In the following, we discuss some approaches overcoming these obstacles and limitations.
For code clone detection (F8, F8), Lanubile and Mallardo (2003) performed research on finding clones in web applications usually consisting of mixtures of mark-up and procedural code. Our approach is technically limited in analysing such software. Introducing a semi-automatic approach could remove this limitation. Deissenboeck et al (2012) discuss the challenges concerning semantic clones. Elva and Leavens (2012) sketch their dynamic detection based on what they call input-output-effect behaviour. Although their investigation of false positives lacks maturity, their detector for identifying such clones has potential to improve our results.
For bug pattern detection (F8, F8), Bessey et al (2010) confirm that misunderstood explanations of findings causes true errors to be ignored or, worse, transmuted into false positives. Thus, complicated analyses have to be well explained to developers. More than 30% of perceived false positives give them reasons to ignore ASA tools at all. The tools used for this report made it quite difficult and tedious to manually adjust filters to compensate for this problem. However, scientists worked on several solutions: For example, Ferzund et al (2008) report on the effectiveness of rules for smell detection. The rules they developed are based on machine learning and source file statistics provided by static code metrics. They used training information from two software projects including bug databases. Kremenek (2008) thoroughly discusses false positive filtering using Bayesian networks and statistical reasoning. Beyond that, he utilises specification inference to enhance detection to further types of defects. Ruthruff et al (2008) statistically analysed warnings of FindBugs deployed in a large software organisation. They could successfully reduce both, (a) spurious false positive warnings (in several studies up to a third of the warnings even from sophisticated tools) and (b) legitimate warnings without action (about half of the warnings in their study). For a television control system, Boogerd and Moonen (2009) investigated the relationship between coding guideline violations detected by ASA tools and bugs identified and treated by developers. The positive correlation is restricted to a small part of the applied rules (10 out of 88) and very sensitive to the project. In the report at hand, we did not address the estimation of rule effectiveness but focused on their manual selection and application.
For architecture conformance analysis (F8, F8), we confirm the general limitations reported by Passos et al (2010). Constraints depending on dynamic information can not be checked by current architecture conformance tools. Nevertheless, we think that this limit could be compensated by the use of dynamic analyses which we did not take into consideration. To the best of our knowledge this approach is not described in the literature.
In summary, utilising some of these approaches alleviates the perceived obstacles and limitations by decreasing but not necessarily eliminating the need to incorporate individual or SO-specific knowledge into the analysis.
4.4 Usage Guidelines
During the repetitive conduct of Steps 2 and 3 of our procedure, we gained more experience in applying the chosen techniques. For their introduction and application to a new project, we consider the following generic procedure as helpful:
-
1)
Establish a project-specific configuration. This particularly includes the choice of bug pattern rules and the customisation of the quality model to reflect the relevant design or coding guidelines and quality characteristics.
-
2)
Define events for measurement, findings filtering, quality assessment and for documentation. Filtering and assessment requires in-depth knowledge of stakeholder requirements, the system and its critical components. For bug pattern detection this knowledge influences severity and confidence levels. For architecture conformance analysis this knowledge influences the definition of allowed, tolerated, and forbidden dependencies.
-
3)
Decide whether to treat or tolerate findings and bad quality grades. This decision involves (i) the inspection of results and defective code, (ii) the issuing of change requests for defect removal and, (iii) the documentation of efforts spent to assess efficiency.
-
4)
Determine whether and how defects or bad quality grades can be avoided using the lessons learned from defect treatment for future coding practice and process management.
-
5)
Strengthen quality gates through improved criteria that follow patterns, such as “Clone coverage in critical code package below prior to any bundled feature introduction.”, “No critical security errors with confidence according to tool for any release.”, “No architecture violations originating from change sets of new features.”, or “Grade for analysability of core components.”
-
6)
For project control in the context of continuous integration, derive statistics and trends from findings reports by a quality control dashboard such as ConQAT or the Quamoco tool chain.
Chandra et al (2006) provide comparable usage guidelines for static analysis tools.
5 Threats to Validity
In the following, we discuss threats to the validity of our results. We structure them into internal and external threats.
5.1 Internal Validity
First, a potential threat to the internal validity is that most of our project partners had little experience with most of the applied ASA tools. This could imply additional technical problems (RQ 1.1), which would not have occurred when collaborating with advanced tool users or experts. Furthermore, the efforts measured for RQ 1.2 may be larger. We mitigated this risk through discussions with experts and we assume that the introduction in other companies would also be performed by non-experts.
Second, we did not record exact time measurements of the efforts spent. We rather made order of magnitude estimations. We consider this threat to be small as such estimations should be sufficient in a project management context.
Third, we did not check empirically whether or how the defects, which we consensually perceived to be critical, contributed to costly system failures during operation or significant budget overruns during the SO life cycle (Section 3.2.4). Due to the lack of knowledge about these life cycles, the defect criticality may have been estimated improperly. As discussed for the results of gapped clone detection or bug pattern detection, it is hard to properly estimate the impact of such defects. As already mentioned, there were many easily detectable false positives. Aside from these, we tried to reduce more subtle false positives among the most relevant defects listed, through detailed inspection and group discussion.
Fourth, the questionnaire results could be wrong, due to study participants either knowingly or unknowingly giving incorrect answers. We mitigated this threat by asking them to be careful in filling it out while, at the same time, assuring anonymity to them.
Fifth, we did not check all the relationships and evaluation specifications in the Quamoco base quality model. Hence, it is possible that there are incorrect relationships distorting our results. We consider this threat to be small as the quality model was inspected by several experts and showed good empirical validation results (Wagner et al, 2012a). Furthermore, we discuss differences between the results of the quality model assessments and our manually interpreted ASA results in RQ 3.1.
Sixth, the quality model aggregates findings in a specific way that may not be suitable for every quality perception. For example, the weighted aggregation of product factors may not take into account relative frequencies of findings. Such a normalisation leads to the effect that a few findings of one measure, normalised by a few related entities, are weighted the same as a large number of findings of another measure, even if the measures themselves have equal weights.
Seventh, we only considered popular free or open source ASA tools in our study. The problems we discussed for RQ 1.1 and in Section 4, in particular the difficulties in rule selection and findings filtering, may have been less severe if we used high-end commercial ASA tools providing additional capabilities and comfort in use. However, we had no budget and time available for obtaining proper licenses. We reduced this threat by additional effort for thorough manual interpretation and reflection of all finding reports.
Eighth, we did not receive all questionnaires for RQ 3.2 from our project partners (3 out of 5). This lack of data could weaken our observation of a mismatch between the assessment of study participants and the quality model. We decided to include the results but made transparent that our interpretation relies on incomplete data.
Finally, in our procedure for bug pattern detection, we left out unimportant rules. This influences both, the quality model and the manual ASA interpretation. The Quamoco tool chain was only provided with the ASA tool results as an input rather than with the original code base to fully rerun these analyses. However, we do not consider this threat as a source of discrepancies in the answers to RQ 3.1.
5.2 External Validity
For an experience report on a technology transfer project, the results are inherently difficult to generalise. We had five SMEs located in Germany and four SOs specified or developed in this region. We restricted our analysis to systems realised in Java and C# and only applied specific analysis tools. Hence, the problems, defects, and perceptions may be particular to this setting.
Nevertheless, we think that most of our experiences are valid for other contexts as well. The SMEs we collaborated with range in size from only several to one hundred employees. The domains they build software for differ strongly. Finally, we used more popular ASA tools that had been used in industrial projects before. However, the restriction to two programming languages has a strong effect. For other languages, there may exist different tools and defects. For instance, with bug pattern detection, Ahsan et al (2009) report that characteristics of bug patterns can be language specific.
6 Related Work
We first discuss the relevance of SMEs in our research domain followed by a survey of applications of single ASA techniques. The chapter closes with related research on quality models.
6.1 Consideration of Software Quality in SMEs
The work at hand enhances previous results published in (Gleirscher et al, 2012) by investigating how quality models help in understanding data gained from static analysis. We focus on applying static quality analysis to leverage SMEs mitigating their risks of defect-related costs. Deviating from our aim, the research community devotes its attention primarily to software process improvement (SPI) in SMEs. Kautz et al (2000) and Pino et al (2008, 2009) report on SPI introduced in many SMEs from the late 90’s till 2006 to assess software processes, change the organisations and increase their software productivity. However, they do not investigate the impact of SPI on software product quality attributes at all. Even the process improvements are often only measured by means of informal and non-objective processes based on SME employees’ perceptions. Pino et al (2008) conclude that SEI CMM(i) and ISO SPICE are difficult to be applied to SMEs.
Kautz (1999) developed and used metrics at three SMEs to evaluate how new practices and tools for configuration and change management were affecting their software processes. Thereafter, the key to successful software measurement is making metrics meaningful and tailoring them to a particular organisation. We confirm this observation for software measurement.
von Wangenheim et al (2006) assessed software processes in SMEs and developed MARES, a set of guidelines for ISO/IEC 15504-conforming software process assessment in small companies. Our usage guidelines may form a bridge between ASA and more general guidelines for software process improvement.
Hofer (2002) states that only 10% of the surveyed SMEs in the Austrian software industry believe to suffer from a lack of methods. He concludes that proper tool support as well as knowledge of methods are available. On the contrary, we argue that SMEs may not be aware of the most effective methods and can therefore not estimate their lack concerning these techniques.
6.2 Application of ASA Techniques in SME Projects
To the best of our knowledge, there is no study on combined automated static analysis in an SME context. However, the following publications propose and investigate single techniques separately and in different application contexts:
Code Clone Detection.
Lague et al (1997) report on application of clone detection to a large telecommunication software system. They restricted the technique to the comparison of whole methods. Opposed to that, we allowed arbitrary code fragments to be compared with each other but analysed smaller systems. Nevertheless, we confirm that clone detection can improve software maintainability. Juergens (2011) performed clone detection in different software artefacts like source code, requirements specifications and models at five enterprises. He presents a large case study investigating the impact of cloning on program correctness, an analytical cost model that quantifies the impact of code cloning on maintenance activities and a comprehensive method for clone control and tool support for practical use.
Bug Pattern Detection.
Ayewah et al (2007) evaluate the accuracy and value of FindBugs and discuss but not solve the problem of properly filtering false positives. They use the term trivial bugs for what we call smells and pedantry. We confirm their conclusions on the usefulness of findings and believe that an application of bug pattern detection has to undergo calibration guided by the staff of a software project. Moreover, by answering RQ 2 with relevant findings of several tools, we contribute to Foster’s, Hicks’ and Pugh’s (2007) question “Are the defects reported by [static analysis] tools important?”
Based on an industrial robot control system ( 2500 kLoC), Kienle et al (2012) encountered drawbacks of generic ASA, i.e. low effectiveness, too many violations or false positives, and lack of result verifiability. They propose ASA to be tailored by system-specific rule selection to reduce false positives and ease violation handling. This includes the analysis of annotations in comments, C macros, coding constraints specific to files or methods (i.e. call structure, control or data flow patterns), and constraints on thread scheduling or shared data usage. Accordingly, Sjøberg et al (2012) report an overrating of many maintainability metrics or predictors—often represented by bug pattern rules—and suggest more sophisticated evaluation of their system-level impacts. For the positive impact on software quality characteristics, they conjecture: Individual rule selection is better than taking generic tool presets. They did not empirically validate this conjecture. But we qualitatively confirm it through our results on RQ 2.1 which also motivated rule selection as a cornerstone of our usage guidelines.
Wagner et al (2008) similarly applied FindBugs and PMD to two industrial projects. They could not find defects reported from the field that are covered by bug pattern detection. However, our results show that this technique could indeed prevent critical defects from staying hidden until after product release.
Architecture Conformance Analysis.
Rosik et al (2008) conducted an industrial case study on architecture conformance with three participating software engineers. They conclude that this technique should be integrated into the software engineering process and applied continuously. We think that the procedure we presented is able to satisfy their needs, because it explicitly focuses on continuous integration. Mattsson et al (2007) illustrate their experience in an industrial project and the huge effort needed to keep the architecture specification in conformance with the implementation. However, they tried to reach this goal in a manual way. Our results show that automation can reduce efforts dramatically. Feilkas et al (2009) analysed three .NET platform projects of Munich Re, a large insurance carrier, in a way similar to our procedure. In addition, they regarded loss of architectural knowledge and its effects. Compared to our results, they report a much higher effort of about five days to apply the technique primarily due to time consuming discussions. We think that the lower effort we are reporting is mainly caused by the fact that we were collaborating with small enterprises with a lower communication overhead.
6.3 Quality Models
To the best of our knowledge, there are no studies on applying quality models in SMEs. Hence, we describe the relation of our study to investigations on quality standards in SMEs and practical applications of quality models.
Pusatli and Misra (2011) reported on a survey with SMEs and their usage of quality standards. They found that quality is often not a prime objective in smaller companies and especially the micro-companies do not even know the standards.
Bansiya and Davis (2002) proposed QMOOD, a quality model based on object-oriented metrics. These metrics are static measures capturing the quality of an object-oriented design. In a validation study, they found a statistically significant correlation between their quality index and expert opinions. They applied a much larger quality model outside an SME context.
Heitlager et al (2007) developed a quality model similar to what we used in our study. Their model includes static maintainability measures. They discussed measurements for real systems but no further validation, especially not in SMEs. Bijlsma et al (2012) applied a maintainability model to analyse open source systems and compared the quality rating with defect resolution times. They found a statistically significant correlation. Again, we used a more detailed quality model in the SME context.
Plösch et al (2010) proposed a method for continuous code quality management using static analysis based on a quality model. They did not prescribe a specific model but they suggested to tailor existing ones. These authors used such a model to get different views on and understand static analysis results. Furthermore, they reported on positive experience inside Siemens, a very large organisation, but neglected the specific situation of SMEs.
Wagner et al (2012a) described the Quamoco model used in our study. They applied it to open source as well as commercial systems where they found a statistically significant correlation between quality ranking and expert opinions. In an extended version, Wagner et al (2013) investigated its acceptance with software developers. The developers perceived the results to be reasonable and helpful for explaining the (static) measures.
In summary, there are only a few studies looking at quality models that link quality characteristics with tangible measures and apply them in a practical setting. The existing studies derived promising correlations between expert opinions and calculated quality evaluations. Studies applying such models to SME projects have been missing so far.
7 Conclusions and Future Work
It is most effective to combine several QA methods to find most of the defects (Littlewood et al, 2000). However, this entails the cost of performing many different techniques. Particularly, SMEs have difficulties in assigning large efforts to diverse techniques and training specialists for them. Automated static analysis techniques promise to be an efficient contribution to software QA, because their repeated application requires only little manual effort.
We reported our experience of applying three static analysis techniques to small enterprises: Code clone detection, bug pattern detection and architecture conformance analysis. We assessed potential barriers for introducing these techniques as well as the observations we could make in a one-year project with five German SMEs.
We found several technical problems, such as multi-language projects with single-language clone analysis and false positives with bug pattern analysis. However, we believe that these are no major road blocks for the adoption of static quality analysis. Overall, the effort for introducing the analyses was small. Two of the techniques and the quality model could be set up with an effort of less than one person-hour. We found various defects, such as high rates of cloning, null pointer access, erroneous calculations or circumvention of architecture layers. In the end, our study participants found all of the presented techniques relevant for inclusion into their quality assurance processes. The use of a quality model enabled us to efficiently gain additional insights but revealed results that differed from the study participants’ opinions.
In our view, static analysis tools combined with quality models can efficiently improve quality assurance in SMEs if the techniques are continuously used throughout the development process and technically well integrated into the tool infrastructure. As our research was not focused on long term observations we can not address continuous use. Hence, it is a promising area of future work to investigate the long-term effects of static quality analysis on SME software projects and the seamless integration of corresponding, automated techniques into agile software development processes. Questions arising from the application of these techniques are ready to be examined, such as their long-term efficiency, their inclusion into an overall QA strategy, their acceptance by developers, their application to non-code development artefacts, or their effects on daily programming.
We are going to continue working in this area to better understand the needs of SMEs and investigate our current findings. In particular, we will use our experiences from this and other studies to continue improving the structure of quality models. For example, Lochmann and Goeb (2011) propose an extension of the Quamoco approach that improves the support of procedural aspects of software quality. In addition, further studies are needed that investigate the application of quality models apart from code quality assessments, for example, to the systematic derivation of software quality requirements (Lochmann, 2010).
Acknowledgements.
We would like to thank Christian Pfaller, Bernhard Schätz and Elmar Jürgens for their technical and organisational support throughout the project. The authors owe sincere gratitude to Klaus Lochmann for his advice and support in issues related to quality models. We thank all involved companies as well as the OpenMRS lead developers for their reproachless collaboration and assistance. Last but not least, we thank Veronika Bauer, Georg Hackenberg, Maximilian Junker and Kornelia Kuhle as well as our anonymous peer reviewers for many helpful remarks.References
- Ahsan et al (2009) Ahsan SN, Ferzund J, Wotawa F (2009) Are there language specific bug patterns? Results obtained from a case study using Mozilla. In: Proc. Fourth International Conference on Software Engineering Advances (ICSEA’09), IEEE Computer Society, pp 210–215
- Al-Kilidar et al (2005) Al-Kilidar H, Cox K, Kitchenham B (2005) The use and usefulness of the ISO/IEC 9126 quality standard. In: Proc. International Symposium on Empirical Software Engineering (ISESE’05), IEEE Computer Society, pp 126–132
- Ayewah et al (2007) Ayewah N, Pugh W, Morgenthaler JD, Penix J, Zhou Y (2007) Evaluating static analysis defect warnings on production software. In: Proc. 7th Workshop on Program Analysis for Software Tools and Engineering (PASTE ’07), ACM Press, pp 1–8, DOI http://doi.acm.org/10.1145/1251535.1251536
- Ayewah et al (2008) Ayewah N, Hovemeyer D, Morgenthaler JD, Penix J, Pugh W (2008) Using static analysis to find bugs. IEEE Software 25:22–9, DOI http://doi.ieeecomputersociety.org/10.1109/MS.2008.130
- Baca et al (2008) Baca D, Carlsson B, Lundberg L (2008) Evaluating the cost reduction of static code analysis for software security. In: Proceedings of the third ACM SIGPLAN workshop on Programming languages and analysis for security, ACM, New York, NY, USA, PLAS ’08, pp 79–88, DOI 10.1145/1375696.1375707, URL http://doi.acm.org/10.1145/1375696.1375707
- Bansiya and Davis (2002) Bansiya J, Davis CG (2002) A hierarchical model for object-oriented design quality assessment. IEEE Transactions on Software Engineering 28(1):4 –17, DOI 10.1109/32.979986
- Beizer (1990) Beizer B (1990) Software Testing Techniques, 2nd edn. Thomson
- Bessey et al (2010) Bessey A, Block K, Chelf B, Chou A, Fulton B, Hallem S, Henri-Gros C, Kamsky A, McPeak S, Engler D (2010) A few billion lines of code later: using static analysis to find bugs in the real world. Commun ACM 53(2):66–75, DOI 10.1145/1646353.1646374, URL http://doi.acm.org/10.1145/1646353.1646374
- Bijlsma et al (2012) Bijlsma D, Ferreira MA, Luijten B, Visser J (2012) Faster issue resolution with higher technical quality of software. Software Quality Journal 20(2):265–285
- Boehm et al (1978) Boehm BW, Brown JR, Kaspar H, Lipow M, Macleod GJ, Merrit MJ (1978) Characteristics of Software Quality. North-Holland
- Boogerd and Moonen (2009) Boogerd C, Moonen L (2009) Evaluating the relation between coding standard violations and faults within and across software versions. In: 6th IEEE Int. Working Conf. Mining Software Repositories (MSR), pp 41 –50, DOI 10.1109/MSR.2009.5069479
- Chandra et al (2006) Chandra P, Chess B, Steven J (2006) Putting the tools to work: how to succeed with source code analysis. Security Privacy, IEEE 4(3):80–3, DOI 10.1109/MSP.2006.77
- Davis (1989) Davis FD (1989) Perceived usefulness, perceived ease of use, and user acceptance of information technology. MIS Quarterly
- Deissenboeck et al (2007) Deissenboeck F, Wagner S, Pizka M, Teuchert S, Girard JF (2007) An activity-based quality model for maintainability. In: Proc. IEEE International Conference on Software Maintenance
- Deissenboeck et al (2009) Deissenboeck F, Juergens E, Lochmann K, Wagner S (2009) Software quality models: Purposes, usage scenarios and requirements. In: Proc. ICSE Workshop on Software Quality
- Deissenboeck et al (2010a) Deissenboeck F, Feilkas M, Heinemann L, Hummel B, Juergens E (2010a) ConQAT Book. Technische Universität München, Institut f r Informatik, Software & Systems Engineering, v2.6 edn, URL http://conqat.cs.tum.edu/index.php/ConQAT
- Deissenboeck et al (2010b) Deissenboeck F, Heinemann L, Hummel B, Juergens E (2010b) Flexible architecture conformance assessment with ConQAT. In: Proc. 32nd ACM/IEEE International Conference on Software Engineering - Volume 2, ACM Press, pp 247–250, DOI http://doi.acm.org/10.1145/1810295.1810343, URL http://doi.acm.org/10.1145/1810295.1810343
- Deissenboeck et al (2011) Deissenboeck F, Heinemann L, Herrmannsdoerfer M, Lochmann K, Wagner S (2011) The Quamoco tool chain for quality modeling and assessment. In: Proc. 33rd International Conference on Software Engineering
- Deissenboeck et al (2012) Deissenboeck F, Heinemann L, Hummel B, Wagner S (2012) Challenges of the dynamic detection of functionally similar code fragments. In: Mens T, Cleve A, Ferenc R (eds) CSMR, IEEE, pp 299–308
- Dromey (1995) Dromey RG (1995) A model for software product quality. IEEE Transactions on Software Engineering 21(2):146–162
- Elva and Leavens (2012) Elva R, Leavens G (2012) Jsctracker: A semantic clone detection tool for java code
- European Commission (2003) European Commission (2003) Commission recommendation of 6 May 2003 concerning the definition of micro, small and medium-sized enterprises. Official Journal of the European Union L 124:36–41
- Feilkas et al (2009) Feilkas M, Ratiu D, Juergens E (2009) The loss of architectural knowledge during system evolution: An industrial case study. In: Proc. IEEE 17th International Conference on Program Comprehension (ICPC’09), IEEE Computer Society, pp 188–197
- Ferzund et al (2008) Ferzund J, Ahsan SN, Wotawa F (2008) Analysing bug prediction capabilities of static code metrics in open source software. In: Proc. International Conferences on Software Process and Product Measurement (IWSM/Metrikon/Mensura ’08), Springer, LNCS, vol 5338, pp 331–343
- Fiutem and Antoniol (1998) Fiutem R, Antoniol G (1998) Identifying design-code inconsistencies in object-oriented software: A case study. In: Proc. International Conference on Software Maintenance (ICSM’98), IEEE Computer Society
- Foster et al (2007) Foster J, Hicks M, Pugh W (2007) Improving software quality with static analysis. In: Proc. 7th ACM SIGPLAN-SIGSOFT Workshop on Program Analysis for Software Tools and Engineering (PASTE’07), ACM Press, pp 83–84
- Gleirscher et al (2012) Gleirscher M, Golubitskiy D, Irlbeck M, Wagner S (2012) On the benefit of automated static analysis for small and medium-sized software enterprises. In: Lecture Notes in Business Information Processing, vol 94, pp 14–38, previously accepted at: 1st Research Track at Software Quality Days, Vienna, 2012
- Heitlager et al (2007) Heitlager I, Kuipers T, Visser J (2007) A practical model for measuring maintainability. In: Proc. 6th International Conference on Quality of Information and Communications Technology
- Hofer (2002) Hofer C (2002) Software development in Austria: Results of an empirical study among small and very small enterprises. In: Proc. 28th Euromicro Conference, IEEE Computer Society, pp 361–366, DOI http://doi.ieeecomputersociety.org/10.1109/EURMIC.2002.1046219
- ISO/IEC 25010 (2011) ISO/IEC 25010 (2011) Systems and software engineering – systems and software quality requirements and evaluation (SQuaRE) – system and software quality models. International standard
- ISO/IEC 9126 (2003) ISO/IEC 9126 (2003) Software engineering – product quality – quality model. International standard
- Juergens (2011) Juergens E (2011) Why and how to control cloning in software artifacts. PhD thesis, Technische Universitaet Muenchen
- Juergens and Göde (2010) Juergens E, Göde N (2010) Achieving accurate clone detection results. In: Proceedings 4th International Workshop on Software Clones, ACM Press, pp 1–8
- Juergens et al (2009a) Juergens E, Deissenboeck F, Hummel B (2009a) CloneDetective – A workbench for clone detection research. In: Proc. 31th International Conference on Software Engineering (ICSE’09), IEEE Computer Society, pp 603–606, DOI http://doi.ieeecomputersociety.org/10.1109/ICSE.2009.5070566
- Juergens et al (2009b) Juergens E, Deissenboeck F, Hummel B, Wagner S (2009b) Do code clones matter? In: Proc. 31th International Conference on Software Engineering (ICSE’09), IEEE Computer Society, pp 485–495
- Kautz (1999) Kautz K (1999) Making sense of measurement for small organizations. IEEE Software 16:14–20
- Kautz et al (2000) Kautz K, Hansen HW, Thaysen K (2000) Applying and adjusting a software process improvement model in practice: the use of the ideal model in a small software enterprise. In: Proceedings of the 22nd international conference on Software engineering, ACM, New York, NY, USA, ICSE ’00, pp 626–633, DOI 10.1145/337180.337492, URL http://doi.acm.org/10.1145/337180.337492
- Kienle et al (2012) Kienle H, Kraft J, Nolte T (2012) System-specific static code analyses: a case study in the complex embedded systems domain. Software Quality Journal 20:337–67, URL http://dx.doi.org/10.1007/s11219-011-9138-7, 10.1007/s11219-011-9138-7
- Kitchenham and Pfleeger (1996) Kitchenham B, Pfleeger SL (1996) Software quality: The elusive target. IEEE Software 13(1)
- Knodel and Popescu (2007) Knodel J, Popescu D (2007) A comparison of static architecture compliance checking approaches. In: Proc. IEEE/IFIP Working Conference on Software Architecture (WICSA’07), IEEE Computer Society, pp 12–12
- Koschke (2007) Koschke R (2007) Survey of research on software clones. In: Duplication, Redundancy, and Similarity in Software, Schloss Dagstuhl, Germany
- Koschke and Simon (2003) Koschke R, Simon D (2003) Hierarchical reflexion models. In: Proc. 10th Working Conference on Reverse Engineering (WCRE’03), IEEE Computer Society, p 368
- Kremenek (2008) Kremenek T (2008) From uncertainty to bugs: Inferring defects in software systems with static analysis, statistical methods, and probabilistic graphical models. PhD thesis, Dept. of Computer Science, Stanford University
- Lague et al (1997) Lague B, Proulx D, Mayrand J, Merlo EM, Hudepohl J (1997) Assessing the benefits of incorporating function clone detection in a development process. In: Proc. International Conference on Software Maintenance (ICSM’97), IEEE Computer Society, pp 314–321
- Lanubile and Mallardo (2003) Lanubile F, Mallardo T (2003) Finding function clones in web applications. In: Proc. 7th European Conference on Software Maintenance and Reengineering (CSMR 2003), IEEE Computer Society, pp 379–388
- Littlewood et al (2000) Littlewood B, Popov PT, Strigini L, Shryane N (2000) Modeling the effects of combining diverse software fault detection techniques. IEEE Transactions on Software Engineering 26:1157–67, DOI 10.1109/32.888629, URL http://portal.acm.org/citation.cfm?id=358134.357482
- Lochmann (2010) Lochmann K (2010) Engineering quality requirements using quality models. In: Proceedings of 15th International Conference on Engineering of Complex Computer Systems (ICECCS’10), IEEE Computer Society, St. Anne’s College, University of Oxford, United Kingdom
- Lochmann (2012) Lochmann K (2012) A benchmarking-inspired approach to determine threshold values for metrics. In: Proc. of the 9th International Workshop on Software Quality (WoSQ’12), ACM, Research Triangle Park, Cary, USA, to appear in November 2012
- Lochmann and Goeb (2011) Lochmann K, Goeb A (2011) A unifying model for software quality. In: Proc. of the 8th International Workshop on Software Quality (WoSQ’11), ACM, Szeged, Hungary
- Mattsson et al (2007) Mattsson A, Lundell B, Lings B, Fitzgerald B (2007) Experiences from representing software architecture in a large industrial project using model driven development. In: Proc. Second Workshop on SHAring and Reusing architectural Knowledge Architecture, Rationale, and Design Intent (SHARK-ADI ’07), IEEE Computer Society, DOI http://dx.doi.org/10.1109/SHARK-ADI.2007.7, URL http://dx.doi.org/10.1109/SHARK-ADI.2007.7
- McCall et al (1977) McCall JA, Richards PK, Walters GF (1977) Factors in Software Quality. National Technical Information Service
- Mishra and Mishra (2006) Mishra A, Mishra D (2006) Software quality assurance models in small and medium organisations: A comparison. International Journal of Information Technology and Management 5(1):4–20
- de Moor et al (2007) de Moor O, Verbaere M, Hajiyev E, Avgustinov P, Ekman T, Ongkingco N, Sereni D, Tibble J (2007) .QL for source code analysis. In: Proc. Seventh IEEE International Working Conference on Source Code Analysis and Manipulation (SCAM 2007), IEEE Computer Society, pp 3–16
- Passos et al (2010) Passos L, Terra R, Valente MT, Diniz R, das Chagas Mendonca N (2010) Static architecture-conformance checking: An illustrative overview. IEEE Software 27:82–9, DOI http://dx.doi.org/10.1109/MS.2009.117, URL http://dx.doi.org/10.1109/MS.2009.117
- Pino et al (2008) Pino FJ, Garcia F, Piattini M (2008) Software process improvement in small and medium software enterprises: a systematic review. Software Quality Journal 16(2):237–61, URL http://dx.doi.org/10.1007/s11219-007-9038-z, 10.1007/s11219-007-9038-z
- Pino et al (2009) Pino FJ, Garcia F, Piattini M (2009) Key processes to start software process improvement in small companies. In: Proceedings of the 2009 ACM symposium on Applied Computing, ACM, New York, NY, USA, SAC ’09, pp 509–516, DOI 10.1145/1529282.1529389, URL http://doi.acm.org/10.1145/1529282.1529389
- Plösch et al (2009) Plösch R, Gruber H, Körner C, Pomberger G, Schiffer S (2009) A proposal for a quality model based on a technical topic classification. In: Tagungsband des 2. Workshops zur Software-Qualitätsmodellierung und -bewertung
- Plösch et al (2010) Plösch R, Gruber H, Körner C, Saft M (2010) A method for continuous code quality management using static analysis. In: Proc. Seventh International Conference on the Quality of Information and Communications Technology (QUATIC), IEEE Computer Society, pp 370–375
- Pusatli and Misra (2011) Pusatli O, Misra S (2011) A discussion on assuring software quality in small and medium software enterprises: An empirical investigation. Technical Gazette 18(3):447–452
- Richardson and Von Wangenheim (2007) Richardson I, Von Wangenheim C (2007) Guest editors’ introduction: Why are small software organizations different? IEEE Software 24(1):18–22, DOI 10.1109/MS.2007.12, URL http://ieeexplore.ieee.org/lpdocs/epic03/wrapper.htm?arnumber=4052546
- Rosik et al (2008) Rosik J, Le Gear A, Buckley J, Babar M (2008) An industrial case study of architecture conformance. In: Proc. 2nd ACM-IEEE International Symposium on Empirical Software Engineering and Measurement (ESEM ’08), ACM Press, pp 80–89
- Roy and Cordy (2007) Roy CK, Cordy JR (2007) A survey on software clone detection research. Tech. rep., Queen’s University at Kingston
- Ruthruff et al (2008) Ruthruff JR, Penix J, Morgenthaler JD, Elbaum S, Rothermel G (2008) Predicting accurate and actionable static analysis warnings: an experimental approach. In: Proceedings of the 30th international conference on Software engineering, ACM, New York, NY, USA, ICSE ’08, pp 341–350, DOI 10.1145/1368088.1368135, URL http://doi.acm.org/10.1145/1368088.1368135
- Sangal et al (2005) Sangal N, Jordan E, Sinha V, Jackson D (2005) Using dependency models to manage complex software architecture. In: Proc. 20th annual ACM SIGPLAN Conference on Object-oriented Programming, Systems, Languages, and Applications (OOPSLA ’05), ACM Press, pp 167–176, DOI http://doi.acm.org/10.1145/1094811.1094824, URL http://doi.acm.org/10.1145/1094811.1094824
- Sjøberg et al (2012) Sjøberg DIK, Anda B, Mockus A (2012) Questioning software maintenance metrics: a comparative case study. In: Runeson P, Höst M, Mendes E, Andrews AA, Harrison R (eds) ESEM, ACM, pp 107–110
- Wagner (2008) Wagner S (2008) Defect classification and defect types revisited. In: Proc. 2008 Workshop on Defects in Large Software Systems (DEFECTS 2008), ACM Press, pp 39–40
- Wagner et al (2005) Wagner S, Juerjens J, Koller C, Trischberger P (2005) Comparing bug finding tools with reviews and tests. In: Proc. 17th International Conference on Testing of Communicating Systems (TestCom ’05), LNCS, vol 3502, pp 40–55
- Wagner et al (2008) Wagner S, Deissenboeck F, Aichner M, Wimmer J, Schwalb M (2008) An evaluation of two bug pattern tools for java. In: Proc. First International Conference on Software Testing, Verification, and Validation (ICST 2008), IEEE Computer Society, pp 248–257
- Wagner et al (2009) Wagner S, Lochmann K, Winter S, Goeb A, Klaes M (2009) Quality models in practice: A preliminary analysis. In: Proc. 3rd International Symposium on Empirical Software Engineering and Measurement, DOI 10.1109/ESEM.2009.5316003
- Wagner et al (2012a) Wagner S, Lochmann K, Heinemann L, Kläs M, Trendowicz A, Plösch R, Seidl A, Goeb A, Streit J (2012a) The Quamoco product quality modelling and assessment approach. In: Proc. 34th International Conference on Software Engineering
- Wagner et al (2012b) Wagner S, Lochmann K, Winter S, Goeb A, Kläs M, Nunnenmacher S (2012b) Software quality models in practice. Technical Report TUM-I129, Technische Universität München, Institut für Informatik
- Wagner et al (2013) Wagner S, Lochmann K, Heinemann L, Kläs M, Lampasona C, Trendowicz A, Plösch R, Mayr A, Seidl A, Goeb A, Streit J (2013) Practical product quality modelling and assessment: The Quamoco approach. Submitted manuscript
- von Wangenheim et al (2006) von Wangenheim CG, Anacleto A, Salviano CF (2006) Helping small companies assess software processes. IEEE Software 23:91–8
- Zheng et al (2006) Zheng J, Williams L, Nagappan N, Snipes W, Hudepohl JP, Vouk MA (2006) On the value of static analysis for fault detection in software. IEEE Transactions on Software Engineering 32:240–253, DOI http://doi.ieeecomputersociety.org/10.1109/TSE.2006.38
Appendix A Results of the two Questionnaires and the Quality Model
| Question | Closed Answers (without comments) | ||||||||||||||||||||||||||||||||
|---|---|---|---|---|---|---|---|---|---|---|---|---|---|---|---|---|---|---|---|---|---|---|---|---|---|---|---|---|---|---|---|---|---|
| Q1) Which of these static analysis techniques have you already been using in your projects? |
|
||||||||||||||||||||||||||||||||
| Q2) What is your estimate of the experience of your company in these techniques? |
|
||||||||||||||||||||||||||||||||
| Q3) How do you perceive the relevance of our analysis results for your study object? |
|
||||||||||||||||||||||||||||||||
| Q4) How much education could you gain from the topics of our research project? |
|
||||||||||||||||||||||||||||||||
| Q5) Which of the following analysis techniques do you plan to apply at which level of priority? |
|
||||||||||||||||||||||||||||||||
| *) application of the technique is planned | |||||||||||||||||||||||||||||||||
translated from German to English). Legend: ++ .. very high, + .. high, o .. medium, – .. low, - - .. very low
Comments and Open Answers Q1) Architecture conformance analysis has not been used because …
-
•
SS2: “projects have been developed cleanly or without [need of] architecture.”
-
•
SS1: “manual inspection was carried through.”
-
•
SS5: “the prerequisites …would have needed to be established for our projects. Manual inspection (code reviews) already takes place irregularly.”
-
•
SS3: “it was not known to us.”
Code clone detection has not been used because …
-
•
SS2: “[clones were] not known to us as a problem.”
-
•
SS3: “we did not recognise its necessity.”
Q3) The results have been relevant because …
-
•
SS1: “manual [code] analysis is significantly more cost-intensive, …clone detection is only feasible with tool support.”
-
•
SS5: “we learned about concepts, experiences and tools …it is easier to become acquainted with [a project if its architecture conforms to its documented specification].”
-
•
SS4: “Clones are necessary within short development cycles.”
Q5) SS4: “The results of this research project shall be included into our internal development process.” SS5: “…bug pattern tools are important for early defect detection, architecture conformance and clone detection for structuring the projects.”
Q6) Your estimate of the current status of your organisation w.r.t. software quality:
Strengths: “Seamless process for requirements QA …regarded design guidelines for all languages used (SS1) …flexible adaptation of guidelines to customer needs (SS1) …performed QA provisions (from unit testing to selective pair programming) seem to work (SS5) …so far we only experienced high customer satisfaction (SS5) …mature in testing techniques and management (SS3).”
Weaknesses: “No consequent QA provisions (SS2) …no systematic QA (SS2) …automation and tool usage either project specific or even left out (SS1) …still learning to apply the tools (SS3).”
Q7) Where do you expect the highest potential of your organisation to improve its software quality?
-
•
SS2: “Consequent QA provisions,”
-
•
SS1: “integrated tools and more automation …QA dashboard for project managers,”
-
•
SS5: “better knowledge transfer between teams and projects,”
-
•
SS4: “improved quality control …backflow of QA results into development process.”
Q8) Your estimate of the usefulness of static analysis for your software projects:
Positive: SS2: “Important”, SS3: “high”, SS5: “trend analyses are important”, SS5: “very important, because of early and efficient defect detection …help identify structural deficits …ease [code] maintenance”, SS4: “quality improvement starting with first build”, SS1: “for internal projects better control and indication of deficits.”
Negative: SS1: “Often not feasible in projects externally conducted at the customer’s site.”
|
Most Affected Quality Characteristics
as graded by Quamoco quality model |
Impression and Justification
based on noticeable results from RQ 2.1 |
Observation |
|---|---|---|
| SO 1 | ||
| Security (2.42) influenced by (BP) avoid long parameter list | (BP) visible constants, constructor calls overwritable method; (AC) critical violations | Different rules and AC, similar impression |
| Maintainability (6.0) influenced by (BP) avoid ref and out parameters, avoid message chain, avoid properties without get accessor, avoid unneeded calls on string, avoid unnecessary specialisation, avoid long parameter list, avoid redundancy in method name; (ConQAT) overly long file, clone coverage | (BP) empty/general exception handlers, nested use of generic types, deep namespaces; (ConQAT) block depth; (CD) normal clone coverage; (AC) critical violations | Different rules, QM provides more severe impression than tools directly |
| Performance Efficiency (2.11) influenced by (BP) avoid unneeded calls on string | RQ 2.1 offered no relevant findings for this | QM provides new impression |
| SO 2 | ||
| Performance Efficiency (1.84) influenced by (BP) improper use of “synchronized” | RQ 2.1 offered no indication to evaluate this | QM provides new impression |
| Maintainability (2.7) influenced by (BP) improper use of “synchronized”, unnecessary specialisation; (ConQAT) long file, duplication | (BP) empty/general exception handlers, nested use of generic types, deep namespaces; (ConQAT) nested block depth; (CD) bad clone coverage | Different rules, QM provides similar impression than tools directly |
| SO 3 | ||
| Functional Suitability (2.4) influenced by (BP) covariant compare method, static date format, field is mutable hash table, superclass uses subclass during init, unused field | (BP) constructor calls overwritable method, corrupted serialisable, return values not validated | Different rules, QM provides similar impression than tools directly |
| Maintainability (4.76) influenced by (ConQAT) missing comments; (FindBugs) superclass uses subclass during init, public hashtable declared as constant, field is mutable hash table, use of unhashable class, bad casts, mutable hash table, reference to mutable object, covariant compare method, superclass names; (CD) duplication | (BP) unused local variables, empty method in abstract class, cyclomatic complexity; (ConQAT) nested block depth; (CD) normal clone coverage | Different rules, QM provides a similar impression less dependent on frequency of findings |
| Performance Efficiency (2.6) influenced by (BP) unused field, string concatenation, redundant null check, unused local variable | (BP) inefficient string manipulation | More rules in QM, but similar impression |
| SO 4 | ||
| Performance Efficiency (2.12) influenced by (BP) unused Field, redundant null check, uncalled method, unused local variable | (AC) critical violations | RQ 2.1 suggests less severe impression due to ignored rules but regards AC |
| Maintainability (4.4) influenced by (ConQAT) improper comments, clone coverage; (BP) field should be package protected, reference to mutable, questionable cast, duplicate branches, default case missing | (BP) extensive class/method size or parameter count or too many fields, cyclomatic complexity; (ConQAT) nested block depth; (CD) extreme clone rate; (AC) critical violations | Different rules, RQ 2.1 suggests less severe impression but regards AC |
| SO 5 | ||
| Functional Suitability (4.8) influenced by (BP) improper null parameter, return value ignored, bitwise OR of signed byte, no suitable constructor, bad field store, call to static date format, useless substring, redundant null check, useless control flow | (BP) access of a null pointer, integer shift beyond 32 bits; (CD) normal clone rate | QM provides much more arguments than RQ 2.1 |
| Performance Efficiency (4.95) influenced by (BP) improper use of removeAll, useless substring, known null value, use of inefficient iterator, unneeded boxing of value, local double assignment, redundant null check, useless control flow, useless garbage collection, unused local variable | RQ 2.1 summarised no indication to evaluate this | QM provides new impression |
| Maintainability (6) influenced by (ConQAT) improper comments, duplication; (BP) synchronisation on boolean, improper use of exceptions, thread started by run, mutable object as constant, field should be package protected, mutable hash table, exposure of internals, bitwise OR of signed byte, initialisation circularity, use of inefficient iterator, call to static date format, inconsistent synchronisation, questionable cast, improper use of removeAll, duplicate branches, useless substring, known null value, redundant null check, useless control flow, improper reference to mutable, unrelated types, default case missing | (BP) extensive class/method size or parameter count or too many fields, cyclomatic complexity, empty method in abstract class; (ConQAT) nested block depth; (CD) normal clone rates | QM provides more arguments than RQ 2.1 to conclude a similarly severe grade |
| Quality Characteristic | SO 1 | SO 2 | SO 3 | SO 4 | SO 5 |
|---|---|---|---|---|---|
| Overall Quality | [2.6-3.0] | [1.3-1.7] | [2.4-2.6] | [1.9-2.1] | [4.4-4.6] |
| Functional Suitability | [1.6-2.2] | [1.0-1.5] | [2.3-2.5] | [1.7-1.9] | [4.7-4.9] |
| Performance Efficiency | [1.8-2.5] | [1.5-2.2] | [2.4-2.9] | [1.9-2.4] | [4.7-5.2] |
| Reliability | 1.6 | 1.1 | 2.0 | 1.2 | 4.6 |
| Maintainability | 6.0 | [2.2-3.2] | [4.5-5.0] | [4.2-4.6] | 6.0 |
| Analysability | 6.0 | [3.2-5.0] | [4.0-5.1] | [5.0-6.0] | 6.0 |
| Reusability | 1.0 | 1.0 | 4.7 | 1.0 | 2.4 |
| Modifiability | 6.0 | 2.7 | 5.7 | 6.0 | 6.0 |
| Testability | 6.0 | [1.0-2.8] | [3.7-4.1] | [1.0-1.5] | [1.7-2.1] |
| Security | 2.4 | 1.0 | 1.7 | 1.4 | 3.0 |
| Portability | 1.0 | 1.0 | 1.0 | 1.0 | 1.5 |
| Characteristics | Study object 1 | Study object 3 | Study object 5 | |||
|---|---|---|---|---|---|---|
| Estim. | Conf. | Estim. | Conf. | Estim. | Conf. | |
| Functional Suitability | 6 | 6 | 6 | 4 | 6 | 6 |
| Performance Efficiency | 5 | 6 | 5 | 5 | 5 | 5 |
| Reliability | 5 | 5 | 6 | 7 | 6 | 6 |
| Maintainability | 4 | 5 | 5 | 7 | 5 | 5 |
| Analysability | 4 | 5 | 5 | 7 | 5 | 5 |
| Modifiability | 3 | 5 | 5 | 6 | 4 | 5 |
| Reusability | 3 | 5 | 6 | 7 | 4 | 5 |
| Testability | 4 | 5 | 3 | 5 | 5 | 6 |
| Security | 6 | 6 | 7 | 7 | 5 | 5 |
| Portability | 4 | 2 | 7 | 6 | 6 | 6 |