Separation of and events using SND detector calorimeter.
Abstract
The technique of discrimination of the and events in energy range GeV by energy deposition in the calorimeter of SND detector was developed by applying machine learning method. Identification efficiency for and events in the range from 99.3 to 99.8 % has been achived.
keywords:
annihilation, particle identification, calorimeter1 Introduction
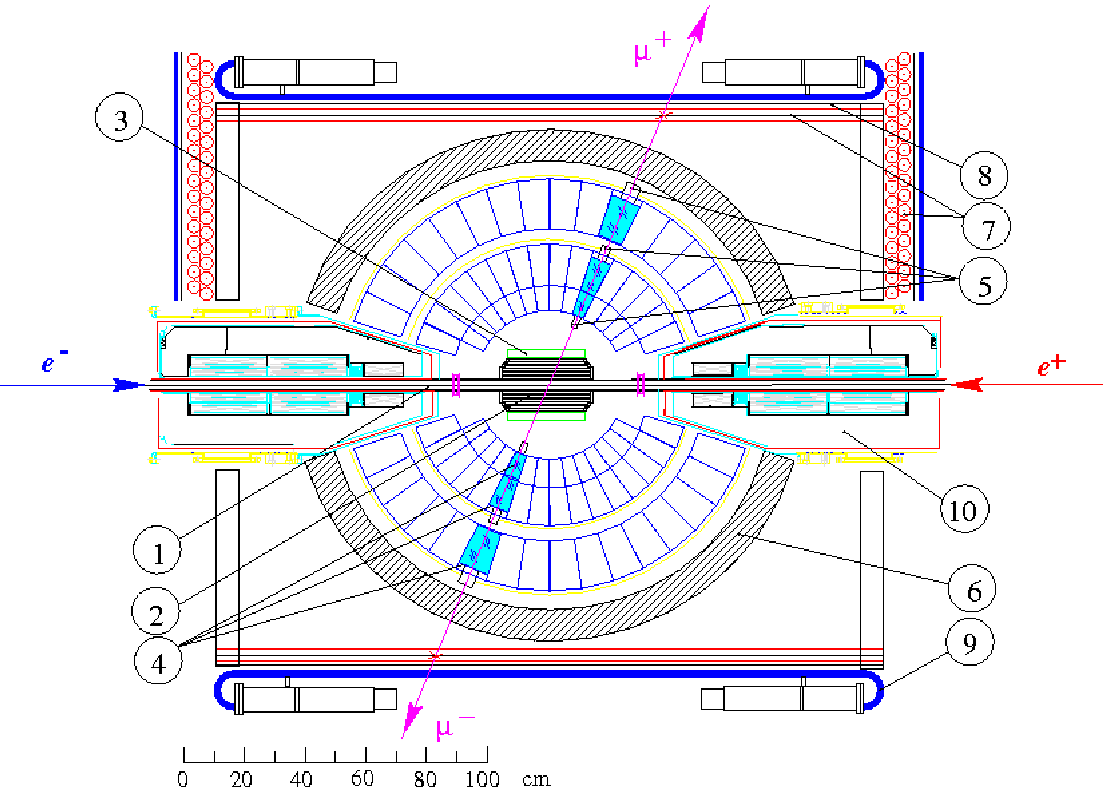
The spherical neutral detector SND [1] (Fig.1) is a general purpose nonmagnetic detector operating at VEPP-2000 collider in the center-of-mass energy range from 0.2 to 2.0 GeV [2]. Experimental studies include measurement of the cross sections of the annihilation to hadrons. These measurements are largely motivated by the need of high-precision calculation of the hadronic contribution to the anomalous magnetic moment of the muon [3]. In particular, the cross section at the energy region below 1 GeV gives the dominant contribution to this value and should be measured with accuracy higher than 1% [4].
The cross section of the process is measured in the following way. The collinear events are selected. The selected events are divided into two classes: and . The events of the process are subtracted according to the theoretical cross section, integrated luminosity and detection efficiency. The cross section of the process is obtained as follows [5].
| (1) |
Here is radiative correction, and are the events numbers and detection efficiencies of the processes and respectively, is cross section of the process.
The , and events differ by the energy deposition in the calorimeter. In events the electrons produce the electromagnetic shower with the most probable energy losses of about 92% of the initial particle energy. Muons lose their energy by ionization of the calorimeter material through which they pass. The similar ionization losses as well as nuclear interactions with the calorimeter material are experienced by charged pions. The separation parameter of and events with the energy 0.5 – 1.0 GeV based on these differences has been developed.
2 The SND calorimeter
SND detector [1] consists of the tracking system based on cilindrical drift and proportional chambers placed in a common gas volume, aerogel threshold counters [6], calorimeter and muon system based on proportional tubes and plastic scintillator. The solid angle of the tracking system is 94% of and the resolutions in the azimuth and polar angles 0.45∘ and 0.8∘, respectively. The threshold Cherenkov counters are based on aerogel with refractive index 1.05. The threshold momentums for are approximately equal to 1.6 / 330 / 436 MeV/c, respectively. The solid angle of the system is about 60% of .
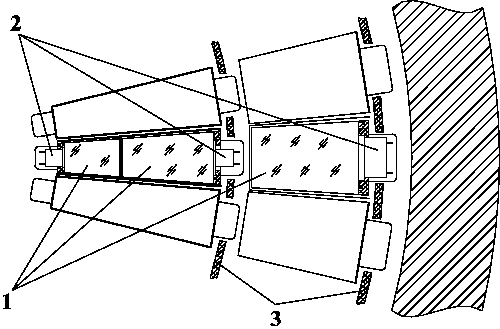
The main part of SND is three-layer spherical electromagnetic calorimeter based on NaI(Tl) crystals [1]. Pairs of counters of the two inner layers with thickness of 2.9 and 4.8 ( cm) are sealed in thin (0.1 mm) aluminum containers, fixed to an aluminum supporting hemisphere (Fig. 2). Behind it, the third layer of NaI(Tl) crystals, 5.7 thick, is placed. The total calorimeter thickness for particles originating from the interaction region is 34.7 cm (13.4 ) of NaI(Tl). The total number of counters is 1632, the number of crystals per layer varies from 520 to 560. The angular dimensions of the most of crystals are , the total solid angle is of .
The scintillation light signals from the crystals are detected by vacuum phototriodes with an average photocathode quantum efficiency of about and the mean tube gain of about 10. The electronics of the calorimeter consists of the charge sensitive preamplifiers with a conversion coefficient of 0.7 V/pC, shaping amplifiers and 12-bit analog to digital converter with a maximum input signal V.
3 Separation parameter
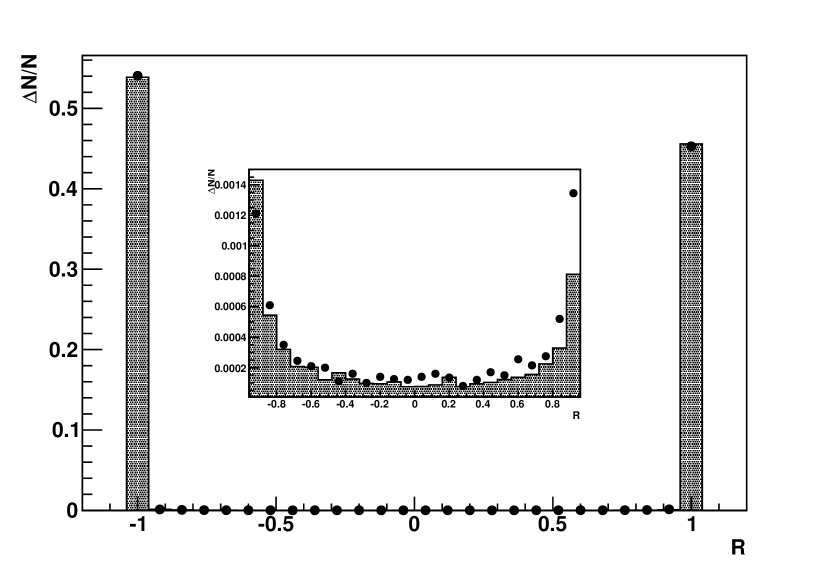
The discrimination between electrons and pions in the SND calorimeter is based on the difference in the energy deposition profiles for these particles. The energy depositions in the layers of the calorimeter towers, that form the cluster related to the particle are used. Here the tower is the three counters of the 1, 2 and 3 layers with the same and coordinates. In particular the following parameters are used: is the energy deposition in th layer of the tower with the maximal energy deposition, is the sum of energy depositions in th layer of eight towers that surround the tower with the maximal energy deposition, is the sum of energy depositions in th layer of the other towers of the cluster ().
In order to use the correlations between energy depositions in the calorimeter layers in the most complete way, the corresponding separation parameter was based on the machine learning approach. For each energy point the boosted decision trees network (forest) has been constructed [7]. The forest includes 900 trees, the maximal depth of a tree is 9. The 18 energy depositions and the average polar angle of the particles have been used as the discrimination variables. Here subscripts 1 and 2 denote the numbers of the particles. The training ensemble consists of simulated and events, that have passed the following cuts.
-
1.
. The events can contain neutral particles due to nuclear interactions of charged pions with detector material or due to electromagnetic showers splitting.
-
2.
and , where is the particle azimuthal angle.
-
3.
MeV, where is the th particle () energy deposition.
-
4.
.
-
5.
The muon system .
The output signal of the trained network (separation parameter) is a value in the interval from -1.0 to 1.0 (Fig.3). The events are located in the region , while events in .
4 Identification efficiency
Identification efficiencies
| (2) |
| (3) |
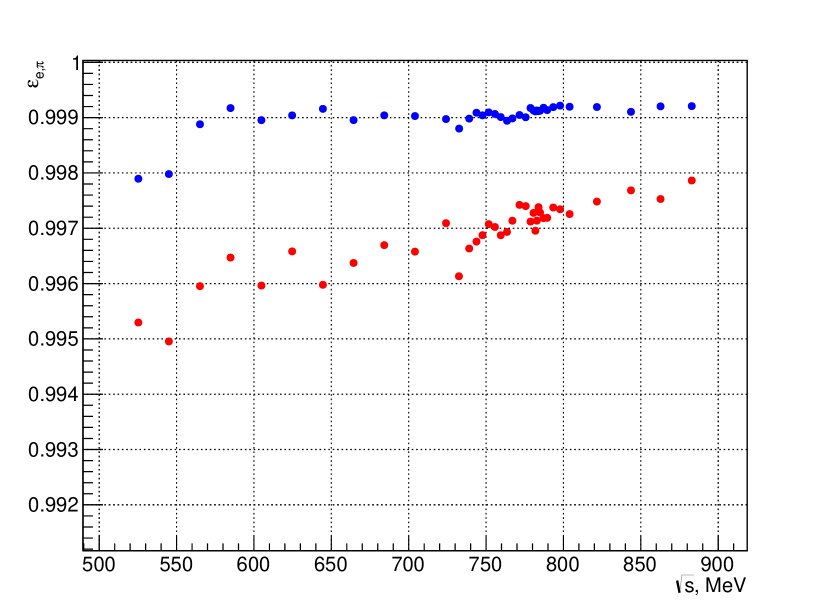
of the processes and obtained using simulated events are shown in Fig.4. Here are the numbers of events of and processes in case if belongs to the interval . The efficiencies (Fig.4) exhibit not a statistical spread from point to point. This can be explained by the fact, that the number of the broken calorimeter channels are not coincident at different energy points.
Uncertainties in simulation of energy depositions in the calorimeter layers, in particular, simulation of pions nuclear interactions, leads to an inaccuracy in identification efficiencies. In order to estimate the systematic uncertainty of discrimination, the pseudo- and pseudo- events in the experiment and simulation have been formed in the following way.
The pseudo- event has been constructed from the particles of two separate collinear events demanding that their partners in these events look like electrons (have and aerogel counter has been fired by both charged particles). Analogously, pseudo- event has been constructed using events in which the aerogel counter hasn’t been fired and . Here is separation parameter based on the energy depositions of a single particle of the event. Identification efficiencies for simulated real and pseudoevents differes by 0.02% for and 0.01% for events.
The experimental pseudo- events contain small admixture of , , , , events. Due to this background, identification efficiency for experimental pseudo- events is changed less then by in the whole energy region 0.5 – 1.0 GeV. In case of experimental pseudo- events, efficiency is changing less than by for the energy GeV, and below it changes up to 0.009 at the energy 0.5 GeV. The pseudo- events with neglectable background contribution and higher statistics for the low energy region from 0.6 to 0.5 GeV have been constructed by using pions from the reaction. In order to construct the pseudo event with the pions with the energy , two charged pions with energies such that MeV have been used from two separate events. The events collected at the peaks of and mesons were used. The pions energies have been obtained by using kinematic fit, which was performed under the following constraints: the charged particles are assumed to be pions, the system has zero total momentum, the total energy is , and the photons originate from the decays. The difference between identification efficiencies of simulated and simulated pseudo- events of this type is 0.02%.
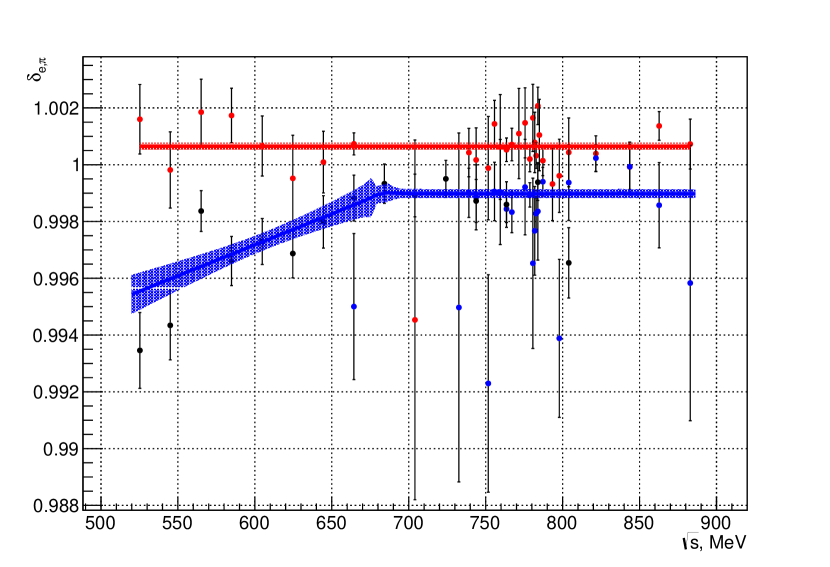
Using pseudoevents the correction coefficients for identification efficiencies of a real and events has been obtained as follows
| (4) |
where , and are identification efficienties for experimental and simulated pseudoevents respectively. The energy dependencies of the correction coefficients are shown in Fig.5. The coefficient does not depend on energy, its average value is equal to . The values of correction coefficients obtained using pseudo events constructed from and events are in agreement within their statistical errors. Their energy dependence was fitted by the function
| (5) |
It was obtained that at the energy region above 0.65 GeV and below changes upto at GeV (Fig.5).
| Error | Contribution to , % | Contribution to | Contribution to |
|---|---|---|---|
| at GeV, % | at GeV, % | ||
| 0.01 | 0.02 | 0.02 – 0.06 | |
| 0.02 | 0.01 | 0.02 | |
| 0.02 | 0.02 | – | |
| 0.03 | 0.03 | 0.03 – 0.06 |
The total error of the correction coefficient determination is
| (6) |
Here is the statistical error, is the difference in identification efficiency for real and pseudoevents, is the change of identification efficiency for experimental pseudoevents due to background admixture. The magnitudes for various contributions to the total error are shown in table 1. The total relative error of is % and of is % at GeV and 0.03 – 0.06 % at GeV.
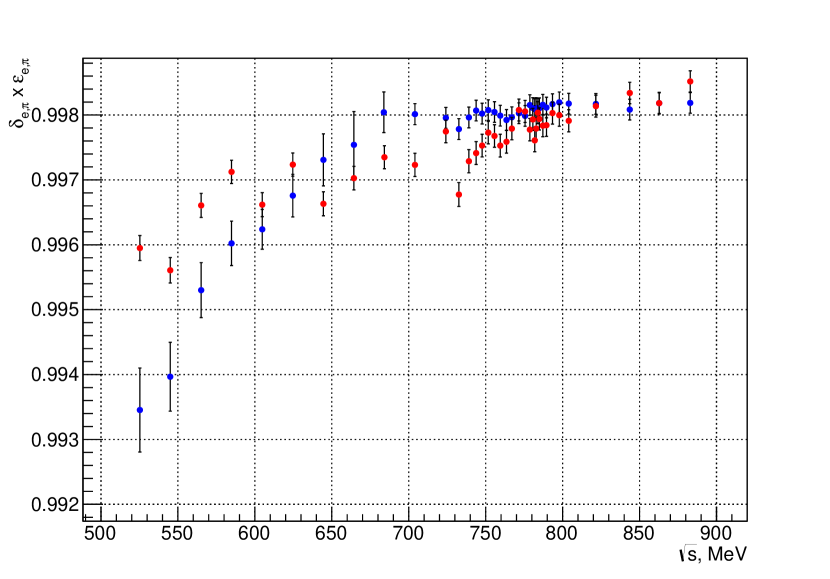
The corrected identification efficiencies of processes and are shown in Fig.6. Their errors are dominated by the errors of the correction coefficients. Contribution of the identification efficiencies errors to the total relative error of cross section (1) is shown in Fig.7 and is less than 0.2% for the most energy points.
5 Conclusion
The technique of discrimination of the and events using energy deposition in the calorimeter of SND detector has been developed. Identification efficiency for and events has been obtained. Contribution of the identification efficiencies errors to the total error of cross section is less than 0.2% for the most energy points.
Acknowledgements.
This work was supported in part by the RFBR grants 14-02-00129-a and 16-32-00542-mol-a, part of this work related to recunstruction of clusters in calorimeter was supported by Russian Science Foundation (project N 14-50-00080).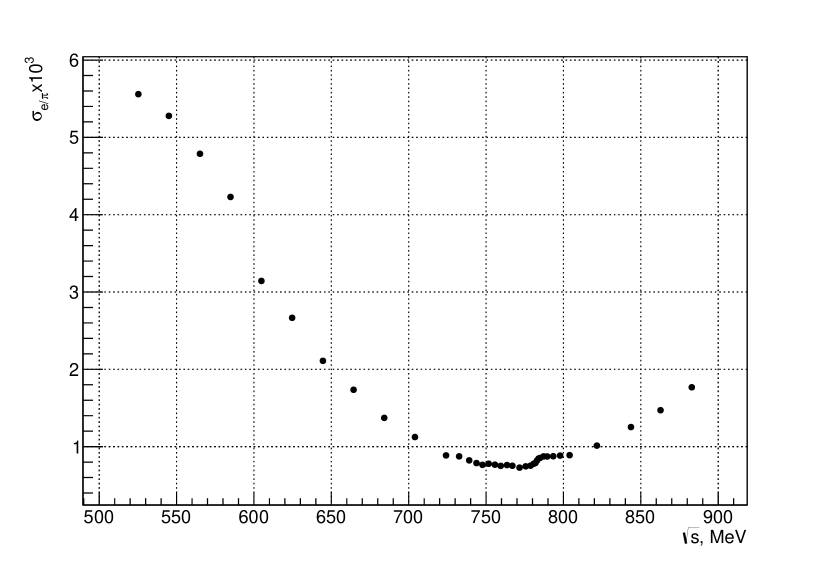
References
-
[1]
M.N.Achasov et al.,
Spherical neutral detector for VEPP-2M collider,
Nucl. Instr. Meth. A 449 (2000) 125
M.N. Achasov, et. al., Spherical Neutral Detector for experiments at VEPP-2000 collider, in proceedings of International Workshop on ee collisions from Phi to Psi, September 19 – 22, 2011 Novosibirsk, Russia, Nucl. Phys. Proc. Suppl. 225-227 (2012) 66 -
[2]
D.E. Berkaev et al.,
Electron-positron collider VEPP-2000. First experiments,
Zh. Eksp. Teor. Fiz. 140 (2011) 247;
E.V. Abakumova et al., A system of beam energy measurement based on the Compton backscattered laser photons for the VEPP-2000 electron-positron collider, Nucl. Instr. Meth. A 755 (2014) 35;
E.V. Abakumova et al., The system for delivery of IR laser radiaton into high vacuum, JINST 10 (2015) T09001. - [3] I. Logashenko, et. al., The Measurement of the Anomalous Magnetic Moment of the Muon at Fermilab, J. Phys. Chem. Ref. Data 44 (2015) 031211
- [4] I.B. Logashenko, et al., Measurement of the hadronic cross sections at Novosibirsk, in proceedings of International Conference Dark Matter, Hadron Physics and Fusion Physics, September 24 – 26, 2014 Messina, Italy, EPJ Web Conf. 96 (2015) 01022
-
[5]
R. R. Akhmetshin, et. al.,
Measurement of cross-section with CMD-2 around
-meson,
Phys. Lett. B 527 (2002) 161;
M. N. Achasov, et. al., Study of the process in the energy region 400¡¡1000 MeV, Zh.Eksp.Teor.Fiz. 128 (2005) 1201 [J.Exp.Theor.Phys. 101 (2005) 1053];
R. R. Akhmetshin, et. al., High-statistics measurement of the pion form factor in the -meson energy range with the CMD-2 detector, Phys. Lett. B 527 (2007) 28. - [6] A.Yu. Barnyakov, et. al., Testing aerogel Cherenkov counters with n = 1.05 using electrons and muons, Prib.Tekh.Eksp. 1 (2015) 37 [Instrum.Exp.Tech. 58 (2015) 30]
- [7] A. Hoecker, et.al., TMVA - Toolkit for Multivariate Data Analysis, in proceedings of 11th International Workshop on Advanced Computing and Analysis Techniques in Physics Research, April 23 – 27, 2007 Amsterdam, The Netherlands, PoS ACAT2007 (2007) 040 [physics/0703039].