∎
Tel.: 740.587.8661
Fax: 740.587.6240
22email: steven.olmschenk@denison.edu
Laser ablation production of Ba, Ca, Dy, Er, La, Lu, and Yb ions
Abstract
We use a pulsed nitrogen laser to produce atomic ions by laser ablation, measuring the relative ion yield for several elements, including some that have only recently been proposed for use in cold trapped ion experiments. For barium, we monitor the ion yield as a function of the number of applied ablation pulses for different substrates. We also investigate the ion production as a function of the pulse energy, and the efficiency of loading an ion trap as a function of radiofrequency voltage.
Keywords:
laser ablation ion trap1 Introduction
Trapped atomic ions are used in a range of experiments and applications, including atomic clocks ludlow:optical_atomic_clocks , cold chemistry harter:cold_atom-ion_expts , precision measurements of fundamental physics karr:precision_measurements_ions ; orzel:amo_new_physics , and quantum information monroe:scaling_ion_trap_qip . The long-term goals of these experiments have led to efforts to miniaturize the system to meet application specifications and scalability schwindt:miniaturized_ion_clock , and in some cases aims for cryogenic ion trap systems demotte:expt_design_ion_squid ; brandl:cryogenic_setup_ion_qc . Efforts using unconventional or multiple ion species put additional demands on the system. These directions may require different methods for initial loading of the ion trap.
The standard method for loading an ion trap consists of producing a flux of neutral atoms, and then ionizing these atoms within the trapping volume. A neutral flux of atoms is commonly produced by resistively heating a sample, and these atoms are then ionized at the trap using either electron bombardment dehmelt:iontrap or photoionization kjaergaard:photoionization_mg_ca ; gulde:photoionization_calcium ; lucas:photoionization_calcium ; tanaka:photoionization_rare_calcium ; deslauriers:photoionization ; brownnutt:photoionization_strontium ; steele:photoionization_barium ; wang:photoionization_barium_led ; johanning:photoionization_ytterbium ; leschhorn:photoionization_barium . While electron bombardment is applicable to any atomic species, it can reduce the lifetime of the trapped ions by contaminating the vacuum, and the accumulation of charge on insulators can result in additional micromotion or even destabilize the trap. Although photoionization can avoid the issues related to electron bombardment, there can be significant overhead associated with the additional lasers, which can become substantial when working with multiple elements, atoms requiring unconventional wavelengths, or multiply-charged ions. Finally, producing neutral atom flux with a standard resistively-heated source can be difficult when working with elements that aggressively react in air devoe:ba_heating ; graham:barium_surface_trap , refractory elements that require high temperatures, or where miniaturization or cryogenic designs may prohibit the use of these sources. Given the limitations of standard loading procedures, other methods for loading ion traps are being actively pursued cetina:mot_loading_ion_trap ; sage:mot_loading_ion_trap .
Laser ablation of a sample offers an alternative method for loading ion traps. In general, a laser pulse with sufficient peak fluence incident on a sample can vaporize a fraction of the material, producing atoms, ions, molecules, and clusters russo:laser_ablation ; willmott:pulsed_laser_deposition . Thus, for ion trap experiments ablation can be used as a source of neutral atom flux hendricks:ablation ; sheridan:all_optical_ion_trap_loading , or can directly produce ions knight:ablation ; gill:laser_ablation_ion_trap_ms ; matsuo:ablation ; gill:resonant_laser_ablation ; hashimoto:ablation ; leibrandt:ablation ; kwapien:ablation ; schmitz:laser_ablation_ion_trap_atmosphere ; zimmermann:ablation_loading , including multiply-charged species kwong:ablation ; campbell:thorium_crystals . In reference zimmermann:ablation_loading , Zimmermann et al. demonstrated the use of a compact nitrogen laser for producing ions by laser ablation, including some multiply-charged species. Here we use a similar setup to measure the ion yield from several elements, including lanthanum, erbium, and dysprosium, which have only recently been proposed for use in cold trapped ion experiments olmschenk:lanthanum_proposal ; lepers:rare-earth_ion_cooling . We then focus on barium ion production, investigating the ion yield for different samples as a function of the number of ablation pulses applied, the ion yield as a function of the pulse energy, and the efficiency of loading an ion trap as a function of radiofrequency voltage.
2 Ion Production in a TOF Mass Spectrometer
Ions are produced by laser ablation of a sample with pulses from a commercial nitrogen laser (Stanford Research Systems, NL100). The pulses from this laser are specified by the manufacturer to have a wavelength of about 337 nm, maximum energy of about 170 J, duration of about 3.5 ns, and repetition rates up to 20 Hz. To increase the laser fluence for ablation, the pulses are focused onto the sample using a pair of lenses (L1 and L2), as shown in Fig. 1. We measure the resulting spot size by attenuating the pulses, temporarily removing the mirror (M1), and placing a camera (Point Grey, FL3-U3-13S2M-CS) at the laser focus. Pulsing the laser near its maximum repetition rate allows us to image and measure the spot size, resulting in elliptical beam waists of approximately 280 m and 50 m gaussian_beam_note . When incident on the ablation target, we estimate the focal point to be within 1 mm of the sample, optimized by adjusting the position of the lenses to maximize the ion yield. A beam sampler (BS) directs a fraction of each pulse to a photodiode (PD) to trigger the oscilloscope for data acquisition. A mirror (M1) in a piezo-actuated mount (Newport, AG-M100N) can be used to sweep the pulses in each run through a location grid on the sample, but in practice this was found to be unnecessary for most samples. In all cases, pulses are incident approximately normal to the sample.
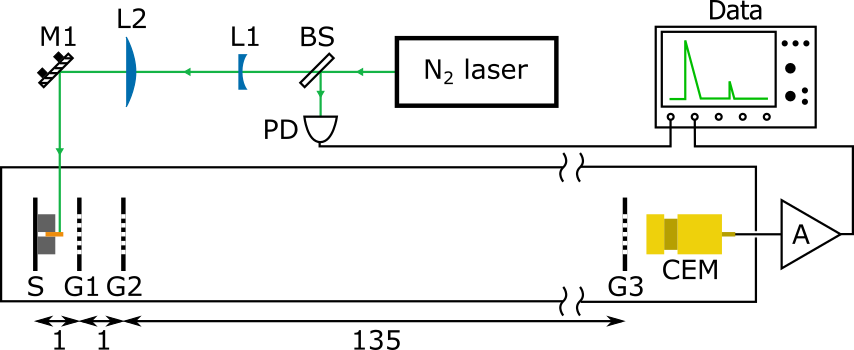
We analyze the ions produced by ablation using a custom time-of-flight (TOF) mass spectrometer based on the Wiley-McLaren design wiley:tof_mass_spect , as shown in Fig. 1. The sample (target) is mounted between two stainless steel blocks, which are mechanically and electrically attached to a stainless steel plate (S) held under vacuum at about torr (pressure limited by chamber design and vacuum preparation, not the ablation process). This sample plate is held at about 805 V, and the subsequent grid (G1) is held at about 730 V, directing ions produced at the sample toward the remainder of the mass spectrometer. The second grid (G2) is held at ground, and the potential difference between G1 and G2 provides most of the acceleration of the ions. After passing through G2, ions travel through a nominally electric field-free drift region for mass separation, before reaching the third grid (G3), which is also held at ground wire_mesh_note . After passing through G3, the ions are detected by a channeltron electron multiplier (CEM; Photonis, Magnum 5900), which has a large negative potential applied to it (-2000 V).
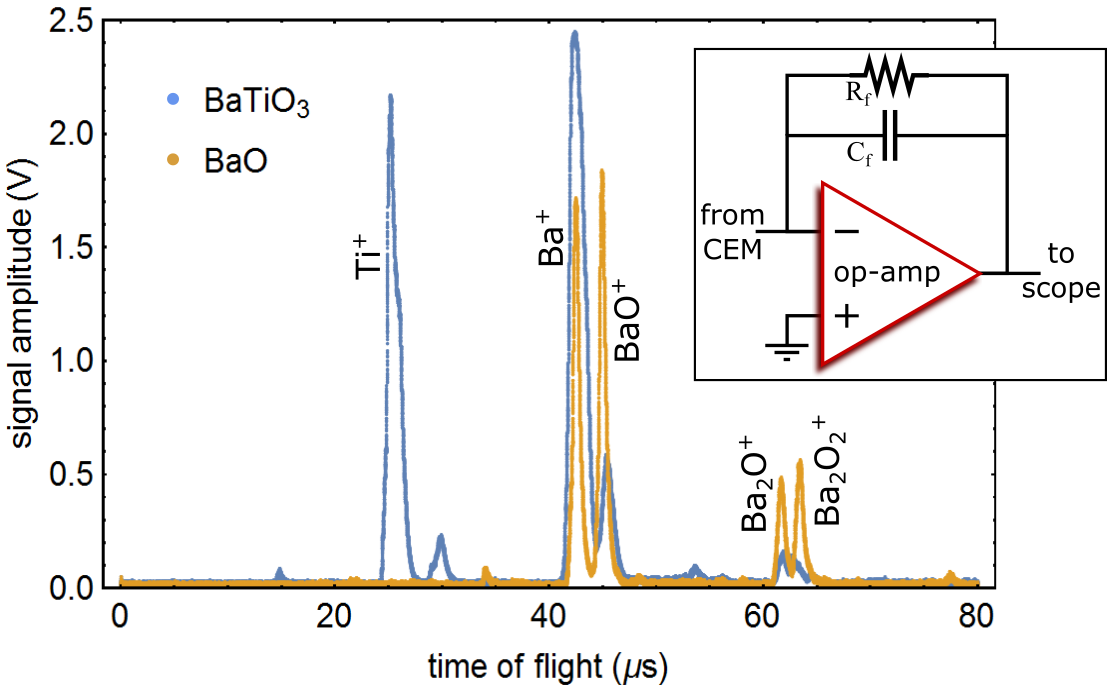
The signal from the CEM is amplified by a basic charge-sensitive amplifier, shown in the inset of Fig. 2. The components in the circuit are chosen to provide good signal-to-noise, while keeping the decay time of the signal short compared to the expected flight time between ions with different charge-to-mass ratios. Data for BaO and BaTiO3 targets, each averaged over 25 TOF spectra (25 ablation pulses), is shown in Fig. 2 with major peaks identified.
The relative ion yield is determined for several elements, as shown in Table 1, where the values given are with respect to the the largest ion yield (Ca); for reference, the Ca TOF peak reaches about 6.9 V on the oscilloscope. For each element, the data from four scans is analyzed, where each scan is an average of 25 TOF spectra. We take the average peak height consistent with the charge-to-mass ratio of the investigated ion as the ion yield detection_efficiency_note . In each case, approximately 100 ablation pulses are applied to the sample before the four scans that constitute the data analyzed. (It is found that the first several pulses yield additional ablation products not seen in later scans, and that subsequent TOF spectra are more consistent. For some elements, peaks consistent with atomic and molecular nitrogen, oxygen, etc., remain in subsequent TOF spectra.) Note that the yield presented in Table 1 for barium (Ba) is with a BaTiO3 target, as discussed below, whereas all the others are for a pure () element target. Additionally, while the scans for barium, dysprosium, erbium, lanthanum, and lutetium show minor peaks consistent with doubly-ionized atoms, these signals are not unambiguously identified due to the resolution of our spectrometer, so only singly-ionized yields are tabulated.
| Ion | Relative Yield |
|---|---|
| Ca | 1. (0.02) |
| Ba | 0.37 (0.01) |
| Dy | 0.56 (0.02) |
| Er | 0.46 (0.01) |
| La | 0.48 (0.03) |
| Lu | 0.52 (0.03) |
| Yb | 0.51 (0.01) |
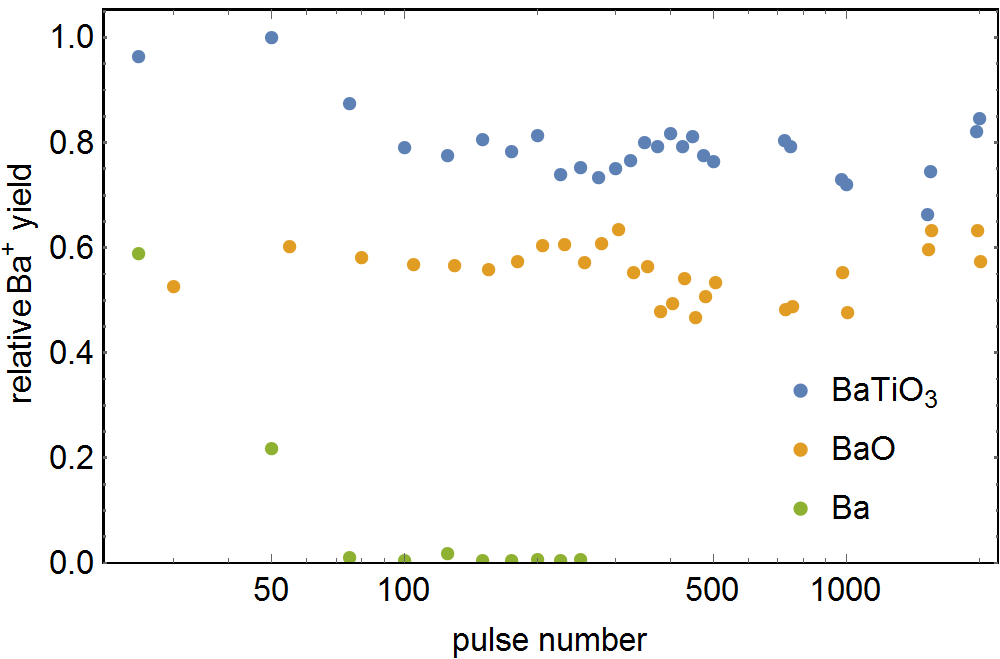
We verify that the ion yield for each element remains roughly constant for application of at least 500 ablation pulses focused onto a single location on the sample. The exception to this is elemental barium, exposed to atmosphere for about 30 minutes. As shown in Fig. 3, the ion yield for this target quickly decreases, even when the ablation pulses are swept across a 5x5 location grid in each scan. The unreliability of the elemental barium target led us to investigate alternative ablation targets, BaO and BaTiO3. Both of these targets produce a roughly constant yield of Ba+ for at least 2000 ablation pulses at a single location on the sample (Fig. 3). Here, the BaO is a sample of pure () Ba exposed to atmosphere for more than a year. The ability to produce ions from an oxidized target may be particularly useful for samples that react aggressively in air, such as barium, since it is also more difficult to construct conventional atomic sources devoe:ba_heating ; graham:barium_surface_trap .
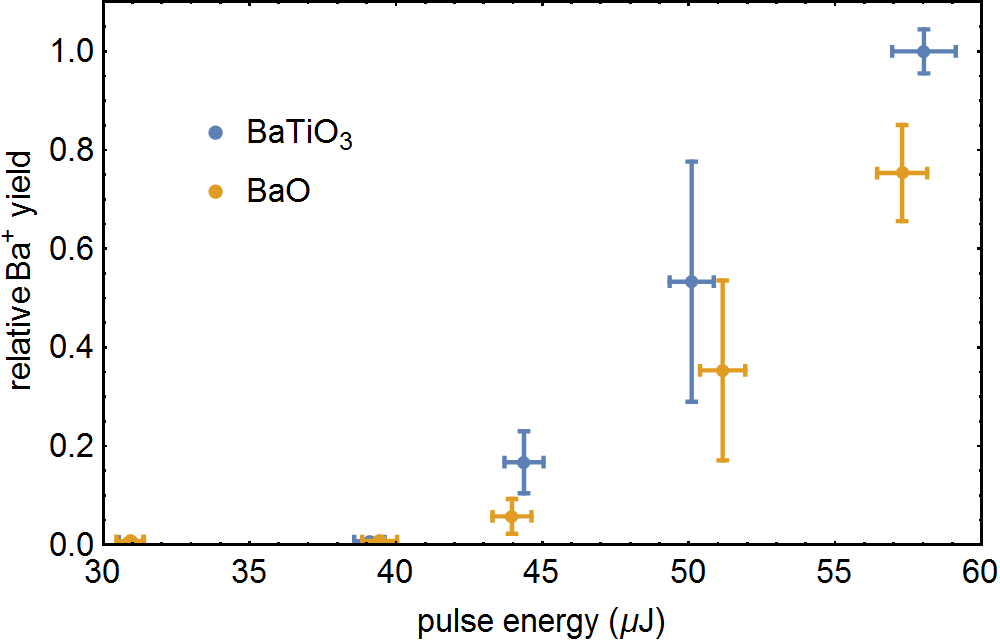
The ion yield as a function of the incident pulse energy is determined for the BaO and BaTiO3 targets, as shown in Fig. 4. At each pulse energy, 3 to 7 scans are recorded, where each scan consists of an average of 25 TOF spectra (25 ablation pulses), and the average peak height is used to determine the relative ion yield. The pulse energy is adjusted by adding attenuation. Using a pyroelectric energy sensor (Thorlabs, ES111C), we measure the reflectivity of M1 and the transmission of the vacuum viewport, and the pulse energy prior to M1 at each attenuation level, and thus determine the pulse energy for each attenuation level at the sample. Both samples exhibit a threshold for efficient barium ion production near 42 J, or a peak fluence of approximately 0.2 J/cm2. We conclude the ablation laser beam path should be carefully designed to maintain fluence above this threshold for efficient ion trap loading.
3 Ion Trap Loading
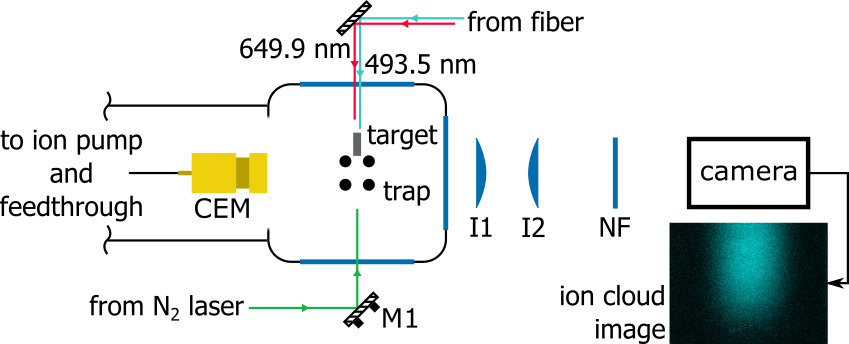
Barium ions produced by laser ablation of a BaTiO3 target are confined in a four-rod radiofrequency (rf) Paul trap. The trap, chamber, and optical setup are shown schematically in Fig. 5. The trap consists of four parallel stainless steel rods with diameter of 1.6 mm and center-to-center spacing of 3.3 mm between adjacent rods (supported by macor spacers), and tungsten wire loops at each end around two opposing rods. A helical resonator is used to apply rf voltage to two opposing rods at 11 MHz at a maximum amplitude of about 310 V, with the other two rods held at ground. The tungsten wire loops serve as the endcaps, with a static 1 V applied to each, and an axial separation of 15 mm. The ablation target is located about 2.5 mm axially from the trap center, is nearly flush with the outer edge of the rods, and is connected to ground. Here, we choose BaTiO3 as the ablation target because of the higher ion yield measured previously (Fig. 3), and because it is less brittle than the aged BaO sample.
The amplitude of the rf voltage at the output of the helical resonator and applied to the trap electrodes is determined by monitoring the voltage capacitively-coupled onto the endcap vacuum feedthrough pin. First, a small rf calibration signal with known amplitude, directly produced by a signal generator and measured on an oscilloscope, is applied to the vacuum feedthrough pin for the trap rf electrodes. This calibration signal is varied in amplitude and frequency to confirm the capacitively-coupled voltage at the endcap feedthrough pin is related by a constant scale factor in this range. Then this scale factor, and the voltage measured at the endcap pin, is used to determine the rf amplitude produced by the helical resonator at the trap electrodes. Here we assume the rf voltage at the vacuum feedthrough is equal to the rf voltage on the electrodes.
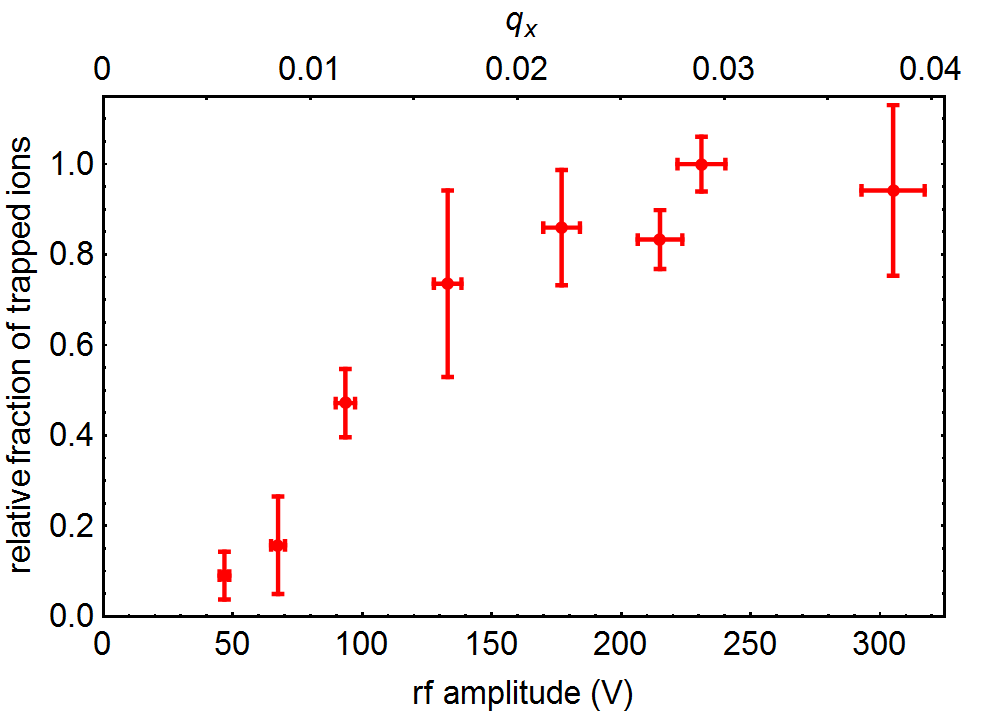
We measure the relative fraction of ions trapped as a function of the applied rf voltage, with the results shown in Fig. 6. The experiment sequence is controlled by an FPGA board (Terasic, DE0-Nano). The sequence consists of switching off the rf voltage for 1 ms, triggering the N2 laser and switching on the rf voltage, holding the trapped ions for a variable length of time (here, 10 ms), and then switching off the rf voltage to detect the ions with the CEM. The 493.5 nm and 649.9 nm light shown in Fig. 5 was not present for this set of measurements. As expected, the results shown in Fig. 6 indicate that the number of trapped ions decreases as the rf voltage (and thus the trap depth) approaches zero. However, the relative fraction of ions trapped appears to plateau above an rf amplitude of about 175 V, which for an ideal linear quadrupole trap corresponds to a transverse trap depth of about 0.5 eV champenois:ion_dynamics_tutorial . We conclude that above this voltage the transverse trap depth no longer limits the loading efficiency, which may indicate that the transverse trap depth is greater the average energy of the ablated ions. However, given the dynamics of both laser ablation and the trap loading procedure, more detailed analysis would be required to eliminate all other possible limiting factors hashimoto:ablation .
The absolute number of ions is roughly estimated by comparing the integrated area of the CEM signal produced by a group of detected ions to that of a single detected ion. Assuming a detection efficiency of 1-10% gilmore:ion_detect_efficiency_cem ; sullivan:thesis_hudson_group , we roughly estimate the average total number of ions produced by a single ablation pulse as to , and the average total number of ions trapped as to (rf amplitude at 215 V). This estimate for the number of ions produced by ablation should apply to Sec. 2 as well, though the configuration of the TOF mass spectrometer also limits the number of ions reaching the detector.
We also observe a trapped barium ion cloud produced by laser ablation by directly imaging onto a camera the laser fluorescence from the ions, with an image shown as an inset in Fig. 5. The 493.5 nm light used to drive the to transition is produced by a custom extended-cavity diode laser (ECDL; design similar to ricci:diode_laser ) operating near 987.1 nm that is frequency-doubled using a custom second-harmonic generation cavity (design similar to wilson:shg ; lo:shg ) with a BiBO crystal. Light near 649.9 nm, used to drive the to transition, is directly produced by another custom ECDL. The optogalvanic signal from a commercial, single-ended, barium hollow cathode lamp (Perkin-Elmer, N2025305) is used as a frequency reference for each laser. A simple imaging system composed of two singlet lenses (I1, focal length mm; I2, focal length mm) and a notch filter (Semrock, FF01-494/20-25) is used to image fluorescence from trapped ions onto a camera (PointGrey, FL3-U3-13S2M-CS) with an integration time of about 333 ms, where I1 is positioned approximately from the ion cloud and I2 is positioned approximately from the camera sensor (the distance between I1 and I2 is about 30 mm). The resulting image of the trapped ion cloud confirms the production of barium ions by laser ablation, and the applicability of this loading method for experiments with trapped ions.
4 Conclusion
Laser ablation is a useful technique for directly producing atomic ions for trapped ion experiments. Using a pulsed nitrogen laser, we produced Ba, Ca, Dy, Er, La, Lu, and Yb ions, and compared the relative ion yield for each. Here, reliable production of Ba ions appears to require using substrates other than pure barium, with consistent ion production demonstrated with BaO and BaTiO3 targets, and sufficient pulsed laser fluence. We also demonstrated loading of an rf quadrupole trap using laser ablation, and the relative loading efficiency as a function of the rf voltage. Our results show that laser ablation may be successfully employed in future trapped ion experiments that may require or benefit from this alternative trap loading method. Additional improvements may be gained by further characterizing the ablation process (including investigating the ablation plume hussein:ablation_plume ), increasing the resolution of the mass spectrometer bergmann:high_res_tof_ms_reflector ; gill:laser_ablation_ion_trap_ms ; schowalter:integrate_ion_trap_tof_ms , and using resonant laser ablation gill:resonant_laser_ablation .
Acknowledgements.
We thank E. Peik for useful discussions about laser ablation; D. Hanneke for useful discussions about SHG cavity design; P. Banner, J. Hankes, and A. Nelson for technical contributions to the ion trap setup; and D. Burdick for expert machining. P.B. acknowledges support from the J. Reid & Polly Anderson Endowed Fund at Denison University. This material is based upon work supported by, or in part by, the U. S. Army Research Laboratory and the U. S. Army Research Office under contract/grant number W911NF-13-1-0410; Research Corporation for Science Advancement through Cottrell College Science Award 22646; and Denison University. Specific product citations are for the purpose of clarification only, and are not an endorsement by the authors, the U. S. Army Research Laboratory, the U. S. Army Research Office, Research Corporation for Science Advancement, or Denison University.References
- (1) A.D. Ludlow, M.M. Boyd, J. Ye, E. Peik, P. Schmidt, Rev. Mod. Phys. 87, 637 (2015). URL https://doi.org/10.1103/RevModPhys.87.637
- (2) A. Härter, J. Hecker Denschlag, Contemporary Physics 55, 33 (2014). URL http://dx.doi.org/10.1080/00107514.2013.854618
- (3) J.P. Karr, J. Phys. B 42, 154018 (2009). URL http://dx.doi.org/10.1088/0953-4075/42/15/154018
- (4) C. Orzel, Phys. Scr. 86, 068101 (2012). URL http://dx.doi.org/10.1088/0031-8949/86/06/068101
- (5) C. Monroe, J. Kim, Science 339, 1164 (2013). URL http://dx.doi.org/10.1126/science.1231298
- (6) P.D.D. Schwindt, Y.Y. Jau, H. Partner, A. Casias, A.R. Wagner, M. Moorman, R.P. Manginell, J.R. Kellogg, J.D. Prestage, Rev. Sci. Inst. 87, 053112 (2016). URL http://dx.doi.org/10.1063/1.4948739
- (7) D. De Motte, A.R. Grounds, M. Rehák, A. Rodriguez Blanco, B. Lekitsch, G.S. Giri, P. Neilinger, G. Oelsner, E. Il’ichev, M. Grajcar, W.K. Hensinger, Quan. Inf. Proc. 15, 5385 (2016). URL https://doi.org/10.1007/s11128-016-1368-y
- (8) M.F. Brandl, M.W. van Mourik, L. Postler, A. Nolf, K. Lakhmanskiy, R.R. Paiva, S. Möller, N. Daniilidis, H. Häffner, V. Kaushal, T. Ruster, C. Warschburger, H. Kaufmann, U.G. Poschinger, F. Schmidt-Kaler, P. Schindler, T. Monz, R. Blatt, Rev. Sci. Inst. 87, 113103 (2016). URL http://dx.doi.org/10.1063/1.4966970
- (9) H.G. Dehmelt, Adv. At. Mol. Phys. 3, 53 (1967). URL http://dx.doi.org/10.1016/S0065-2199(08)60170-0
- (10) N. Kjaergaard, L. Hornekaer, A.M. Thommesen, Z. Videsen, M. Drewsen, Appl. Phys. B 71, 207 (2000). URL https://doi.org/10.1007/s003400000296
- (11) S. Gulde, D. Rotter, P. Barton, F. Schmidt-Kaler, R. Blatt, W. Hogervorst, Appl. Phys. B 73, 861 (2001). URL https://doi.org/10.1007/s003400100749
- (12) D.M. Lucas, A. Ramos, J.P. Home, M.J. McDonnell, S. Nakayama, J. Stacey, S.C. Webster, D.N. Stacey, A.M. Steane, Phys. Rev. A 69, 012711 (2004). URL https://doi.org/10.1103/PhysRevA.69.012711
- (13) U. Tanaka, H. Matsunishi, I. Morita, S. Urabe, Appl. Phys. B 81, 795 (2005). URL https://doi.org/10.1007/s00340-005-1967-2
- (14) L. Deslauriers, M. Acton, B.B. Blinov, K. Brickman, P.C. Haljan, W.K. Hensinger, D. Hucul, S. Katnik, R.N. Kohn, Jr., P.J. Lee, M.J. Madsen, P. Maunz, S. Olmschenk, D.L. Moehring, D. Stick, J. Sterk, M. Yeo, K.C. Younge, C. Monroe, Phys. Rev. A 74, 063421 (2006). URL https://doi.org/10.1103/PhysRevA.74.063421
- (15) M. Brownnutt, V. Letchumanan, G. Wilpers, R. Thompson, P. Gill, A. Sinclair, Appl. Phys. B 87, 411 (2007). URL https://doi.org/10.1007/s00340-007-2624-8
- (16) A.V. Steele, L.R. Churchill, P.F. Griffin, M.S. Chapman, Phys. Rev. A 75, 053404 (2007). URL https://doi.org/10.1103/PhysRevA.75.053404
- (17) B. Wang, J.W. Zhang, C. Gao, L.J. Wang, Opt. Express 19, 16438 (2011). URL https://doi.org/10.1364/OE.19.016438
- (18) M. Johanning, A. Braun, D. Eiteneuer, C. Paape, C. Balzer, W. Neuhauser, C. Wunderlich, Appl. Phys. B 103, 327 (2011). URL https://doi.org/10.1007/s00340-011-4502-7
- (19) G. Leschhorn, T. Hasegawa, T. Schaetz, Appl. Phys. B 108, 159 (2012). URL https://doi.org/10.1007/s00340-012-5101-y
- (20) R.G. DeVoe, C. Kurtsiefer, Phys. Rev. A 65, 063407 (2002). URL https://doi.org/10.1103/PhysRevA.65.063407
- (21) R.D. Graham, S. Chen, T. Sakrejda, J. Wright, Z. Zhou, B.B. Blinov, AIP Advances 4, 057124 (2014). URL http://dx.doi.org/10.1063/1.4879817
- (22) M. Cetina, A. Grier, J. Campbell, I. Chuang, V. Vuletić, Phys. Rev. A 76, 041401(R) (2007). URL https://doi.org/10.1103/PhysRevA.76.041401
- (23) J.M. Sage, A.J. Kerman, J. Chiaverini, Phys. Rev. A 86, 013417 (2012). URL https://doi.org/10.1103/PhysRevA.86.013417
- (24) R.E. Russo, Appl. Spectrosc. 49, 14A (1995)
- (25) P.R. Willmott, J.R. Huber, Rev. Mod. Phys. 72, 315 (2000). URL https://doi.org/10.1103/RevModPhys.72.315
- (26) R.J. Hendricks, D.M. Grant, P.F. Herskind, A. Dantan, M. Drewsen, Appl. Phys. B 88, 507 (2007). URL https://doi.org/10.1007/s00340-007-2698-3
- (27) K. Sheridan, W. Lange, M. Keller, Appl. Phys. B 104, 755 (2011). URL https://doi.org/10.1007/s00340-011-4563-7
- (28) R.D. Knight, App. Phys. Lett. 38, 221 (1981). URL http://dx.doi.org/10.1063/1.92315
- (29) C.G. Gill, B. Daigle, M.W. Blades, Spectrochim. Acta Part B 46, 1227 (1991). URL http://dx.doi.org/10.1016/0584-8547(91)80117-L
- (30) Y. Matsuo, H. Maeda, M. Takami, Hyperfine Interact. 74, 269 (1992). URL https://doi.org/10.1007/BF02398636
- (31) C.G. Gill, A.W. Garrett, P.H. Hemberger, N. Nogar, Spectrochim. Acta Part B 51, 851 (1996). URL http://dx.doi.org/10.1016/0584-8547(96)01467-X
- (32) Y. Hashimoto, L. Matsuoka, H. Osaki, Y. Fukushima, S. Hasegawa, Jpn. J. Appl. Phys. 45, 7108 (2006). URL http://dx.doi.org/10.1143/JJAP.45.7108
- (33) D.R. Leibrandt, R.J. Clark, J. Labaziewicz, P. Antohi, W. Bakr, K.R. Brown, I.L. Chuang, Phys. Rev. A 76, 055403 (2007). URL https://doi.org/10.1103/PhysRevA.76.055403
- (34) T. Kwapień, U. Eichmann, W. Sandner, Phys. Rev. A 75, 063418 (2007). URL https://doi.org/10.1103/PhysRevA.75.063418
- (35) T.A. Schmitz, G. Gamez, P.D. Setz, L. Zhu, R. Zenobi, Anal. Chem. 80, 6537 (2008). URL http://dx.doi.org/10.1021/ac8005044
- (36) K. Zimmermann, M.V. Okhapkin, O.A. Herrera-Sancho, E. Peik, Appl. Phys. B 107, 883 (2012). URL https://doi.org/10.1007/s00340-012-4884-1
- (37) V.H.S. Kwong, Phys. Rev. A 39, 4451 (1989). URL https://doi.org/10.1103/PhysRevA.39.4451
- (38) C.J. Campbell, A.V. Steele, L.R. Churchill, M.V. DePalatis, D.E. Naylor, D.N. Matsukevich, A. Kuzmich, M.S. Chapman, Phys. Rev. Lett. 102, 233004 (2009). URL https://doi.org/10.1103/PhysRevLett.102.233004
- (39) S. Olmschenk, B. Bedacht, N. Theisen, Bull. Am. Phys. Soc. 59 (2014). URL http://meetings.aps.org/link/BAPS.2014.DAMOP.Q1.25
- (40) M. Lepers, Y. Hong, J.F. Wyart, O. Dulieu, Phys. Rev. A 93, 011401(R) (2016). URL https://doi.org/10.1103/PhysRevA.93.011401
- (41) Although the nitrogen laser profile shows considerable non-gaussian structure, we approximate it as a gaussian profile for the beam calculations presented.
- (42) W.C. Wiley, I.H. McLaren, Rev. Sci. Inst. 26, 1150 (1955). URL http://dx.doi.org/10.1063/1.1715212
- (43) All three grids use a 72x72 stainless steel mesh with 0.0037 inch diameter wire (McMaster-Carr, 9230T66), mounted across a 0.5 inch diameter hole in a stainless steel plate.
- (44) Possible mass-dependent variation in the CEM detection efficiency gilmore:ion_detect_efficiency_cem is not included in the ion yield calculation.
- (45) C. Champenois, J. Phys. B 42, 154002 (2009). URL http://dx.doi.org/10.1088/0953-4075/42/15/154002
- (46) I.S. Gilmore, M.P. Seah, Applied Surface Science 144, 113 (1999). URL http://dx.doi.org/10.1016/S0169-4332(98)00779-X
- (47) S.T. Sullivan, The motion trap: a hybrid atom-ion trap system for experiments in cold-chemistry and the production of cold polar molecular ions. Ph.D. thesis, UCLA (2013). URL http://escholarship.org/uc/item/0c36c29j
- (48) L. Ricci, M. Weidemüller, T. Esslinger, A. Hemmerich, C. Zimmermann, V. Vuletic, W. König, T.W. Hänsch, Op. Comm. 117, 541 (1995). URL http://dx.doi.org/10.1016/0030-4018(95)00146-Y
- (49) A.C. Wilson, C. Ospelkaus, A.P. VanDevender, J.A. Mlynek, K.R. Brown, D. Leibfried, D.J. Wineland, Appl. Phys. B 105, 741 (2011). URL https://doi.org/10.1007/s00340-011-4771-1
- (50) H. Lo, J. Alonso, D. Kienzler, B.C. Keitch, L.E. de Clercq, V. Negnevitsky, J.P. Home, Appl. Phys. B 114, 17 (2014). URL https://doi.org/10.1007/s00340-013-5605-0
- (51) A.E. Hussein, P.K. Diwakar, S.S. Harilal, A. Hassanein, J. Appl. Phys. 113, 143305 (2013). URL http://dx.doi.org/10.1063/1.4800925
- (52) T. Bergmann, T.P. Martin, H. Schaber, Rev. Sci. Inst. 61, 2592 (1990). URL http://dx.doi.org/10.1063/1.1141843
- (53) S.J. Schowalter, K. Chen, W.G. Rellergert, S.T. Sullivan, E.R. Hudson, Rev. Sci. Inst. 83, 043103 (2012). URL http://dx.doi.org/10.1063/1.3700216