The Polar Nano Regions Relaxor Transition in ; .
Abstract
In previous work, molecular dynamics simulations based on a
first-principles-derived effective Hamiltonian for
(PSN), with nearest-neighbor Pb-O
divacancy pairs, was used to calculate
vs. T, phase diagrams for PSN with:
ideal rock-salt type chemical order; nanoscale chemical short-range order;
and random chemical disorder. Here, we show that the
phase diagrams should include additional regions in which a
glassy relaxor-phase (or state) is predicted. With respect to
phase diagram topology, these results strongly support the
analogy between relaxors and magnetic spin-glass-systems.
pacs:
77.80.Bh, 77.84.Dy, 64.70.Kb, 61.46.-wSubmitted for publication in Physical Review B,
I Introduction
Heterovalent perovskite-based relaxor ferroelectrics (RFE) Smolensky ; Cross , such as (PSN), (PST), and (PZN) and, [which have no ferroelectric (FE) ground-state] such as (PMN) and (PMT), are technologically important transducer/actuator materials with extraordinary dielectric and electromechanical properties. Chemically disordered PSN exhibits polar nano-regions (PNR) characteristics (more polarizable PNR in a less polarizable matrix) above a normal FE-transition at 373 K. Chu Chu0 demonstrated that the addition of 1.7 atomic % Pb-O divacancies depresses the FE transition temperature (T), from 373 K to 338 K, and broadens the T-range in which PNR properties, e.g. frequency dispersion in the dielectric response, are observed. Chu also reported similar and more complete results for isostructural PSTChu1 ; Chu2 ; Chu3 . These results suggest that a sufficient bulk concentration of divacancy pairs, , will drive the system to a relaxor ferroelectric (RFE) state, with an FE-ground-state, or to a fully relaxor state, without an FE-ground-state, at , where is the critical composition at which .
Chemical disorder and defects such as Pb-vacancies (VPb) Bellaiche07 , oxygen vacancies (VO) or charge-compensating nearest neighbor (nn) Pb-O divacancy pairs (V) CockaynePbO , are sources of local, () e.g. Kleemann2006 ; Burton2006 ; Kleemann2012 (angle brackets indicate a simulation box average). Hence, the T vs. phase diagrams presented here are topologically equivalent to the T vs. diagrams that are typically drawn for analytical mean-field models of magnetic spin-glass (SG) systems Sherr1 ; Sherr2 ; Sherr3 ; Sherr4 .
Recent publications by Sherrington Sherr1 ; Sherr2 ; Sherr3 ; Sherr4 emphasized an analogy between relaxor ferroelectrics and magnetic SG with ; magnetic spins or ferroelectric displacements with variable magnitudes and arbitrary orientations. Pseudospin-psuedospin interactions in these models are frustrated (random-bond frustration EA1975 ), and the combination of frustration plus quenched chemical disorder QUENCH are identified as essential constituents of relaxors. The model used here: also has () at each Pb-site; first-, second-, and third-nn -pairwise interactions, plus 4’th through 39’th-nn -pair dipole-dipole interactions; and at each Pb-site. An analysis of that is based on nn Pb–B-site pairs in an ideal perovskite structure with a random cation configuration Burton2006 indicates a distribution of orientations such that 34% are along -type directions; 21% are -type; 19% are -type; 19% are -type; and 7% are Burton2006 (weighted by -strength the corresponding percentages are: 29% , 21% , 23% , and 27% ). The used for the calculations presented here were calculated as the local field imposed by the whole simulation box. In this model, pairwise interactions are all FE in character, hence the and [Pb-O]-divacancies are the only sources of frustration; and ideally NaCl-ordered pure PSN is unfrustrated.
Results presented here require changes in the phase diagrams that were presented in Burton2008 . The field that was formerly referred to as the RFE-region in vs. phase diagrams Burton2008 is now divided into: 1) a PNR-region, in which spatially static but orientationally dynamic PNR (centered on 2 nm diameter chemically ordered regions Burton2005 ) are embedded in a less polarizable matrix; and 2) an RFE/relaxor-region ( for brevity) in which PNR have more static orientations. The T(-curve [ T()-curve] that divides the PNR-region from the relaxor-region is referred to as . Dkhil Dkhil referred to as ”…a local phase transition that gives rise to the appearance of static polar nanoclusters.” We reject the phrase ”local phase transition,” because (strictly) phase transitions only occur in infinite systems, and because our results suggest a weakly first-order transition, however, we do predict a subtle stiffening of PNR-orientations below .
In previous simulationsBurton2006 ; Burton2008 , the presence of VPb vacanciesBellaiche07 or V divacanciesBurton2006 ; Burton2008 in PSN lead to more diffuse FE phase transitions, with broadened dielectric susceptibility peaks; however, the RFE/relaxor-phase (state?) was not clearly delineated. Here, simulations are used to construct vs. T phase diagrams for with random, perfectly rock-salt ordered and nano-ordered (NO) cation configurations as in Burton2008 . The NO configuration has 20 NaCl-type ordered clusters in a percolating random matrix. Divacancy concentration- and T-ranges for PE- and FE-phases, and for ”RFE-states”, were identified from changes in polarization correlationsTinte06 , but the RFE/relaxor-phase was not delineated.
II Simulations
II.1 The Model Hamiltonian
Simulations were performed using the first-principles based effective Hamiltonian that is described in detail in Burton2006 ; it expands the potential energy of PSN in a Taylor series about a high-symmetry perovskite reference structure, including those degrees of freedom relevant to FE phase transitions:
| (1) | |||||
where represents Pb-site centered local polar distortion variables of arbitrary magnitudes and orientations; is a homogeneous strain term; is a strain coupling term; and the standard pressure-volume term. The first four terms are sufficient to model pressure-dependent phase transitions in a normal FE perovskite without local fields Rabe . The fifth term, , represents coupling between polar variables and “random” local fields, , ISFD7 ; TMS ; Burton2006 from: 1) screened electric fields from the quenched distribution of Sc3+ and Nb5+ ions ; and 2) by V[Pb-O].
As described in Burton2008 all simulations were done with a MD-supercell, in which each Pb-atom is associated with a local distortion vector, , that indicates the displacement of lead atom from its ideal perovskite position. The effective Hamiltonian in Eqn. 1 was used to derive equations of motion, with an MD time-step of 0.06 picoseconds.
Divacancies are modeled by replacing randomly selected local distortion variables with fixed dipole moments corresponding to V divacancy pairs ( local fields directed, from a Pb-site, along one of the 12 110-type vectors).
II.2 Order Parameters
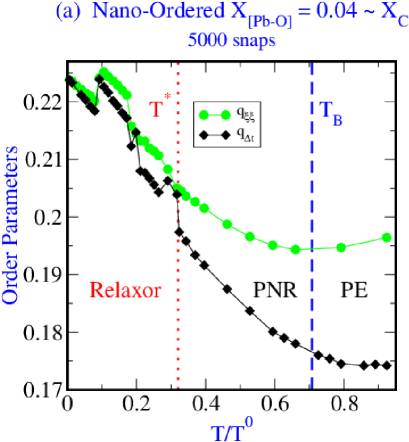
Curves for the Burns temperatures, , Burns83 and the FE-transitions, are identical to those in Burton2008 . Curves for were located by plotting T-dependent - and -curves where: is the self-overlap order parameter, Castellani2005 Eqn. 2; and Eqn. 3, is an autocorrelation function that compares the displacement of atom at time- with at time- (typically, = 100 MD-snapshots = 6.0 picoseconds).
The idea behind is that a time-sensitive order parameter may be more sensitive to the sort of PNR-stiffening referred to by Dkhil: Dkhil
| (2) |
and
| (3) |
where: N is the number of Pb-sites; summations are over the all Pb-displacements; and the averaging represented by angle brackets is over the last 1000 MD-snapshots in a 3000- or 5000 snapshot series (see below). Within the precision of these simulations, both order parameters yield the same results for .
Numerical simulations can not distinguish between crossovers and phase transitions where: crossovers correspond to inflection points in and/or ; and phase transitions correspond to discontinuities in first- or second-T-derivatives of and/or ( first-order, or continuous- or critical-transition, respectively Fisher ). Because the results for random- and NO-cation configurations strongly suggest a (weakly) first-order phase transition, will be referred to as a phase , and the relaxor will be referred to as a , but with the caveat that may actually mark a crossover, and the relaxor would then be a .
Order parameter values were calculated from MD-snapshots that were taken every 100 MD time-steps in a series of 3000 or 5000 MD-snapshots (enough snapshots that and , are approximately constant for 1000 snapshots); 3000 for the NaCl-ordered and random cation configurations; 5000 for the NO configuration. Plotted order-parameter values are averages over the last 1000 MD snapshots in a series.
III Results
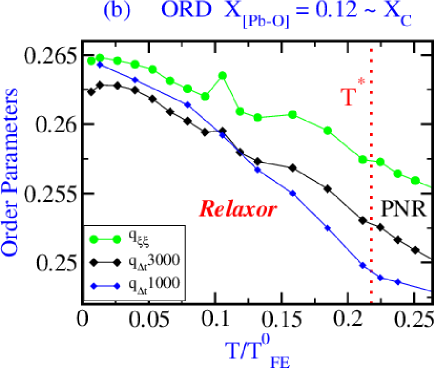
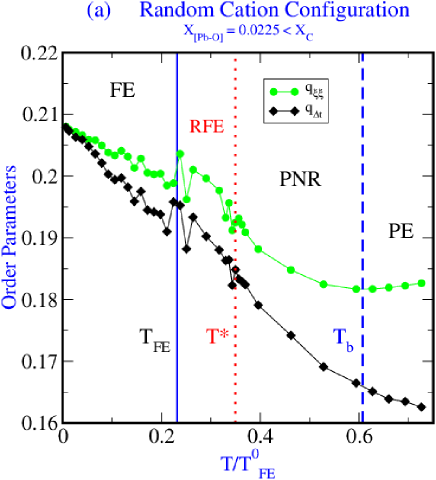
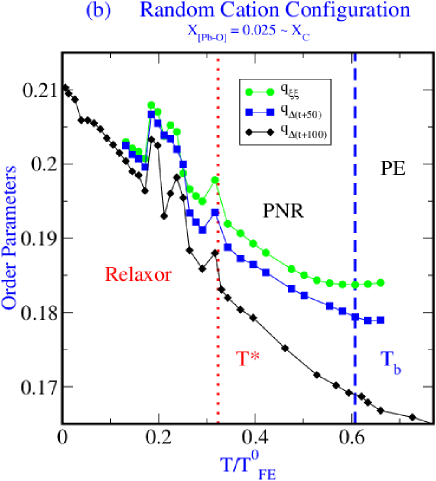
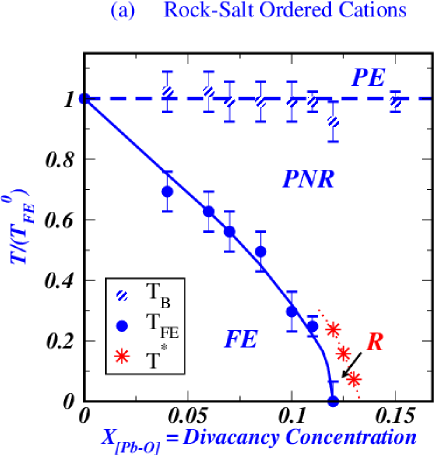
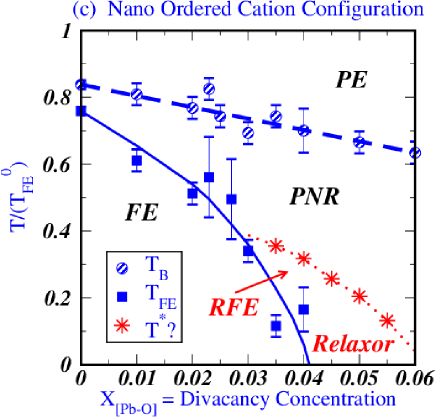
Representative results for order-parameter vs. T curves are plotted in Figs. 1, 2, and 3. Corresponding phase diagrams are plotted in Figs. 4. In all these plots, T is normalized by T, the ferroelectric transition temperature () of pure ideally rock-salt-ordered . Vertical lines in Figs. 1, 2, and 3 indicate previously determined Burton2008 values for and . In all these Figures: TFE is plotted as a solid line (blue online); TB is plotted as a dashed line (blue online); and is plotted as a dotted lines (red online). In Figs. 4, large asterisk-symbols indicate points at which was located in - and -curves.
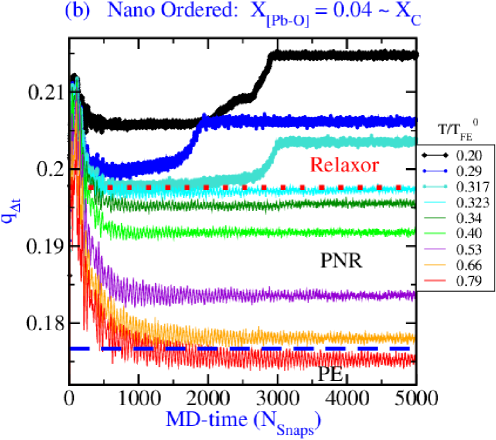
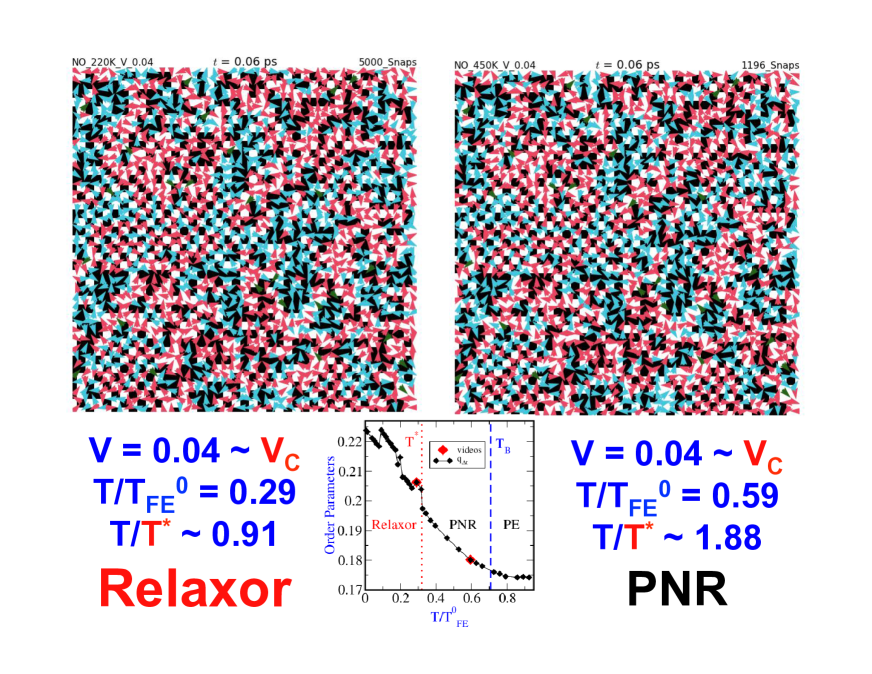
With decreasing T, and typically exhibit: broad minima at or near TB; smooth monotonic increase in the PNR-region between and TB; and erratic increase in the relaxor-region below . The erratic characters of - and -curves in the relaxor-regions of random- and NO-cation-configurations are interpreted as indicating glassy behavior. In particular, Figs 3b, which shows the MD time-dependence of , indicates that in the PNR-region above evolves monotonically, however, in the relaxor-region below , passes through local minima before finding what we take to be its final value; as one expects for a glassy material.
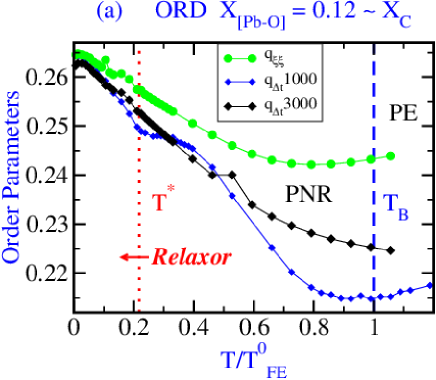
III.1 Ideal Rock-Salt Chemical Order
Unlike the random- and nano-ordered cation configurations, the PNRrelaxor is subtle in the ideally NaCl-ordered system; in which [Pb-O]-divacancies are the only source of , Figs. 1. All three curves in Figs. 1 exhibit changes in slope at about , but these changes are smaller and less well defined than those in Figs. 2 and 3; suggesting that may mark either a continuous PNRrelaxor transition, or a crossover. Also, the erratic variations of order parameters, below that are evident in Figs. 2 and 3, are either undetectable within MD-precision, or absent in the NaCl-ordered system.
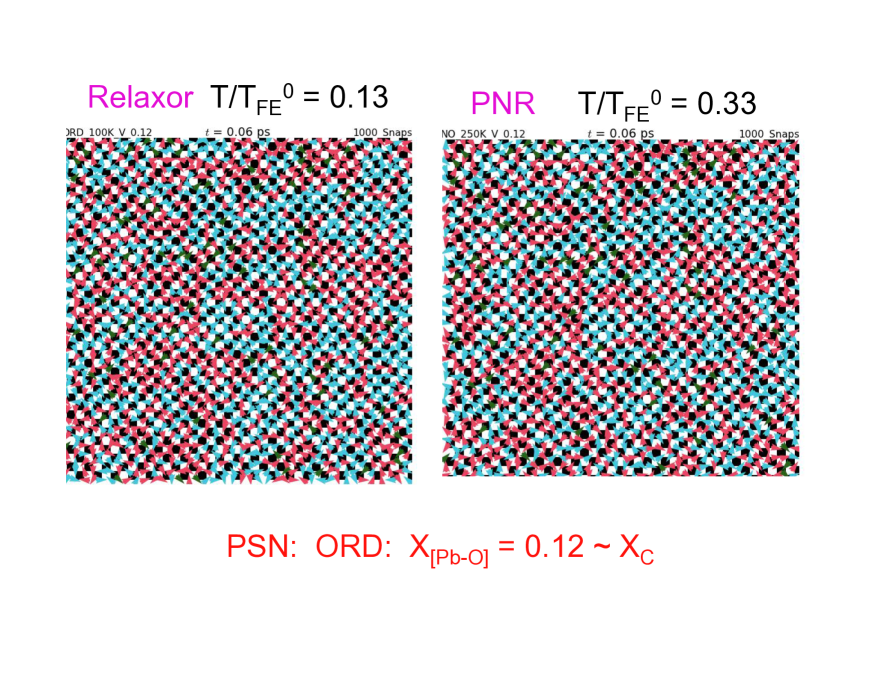
The rock-salt ordered relaxor has a very different microstructure Fig. 5 than the random- or nano-ordered cation configurations. In Fig. 5 Pb-displacement patterns and [Pb-O]-divacancy configurations are strongly correlated. Hence, even though the two panels represent a relaxor-, and a PNR-state that is close to TB, their Pb-displacement patterns are strikingly similar; reflecting the pinning of Pb-displacement patterns to the [Pb-O]-divacancy configuration. Note that the polar microstructure of the rock-salt ordered system looks more like inter-penetrating, and percolating, +z and -z domains (out- and into the plane of the figure, respectively), than like ordered domains in a disordered matrix.
III.2 Random Chemical Disorder and the Nano-Ordered Configuration
Results for the random- and nano-ordered configurations exhibit very similar systematics for the - and -curves with decreasing temperature: near , there is a typically a broad minimum; between and , they increase smoothly and monotonically; at , there appears to be a (weakly) first-order transition, Figs. 2 and 3; and below , they vary erratically, and evolves through local minima, Fig. 3b, before apparently converging. Also, there are strong correlations between chemical- and polar-order, Fig. 6 as reported in Burton Burton2008 .
IV Discussion
IV.1 Phase Diagram Topology
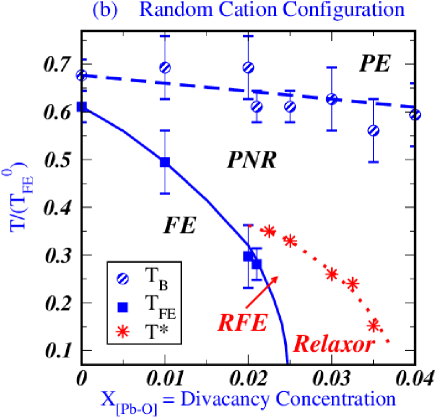
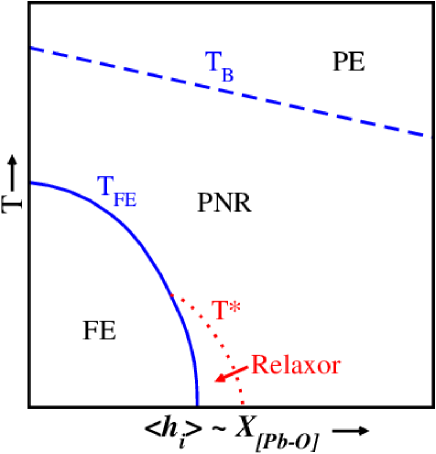
Notwithstanding the differences between and -curves for the NaCl-ordered configuration vs. those for the random- and NO-ordered configurations, all three phase diagrams exhibit the same topology, Figs. 4. Given that and are interchangeable variables, the phase diagram topology exhibited in Figs. 4 can be taken as a prototype for relaxor systems; as depicted in Fig.7. In Figs. 4, the RFE/relaxor field only occupies a narrow -range from about to about ; a limited range of average -strength.
IV.2 Comparison With Experiment
Given the approximations in this model, we do not expect accuracy in the calculated phase diagrams, but our results for a random cation configuration (Fig. 4b) agree reasonably well with experimental data of Chu et al. Chu0 . Their dielectric constant measurements of and for almost stoichiometric PSN [], and for PSN with [], respectively, indicate that the former exhibits a first order phase transition, while the latter, , appears to exhibit fully relaxor behavior without an FE ground state. From Fig. 4b one correctly predicts the phase transition in the -sample, but one would expect the -sample to also have a FE-ground-state, with an intermediate RFE-phase. In Fig. 4b, the calculated critical composition, beyond which there is no FE-ground state, is . This is at least half a percent larger than (the apparent experimental value), which suggests that our model systematically underestimates the strength of random fields from charge disorder, vacancies, or both.
IV.3 The PNRrelaxor transition and criticality
The apparent predictions of weakly first-order PNRrelaxor transitions in the random- and nano-ordered cation configurations has an important implication for relaxors. Specifically, a weakly first-order transition implies proximity to a critical point, and this suggests a simple explanation for the extraordinary electro-mechanical properties that are observed in relaxors; these properties diverge at a critical point, and are significantly enhanced close to a critical point. Indeed, Kutnjak , attributed the giant electromechanical response in PMN-PT to a liquid-vapor like critical point. Kutnjak2006 The results reported here suggest that the PNRrelaxor transition is close to a critical point; e.g. , in the sense that the application of a modest electrical field can drive the system from weakly first-order to critical.
IV.4 Additional Phase Transitions?
The experimental phase diagram for the exhibits a ferromagneticSG transition,Maletta1979 and in there are ferromagneticMixed-phase- and SGMixed-phase-transitions Coles1978 ; in which, the Mixed-phase is ferromagnetic but replica-symmetry breaking (RSB) Castellani2005 . Compelling evidence of analogous transitions was not detected in this work LowT , but such transitions are not ruled out, and there is clear similarity between relaxor- and magnetic spin-glass phase diagrams: Fig. 7 and Table I.
V Conclusions
The phase diagrams presented in Burton . Burton2008 were incomplete because they omitted -curves; delineation of the RFE/relaxor-phase field. Results presented here include: calculations of -curves; suggest a prototype relaxor phase diagram topology; and strongly support the analogy between relaxors and magnetic spin-glasses, with respect to phase diagram topology, Table I.
The combination of soft-spins with explicit 1’st-3’rd nn-pairwise pseudospin-pseudospin interactions, 4’th-39’th nn dipole-dipole interactions, and random fields, is evidently sufficient to model heterovalent relaxor systems. Both the self-orvelap order parameter and the autocorrelation function appear to be good order parameters for locating -curves, and for demonstrating the glassy character of the relaxor-phase, which only occupies a narrow range in , or equivalently in .
Previous conclusions Burton2005 ; Burton2008 about the strong correlation between chemically ordered regions and PNR are reinforced, with the addition that the orientations of PNRs become more static in the relaxor region, below the PNRrelaxor transition. In the random- and nano-ordered cation configurations appears to be a weakly first-order transition, but results for the rock-salt ordered configuration are suggestive of a continuous transition or a crossover. Hence, chemical inhomogeneities such as chemical short-range order apparently amplify relaxor character.
VI Acknowledgements
B.P. Burton thanks D. Sherrington for inspiring this work and for helpful discussions.
References
- (1) G. A. Smolensky and A. I. Agranovskaya, Sov. Phys. Sol. State 1, 1429 (1959).
- (2) L. E. Cross, Ferroelectrics 76, 241 (1987).
- (3) F. Chu, I.M. Reaney and N. Setter, J. Appl. Phys. 77[4], 1671 (1995).
- (4) F. Chu, N. Setter and A. K. Tagantsev, J. Appl. Phys. 74[8], 5129 (1993).
- (5) F. Chu, I.M. Reaney and N. Setter, J. Amer. Ceram. Soc. 78[7], 1947 (1995)
- (6) F. Chu, G. Fox and N. Setter, J. Amer. Ceram. Soc. 81, (6) 1577 (1998)
- (7) L. Bellaiche, J. Ìñiguez, E. Cockayne, and B. P. Burton Phys. Rev. B 75, 014111 (2007).
- (8) E. Cockayne and B. P. Burton, Phys. Rev. B 69, 144116 (2004).
- (9) W. Kleemann, J. Dec, V. V. Shvartsman, Z. Kutnjak and T. Braun, Phys. Rev. Lett. 97 065702 (2006).
- (10) J. Adv. Dielectrics V2, No. 2 1241001 (2012).
- (11) B. P. Burton, E. Cockayne, S. Tinte and U. V. Waghmare, Phase Trans. 79, 91 (2006).
- (12) D. Sherrington Phys. Rev. Lett. 111, 227601 (2013).
- (13) D. Sherrington Phys. Rev. B 89, 064105 (2014).
- (14) D. Sherrington Physica Status Solidi b 251, 1967 (2014).
- (15) D. Sherrington Phase Transitions 88, 202 (2015).
- (16) S.F. Edwards, P.W. Anderson, J. Phys. F 5 965 (1975).
- (17) The phrase ”quenched chemical disorder” implies that the chemical configuration is fixed within the temperature range that polar order-disorder is analyzed.
- (18) B. P. Burton, E. Cockayne, S. Tinte and U. V. Waghmare, Phys. Rev. B 77, 144114 (2008).
- (19) B.P. Burton, E. Cockayne, S. Tinte, and U.V. Waghmare, Phys. Rev. B 72, 064113 (2005).
- (20) B. Dkhil, P. Femeiner, A. Al-Barakaty, L. Bellaiche, E. Dul’kin, E. Mojaev, and M. Roth, Phys. Rev. B 80 064103 (2009).
- (21) S. Tinte, B. P. Burton, E. Cockayne and U. V. Waghmare, Phys. Rev. Lett. 97, 137601 (2006).
- (22) W. Zhong, D. Vanderbilt and K. M. Rabe, Phys. Rev. Lett. 73, 1861 (1994); K. M. Rabe and U. V. Waghmare, Phys. Rev. B 52, 13236 (1995); U. V. Waghmare and K. M. Rabe, Phys. Rev. B 55, 6161 (1997).
- (23) U. V. Waghmare, E. Cockayne, and B. P. Burton, Ferroelectrics 291, 187 (2003).
- (24) B. P. Burton, U. V. Waghmare and E. Cockayne, TMS Letters, 1, 29 (2004).
- (25) G. Burns and F. H. Dacol, Solid State Commun. 48, 853 (1983).
- (26) T. Castellani and A. Cavagna J. Stat. Mecha. P05012 (2005) PII: S1742-5468(05)99356-4
- (27) Fisher, M E (1998) Renormalization group theory: its basis and formulation in statistical physics, Reviews in Modern Physics 70(2) 653-681.
- (28) Z. Kutnjak, J. Petzelt and R. Blinc Nature 441 956 (2006).
- (29) H. Maletta and P. Convert, Phys. Rev. Lett. 42, 108, (1979)
- (30) R.B. Coles, B. Sarkissian, and R.H. Taylor, Phil. Mag. B37, 489 (1978)
- (31) The strongest suggestion of such a transition is in the NO configuration where exhibits a low-T reduction to a plateau, which does not seem to define a consistent phase-boundary or crossover (e.g. Fig. supplimentary material).