G181.1+9.5, a new high-latitude low-surface brightness SNR
Abstract
Context. More than of the known Milky Way supernova remnants are within of the Galactic Plane. The discovery of the new high-latitude SNR G181.1+9.5 will give us the opportunity to learn more about the environment and magnetic field at the interface between disk and halo of our Galaxy.
Aims. We present the discovery of the supernova remnant G181.1+9.5, a new high-latitude SNR, serendipitously discovered in an ongoing survey of the Galactic Anti-centre High-Velocity Cloud complex, observed with the DRAO Synthesis Telescope in the 21 cm radio continuum and H i spectral line.
Methods. We use radio continuum observations (including the linearly polarized component) at 1420 MHz (observed with the DRAO ST) and 4850 MHz (observed with the Effelsberg 100-m radio telescope) to map G181.1+9.5 and determine its nature as a SNR. High-resolution 21 cm H i line observations and H i emission and absorption spectra reveal the physical characteristics of its local interstellar environment. Finally, we estimate the basic physical parameters of G181.1+9.5 using models for highly-evolved SNRs.
Results. G181.1+9.5 has a circular shell-like morphology with a radius of about 16 pc at a distance of 1.5 kpc some 250 pc above the mid-plane. The radio observations reveal highly linearly polarized emission with a non-thermal spectrum. Archival ROSAT X-ray data reveal high-energy emission from the interior of G181.1+9.5 indicative of the presence of shock-heated ejecta. The SNR is in the advanced radiative phase of SNR evolution, expanding into the HVC inter-cloud medium with a density of cm-3. Basic physical attributes of G181.1+9.5 calculated with radiative SNR models show an upper-limit age of 16,000 years, a swept-up mass of more than M⊙, and an ambient density in agreement with that estimated from H i observations.
Conclusions. G181.1+9.5 shows all characteristics of a typical mature shell-type SNR, but its observed faintness is unusual and requires further study.
Key Words.:
Polarization, ISM: individual objects: G181.1+9.5, ISM: magnetic fields, ISM: supernova remnants1 Introduction
The completion of the Canadian Galactic Plane Survey (CGPS, Taylor et al., 2003) has given the community an incredibly broad view of large-scale dynamics of the Interstellar Medium (ISM) while preserving its spectacular details. Across the region of the sky surveyed by the CGPS, the Galactic plane warps upward to large -height distances, while the outer disk flares to several kpc in thickness. Because of its focus on the Galactic plane, the CGPS missed much of the off-plane ISM structure and activity. This was the motivation for a new smaller survey of the medium-latitude region towards the Galactic anti-centre 180.
The plethora of supernova remnants (SNRs), HII regions, high-velocity HI clouds (HVCs), and super-shells in this region is evidence of an extraordinarily energetic ISM. Two very large complexes of HVCs are seen in this area (collectively known as the Anti-centre Chain of HVCs; Tamanaha, 1997, and references therein), as well as an H i super-shell (the “Anti-centre Shell” or ACS; Heiles, 1984), at least seven supernova remnants, and myriad H ii regions (Sh2-232 to Sh2-237, Foster & Brunt, 2015). To produce the ACS alone would take the equivalent energy of 100 canonical supernova explosions (1053 erg; Kulkarni et al., 1985). All of this is happening in a comparatively small pie slice around the centre (3 kpc wide at R =10 kpc Galactocentric distance). The high level of activity in the plane here is very likely feeding energy to the ISM in the higher-latitude regions, and creating synergistic disk-halo activity there that remains unexplored in high-resolution centimetre bands.
It is not necessarily surprising then that during the course of this survey we have discovered a new supernova remnant in this region. G181.1+9.5 (R.A.(J2000) = , DEC(J2000) = ) is only the latest in a long line of SNRs discovered with data from the DRAO Synthesis Telescope (DRAO ST, Landecker et al., 2000). Over the last 15 years, a total of 14 new supernova remnants and pulsar wind nebulae have been found in the Outer Milky Way Galaxy mostly with data from the Canadian Galactic Plane Survey (Kothes et al., 2001; Kothes, 2003; Kothes et al., 2005; Tian et al., 2007; Foster et al., 2013; Kothes et al., 2014; Gerbrandt et al., 2014). SNR G181.1+9.5 is, however, no ordinary SNR. It has an unusual position at 10 above the Galactic plane, is remarkably spherically-symmetric, and displays the maximum fractional polarization at 4850 MHz and 1420 MHz one would expect of synchrotron emission from a shock-compressed shell. On the sky, G181.1+9.5 lies towards the Northern filament of the HVC complex known as the Anti-centre Chain of HVCs (Tamanaha, 1997, and references therein). In this paper, we present evidence that suggests the SNR is likely physically within the complex and interacting with an HVC.
The Galactic plane ISM is a highly complex environment with stellar wind bubbles, chimneys, and twisted magnetic fields. Since evolution and morphology of SNRs is strongly influenced by their environment, G181.1+9.5 perhaps represents the best opportunity yet to study SNR formation and dynamics in a relatively pristine and simplified environment. Further, this is the first example of a SNR evolving into the inter-cloud medium of an HVC complex.
In this paper, we present the discovery of G181.1+9.5 and some of its more basic observed features and physical characteristics. The hope is to motivate and enable further new observational studies and modelling analyses by the community of this extraordinary supernova remnant.
2 Observations and Data Processing
2.1 DRAO ST 1420 MHz Continuum Observations
The radio continuum and linear polarization observations at 1420 MHz were obtained with the synthesis telescope at the Dominion Radio Astrophysical Observatory (Landecker et al., 2000), as part of a large survey of the Galactic anti-centre area above the Galactic mid-plane. Observations of individual fields and data processing follow the procedures developed for the Canadian Galactic Plane Survey (Taylor et al., 2003). The survey area is covered by observations of individual fields whose centres lie on a hexagonal grid of spacing . The data of individual fields are carefully processed to remove artefacts and to obtain the highest possible dynamic range using the routines developed by Willis (1999).
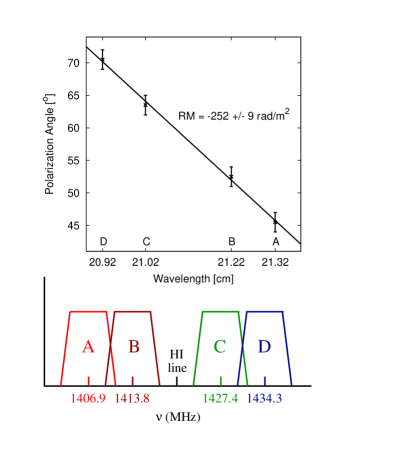
The DRAO ST provides observations of the linearly polarized emission component in four separate bands of width 7.5 MHz at 1406.9 MHz, 1413.8 MHz, 1427.4 MHz, and 1434.3 MHz centred around the HI line to allow precise determination of rotation measures (see Figure 1). Angular resolution varies slightly across the final maps as cosec(Declination). At the centre of G181.1+9.5, the resolution in the final radio continuum and polarization images is (DEC. R.A.). The rms noise in the final combined maps is about 16 mK or 125 Jy beam-1.
Accurate representation of all structures from the largest scales down to the resolution limit is assured by incorporating absolutely calibrated linear polarization observations with the DRAO 26-m John A. Galt telescope (Wolleben et al., 2006), absolutely calibrated total-intensity observations with the Stockert 25-m telescope (Reich & Reich, 1986), and data of the 100-m Effelsberg radio telescope as part of the Effelsberg Medium Latitude Survey (EMLS, Reich et al., 2004). Short spacing data in Stokes , , and are added to the interferometer images after suitable filtering in the Fourier domain (Taylor et al., 2003; Landecker et al., 2010). At 1420 MHz in polarization, short spacing data are added only to the combined Stokes and maps not the individual bands.
2.2 Effelsberg Observations
A second frequency is required to determine the characteristics of the radio continuum spectrum of G181.1+9.5 to prove it is a SNR. We made 4850-MHz total-intensity and linear-polarization observations with the two-channel double-beam receiver installed in the secondary focus of the Effelsberg 100-m telescope. Between December 2013 and May 2015, a large number of maps was observed at night time and only at clear skies to reject solar interference and weather effects. Due to strong unpolarized RFI of unknown origin, about half of the collected total-intensity data could not be used. All observation parameters are listed in Table 1. Technical details including a receiver block diagram can be found at http://www.mpifr-bonn.mpg.de/effelsberg/astronomers under the item ‘receiver list / calibration parameters’. To cover G181.1+9.5, we need to map a large area in the sky. The standard mapping procedure for Effelsberg 4850-MHz dual-beam observations, scanning along azimuth direction and subsequent restoration, works well for map-sizes up to about . However, this method will lose emission on larger scales. Therefore we decided to conduct the observations in single-beam mode by moving the telescope along Galactic longitude and Galactic latitude.
The data for both feeds were processed independently following the standard procedures for Effelsberg continuum observations, which were based on the NOD2 format (Haslam, 1974). For each observed map, we flagged distorted areas and spiky interference and made baseline improvements by using the method of unsharp masking (Sofue & Reich, 1979). The maps were calibrated for each observing night in respect to the calibration sources 3C 286 and 3C 138, as listed in Table 1.
| Data | Effelsberg 4850 MHz |
|---|---|
| Frequency [MHz] | 4850 |
| Bandwidth [MHz] | 500 |
| HPBW[] | 2.45 |
| Scanning velocity [/min] | 60 |
| Step interval [] | 1 |
| Size [ ] | 1.7 1.5 |
| Number of complete maps () | 16/30 |
| Integration time ()[s/pixel] | 16/30 |
| rms ()[mK ] | 0.4/0.1 |
| Main calibrators | 3C 286/3C 138 |
| Flux densities [Jy] | 7.5/4.1 |
| Polarization percentages | 11.3%/11.1% |
| Polarization angles [] | 33/-11 |
To include the , , and data from the second feed, which has an offset of 82 in azimuth relative to the first one, we had to apply a special transformation, where we have to make sure that this process does not introduce smoothing or other distortions. For each map pixel from the first feed, which is in Galactic coordinates, we calculated its azimuth and elevation when observed and added the azimuth offset of the second feed. We computed its exact position in Galactic coordinates, which usually deviated from the -grid of the map. Thus we transformed the data into a map with a finer grid () and re-gridded stepwise to a -grid to be combined with the maps from the first feed.
The final map was obtained by combining the individually observed maps in the Fourier domain using the “PLAIT” algorithm described by Emerson & Gräve (1988).
The absolute level of polarized emission at 4850 MHz was calculated following the method discussed by Sun et al. (2007) by extrapolating the K-band WMAP (Wilkinson Microwave Anisotropy Probe) observations of Stokes and from 22.8 GHz to 4850 MHz. We used the WMAP 9-year data release (Bennett et al., 2013) and assumed a temperature spectral index of = 3.2 (), which is typical for this area relative to the 1420 MHz DRAO polarization survey (Wolleben et al., 2006). At these high frequencies, the influence of Galactic Faraday rotation can be neglected. We convolved the and maps at both frequencies to 2 and added the difference maps to the 4850-MHz maps at full angular resolution. The smoothing beam is uncritical to the result and a different spectral index has almost no affect on the morphology of the and images, but the intensity level. The resulting 4850-MHz polarized-intensity map is shown in Fig. 2 together with the corresponding 1420-MHz map at an absolute intensity level.
2.3 H i Observations
To explore the gaseous ISM environment within which G181.1+9.5 is found, we used 12 fields from the DRAO ST Anti-Centre survey in the 21 cm spectral line to characterize the HI environment on and around the object. We used uniform weighting of the antenna elements to achieve a synthesized beam in this part of the sky approximately 9550 (DEC. R.A.). Data are calibrated to the brightness temperature scale with observations of sources 3C 48, 3C 147 and 3C 295 as described in Landecker et al. (2000), and a beam scale factor of . The overlap of the 12 fields lowers the noise in each velocity channel of the stacked mosaic, resulting in a final sensitivity of 1.3 K per 0.824 km s-1-wide channel. Spectrally, data have velocity resolution of 1.32 km s-1.
While we use interferometer-only data to measure optical depths through the HVCs via H i continuum absorption, we have also made a cube with all spatial frequencies from the largest scales down to the resolution limit of the DRAO ST by incorporating single-dish H i data as observed by the Effelsberg H i Survey (EBHIS; Winkel et al., 2016, ; with spatial and velocity resolutions of and 1.4 km s-1, respectively). After smoothing to the same resolution as the 4850-MHz total-power data of , we inspected this data cube carefully for apparent associations between the radio continuum emission structure and the distribution of the neutral hydrogen gas (see Sec. 3.4).
3 Results
3.1 G181.1+9.5 in Radio Continuum
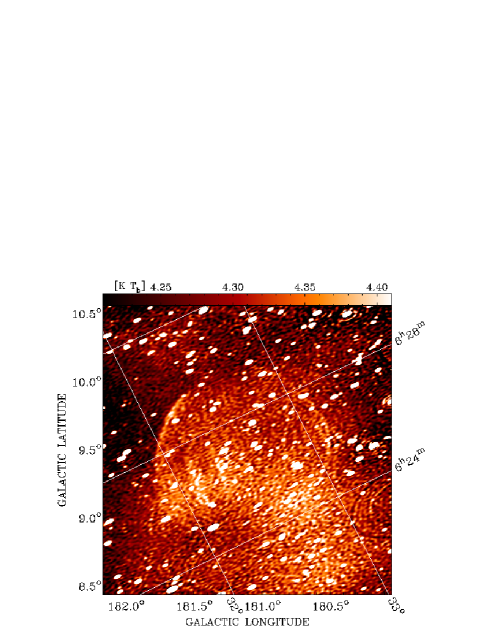
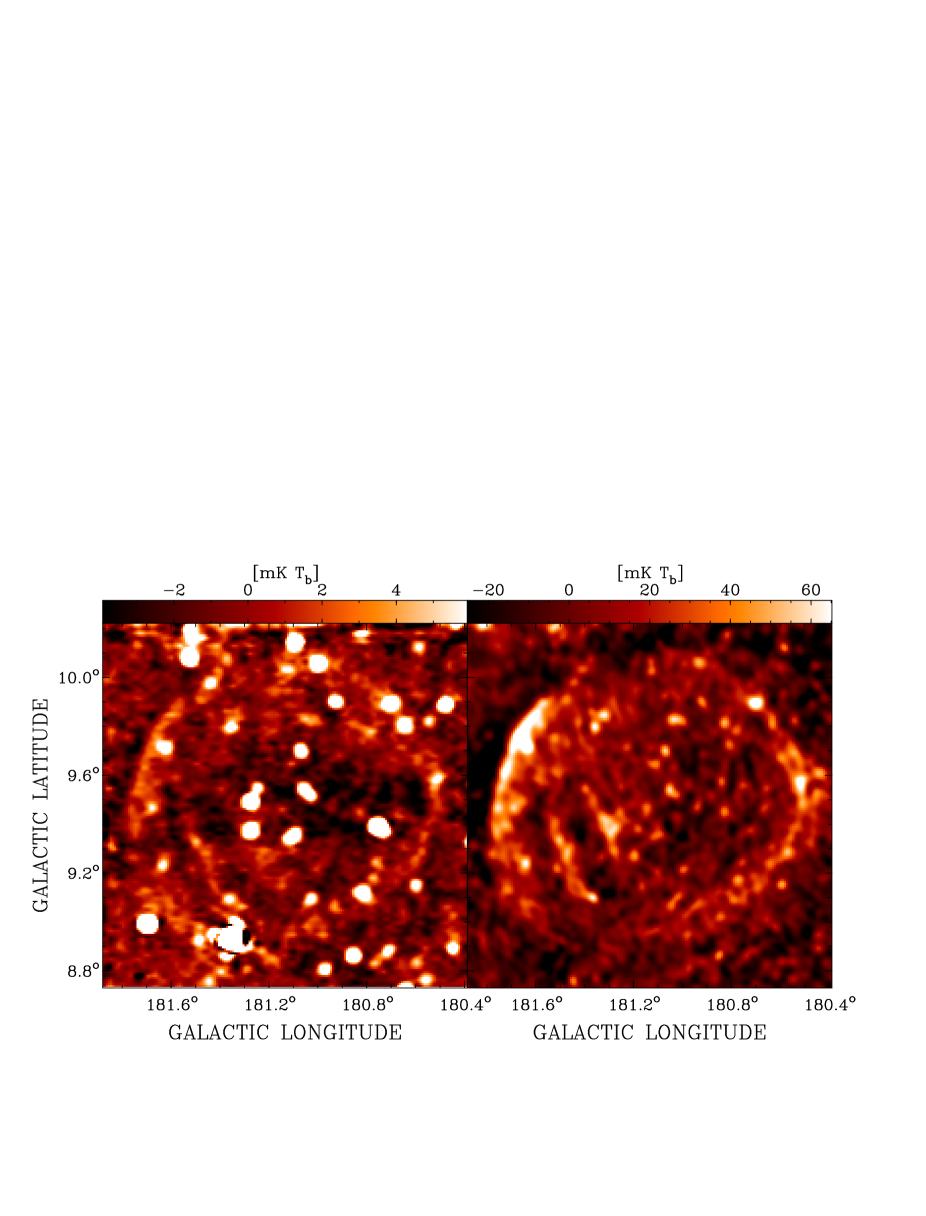
Maps of total intensity at 4850 MHz and 1420 MHz of the supernova remnant candidate G181.1+9.5 are shown in Figs. 2 and 4. In Fig. 2 the 1420-MHz image is shown at the original resolution of the DRAO ST with short spacing data from the EMLS included. G181.1+9.5 is an extremely low-surface brightness almost circular object with thin shells on both sides. It confuses with an emission plateau that extends from the top of the source to the south.
In Fig. 4, more details of the overall structure are obvious. At both frequencies, the candidate SNR is barely visible above the background emission, indicating that we are close to the confusion limit. In addition to the two shells, two arc-like features are visible to the lower left on the inside. Their morphology strongly suggests that they are related to G181.1+9.5. The full diameter of G181.1+9.5 is about . For a more detailed discussion of the physical scale of G181.1+9.5 see Sect. 4.2. Due to the low surface-brightness, the confusion with faint point-like sources, and a varying background, it is not possible to determine reliable integrated flux densities at either frequency. But the most prominent part of the SNR, the Eastern shell, is about 90 - 100 mK above background at 1420 MHz and about 4 - 5 mK at 4850 MHz. This indicates a spectral index (, : flux density, : frequency) between 0.3 and 0.6, typical for a shell-type SNR.
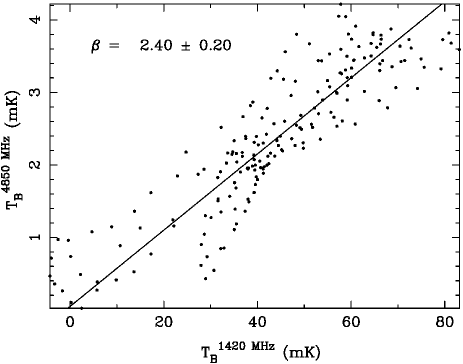
We determined a more reliable spectral index by calculating “TT-Plots” over the more prominent Eastern shell (Fig. 5). This spectral-index determination method is described in detail in Turtle et al. (1962). TT-plots give reliable results for spectral indices of small-scale emission structures on-top of diffuse extended emission. The TT-plot (see Fig. 5) results in a temperature spectral index of . This translates to a flux-density spectral index of () and confirms the non-thermal nature of this part of G181.1+9.5. However, both methods produce results with large uncertainties.
3.2 Linearly Polarized Emission from G181.1+9.5
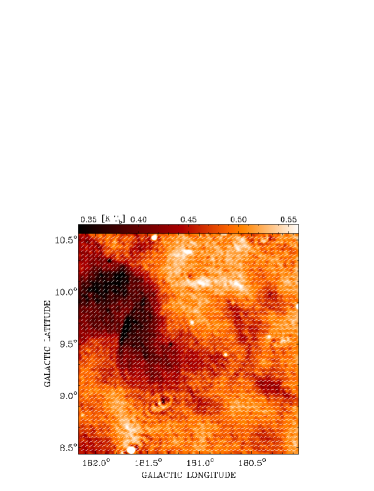
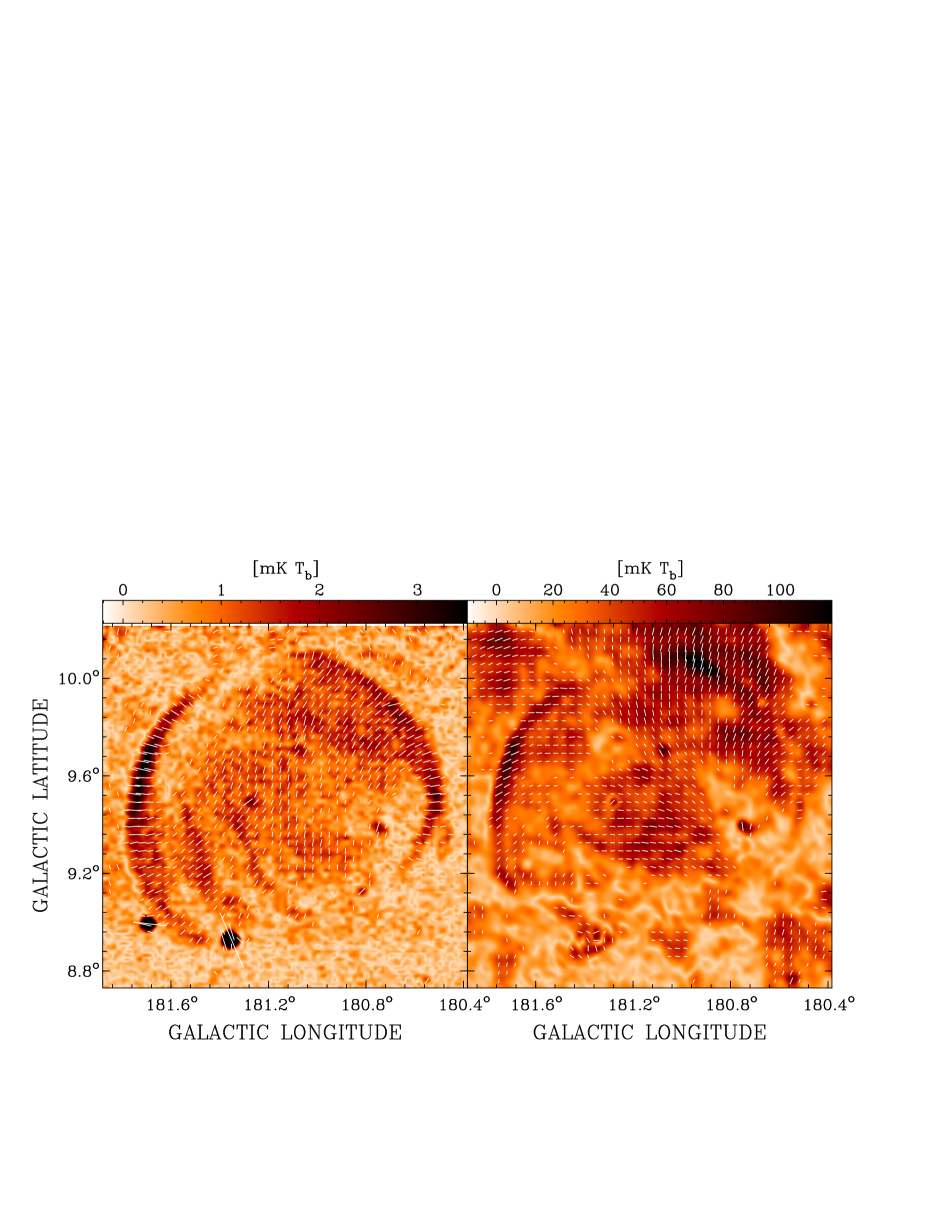
Maps of polarized intensity () with overlaid observed polarization vectors are shown in Figs. 3 and 6. In Fig. 3 the 1420-MHz and 4850-MHz images are shown at the original resolution with short spacing data included. In all maps, the polarized intensity was corrected for the so-called first order noise bias (e.g. Wardle & Kronberg, 1974):
| (1) |
Here, is the rms noise in the Q and U maps.
The polarized-intensity emission of G181.1+9.5 at 1420 MHz and 4850 MHz is seen “in absorption” relative to the bright background polarization in this direction of our Galaxy (Figure 3). G181.1+9.5 seems to be located at the high-longitude outskirts of the so-called Fan region, a major feature of the linearly polarized sky at radio frequencies that is visible above the Galactic plane in the second quadrant of our Galaxy (e.g. see Fig. 11 in Wolleben et al., 2006). In this direction of the Galaxy, the Fan region shows a surface brightness of about 0.5 K at 1420 MHz in polarized intensity (see Fig. 3) compared to less than 0.1 K for G181.1+9.5. At 4850 MHz, the background is about 6 mK compared to maybe 2 - 3 mK for G181.1+9.5. At both frequencies, the polarization angles must be quite different so that the polarized emission averages out and gives the impression that the polarized signal of the SNR is absorbed.
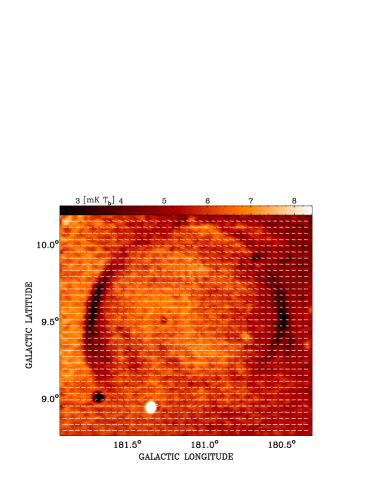
The maps shown in Fig. 6 do not contain large-scale emission information so that most of the polarized intensity is seen in emission, in particular at 4850 MHz. At 1420 MHz, there are still polarization features outside of the remnant that seem to be unrelated. Those features could indicate fluctuations in the Fan region, that appear on angular scales visible to the DRAO ST. Unfortunately, there are also polarization features projected inside G181.1+9.5, which could be background features or those parts of the SNR that are either moving towards us or away from us. Therefore, a comparison of polarization angles between 4850 MHz and 1420 MHz to determine rotation measures (RMs) is quite challenging.
The rotation measure is defined by:
| (2) |
where (rad) is the observed polarization angle at wavelength (m) and (rad) represents the intrinsic unrotated polarization angle. RM is related to the magnetic field parallel to the line of sight, the electron density , and the path-length by:
| (3) |
Because of the low signal-to-noise ratio in the total-power maps, we cannot determine precise values for the percentage polarization. But a crude comparison of the surface brightness of the eastern shell indicates a percentage polarization of 70 to 80 % for the entire eastern shell at 4850 MHz. At 1420 MHz, the upper part seems to be slightly lower polarized with 60 to 70 % polarization while the lower part shows the same 70 to 80 % we found at 4850 MHz.
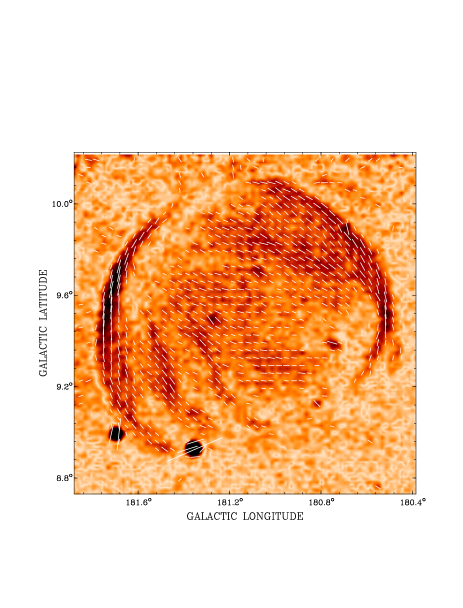
At 4850 MHz, we can clearly see the two prominent shells and the two arc-like features inside the SNR (Figure 6). There is also some diffuse emission in the interior. The polarization vectors are radial relative to all shells and arcs, indicating tangential magnetic fields, which is expected for a mature shell-type supernova remnant. The integrated polarized emission at 4850 MHz is mJy. Assuming a maximum possible fractional polarization of 70 % as the average for the synchrotron emission from the entire source this indicates a lower limit of 210 mJy for the integrated total-power emission at 4850 MHz. Extrapolating this with a spectral index of to 1 GHz gives 400 mJy. With a full diameter of , this results in the lowest 1 GHz radio surface brightness ever observed for a SNR of W m-2 Hz-1 sr-1.
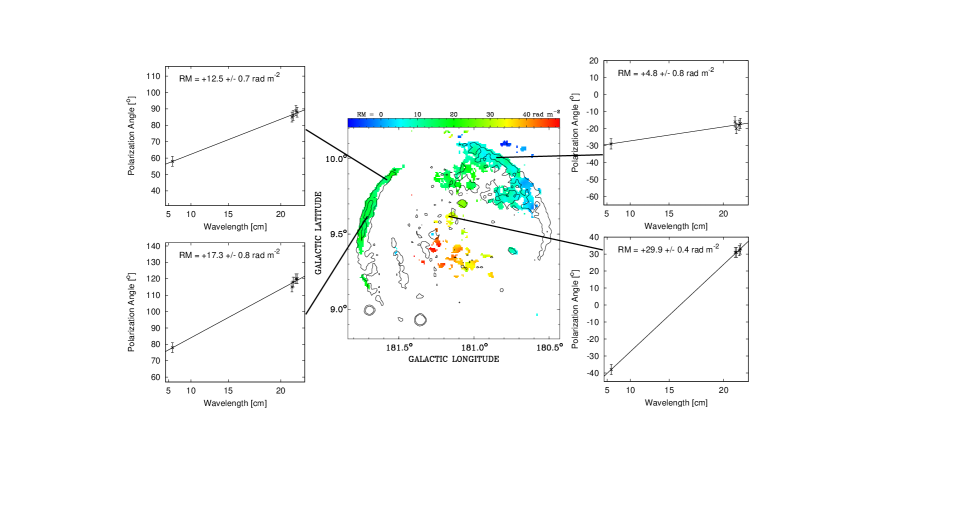
Despite the difficulties, we calculated a RM map between 4850 MHz and the four bands around 1420 MHz after convolving the Stokes and maps at the four DRAO ST bands to the same resolution as the 4850-MHz observation of (Fig. 7). We added four sample RM diagrams to Fig. 7 to demonstrate the quality of the results.
The Eastern shell of G181.1+9.5 is quite distinct from other polarization features at both frequencies. Here we can easily compare the observed polarization angles at all five frequencies. We derive an average RM over this entire shell of +15 rad m-2 with variations of rad m-2. There is no distinct gradient or other tendency detectable over this shell.
In the diffuse emission at the centre of G181.1+9.5, the RMs are higher up to a maximum of +40 rad m-2 and on the Western shell, we find RMs between 0 and +5 rad m-2. The latter values should be considered with reserve, since we cannot estimate the influence of the background polarization visible outside and maybe superimposed on the Western shell. Again, no gradients or any other tendencies are observed. None of these values are significant for the 4850-MHz observations, even an RM of +40 rad m-2 would rotate the polarization angle by less than .
Therefore, we neglect the affects of Faraday rotation on the polarization angle observed at 4850 MHz and present the magnetic field direction projected to the plane of the sky by rotating the observed E-vectors by . The resulting map is shown in Fig. 8. The derived magnetic field configuration is tangential to the outer shells and the two arc-like filaments in the interior, as expected for mature shell-type supernova remnants. The diffuse interior emission shows magnetic fields that are overall parallel to the shells as expected from simulations (e.g. Kothes & Brown, 2009; West et al., 2016). This is a strong indicator of the magnetic field direction around G181.1+9.5.
3.3 Detection in the ROSAT All-Sky-Survey
We made a literature and archival search to find signatures of this SNR candidate at other wavelength. We were successful when we inspected data from the ROSAT All-Sky Survey database (RASS, Voges et al., 1999). G181.1+9.5 is detectable in the RASS hard-energy band (0.5 to 2.0 keV). In the soft band, the noise is probably too high and some of the emission might be absorbed by the foreground. In Fig. 9, we display the polarized-intensity image with X-ray contours overlaid. As a comparison, we left a known compact source in the field of view of the image. 1RXS J062246.2+321853 is an unidentified compact X-ray source from the RASS (Voges et al., 1999) with about 30 counts in the 0.5 to 2.0 keV energy range. It can be seen at the bottom edge of the image in Fig. 9.
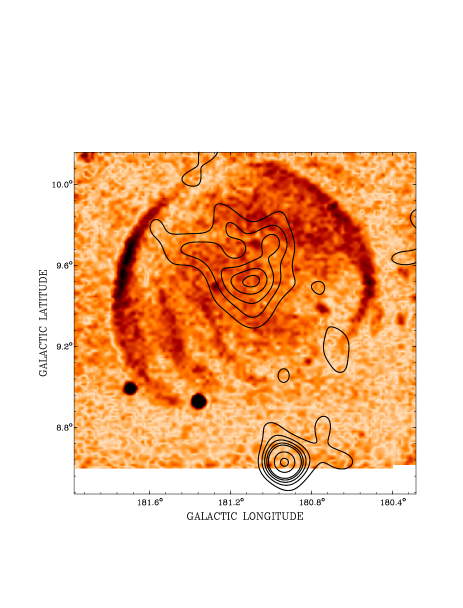
The peak of the X-ray emission is exactly at the geometrical centre of G181.1+9.5 at a signal-to-noise ratio of about 12 in Fig. 9. Even after the convolution to the emission shows a lot of substructure indicating diffuse extended emission filling a significant part of the SNR candidate’s interior. This is very similar to the discovery of the CGPS SNRs G85.40.7 and G85.90.6 (Kothes et al., 2001), which also displayed faint X-ray emission in the high-energy band of the RASS. Follow-up observations of this X-ray signature with XMM and CHANDRA found diffuse X-ray emission from the shock-heated supernova ejecta (Jackson et al., 2008). The chemical composition of the ejecta from G85.90.6 identified this SNR as the remnant of a type Ia supernova explosion.
3.4 The HI Environment of G181.1+9.5
The majority of 21 cm line emission from neutral hydrogen in the field towards G181.1+9.5 is found in two distinct velocity regimes: disk and halo gas (+15 km s25 km s-1), and the realm of the high-velocity clouds in the region (75 km s95 km s-1). Because of the compression of long path-lengths into small velocity intervals inherent in anti-centre lines of sight, the best that we can say about the location of G181.1+9.5 is either that it is found in the disk-halo and therefore is moving normally with circular Galactic rotation, or it is found among the HVCs (which are blind to Galactic rotation) and moving with them. Therefore, a search of the H i data-cube for correspondence between the continuum shell and hydrogen emission features may lead us to one or the other location for G181.1+9.5.
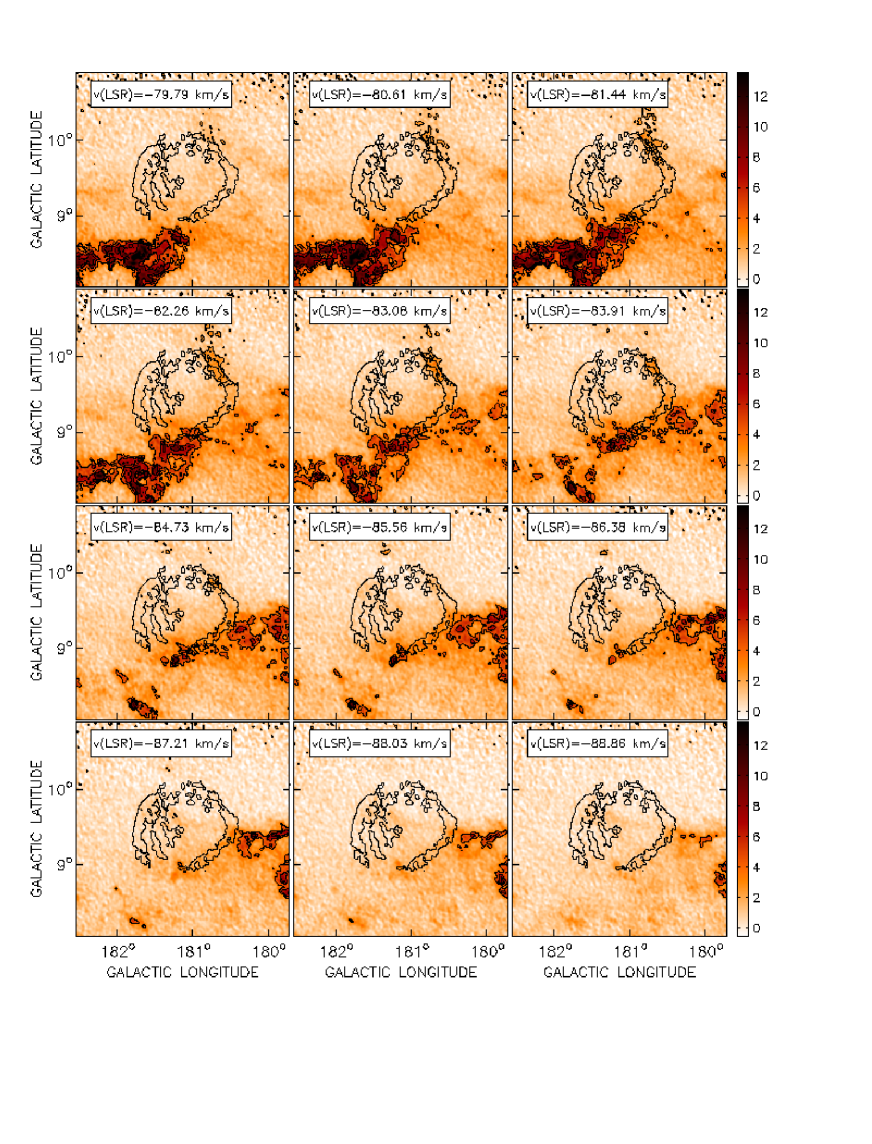
A search through the data-cube reveals no obvious correlation with the SNR and disk-halo H i features. We find no cavities, no crescents of emission (such as swept-up gas by a stellar wind), no partial/complete bubbles enclosing the circular SNR shell, and no discrete isolated clouds appearing anywhere around the limb. This does not entirely rule out a connection with the disk and/or the halo gas. We do find a more convincing correlation between the shell and HVCs near 80 km s-1. A detailed channel-by-channel view in Fig. 10 shows HVC clouds in emission, seen just on the outer edge of the Northwest shell, appearing at 1-to-2 o’clock in channels from 79.79 km s-1 to 84.73 km s-1. HVC clouds also appear at the shell’s Western edge at about 4-o’clock (83.08 km s-1 to 88.03 km s-1), and around the projected Southern edge of the object (where no continuum shell is seen) from 80.61 km s-1 to about 85.56 km s-1. No H i clouds associated with the HVC region appear inside the shell at any velocity. Figure 11 displays an integrated H i map (averaged across the HVC velocities) showing the overall relationship of the shell with the clouds.
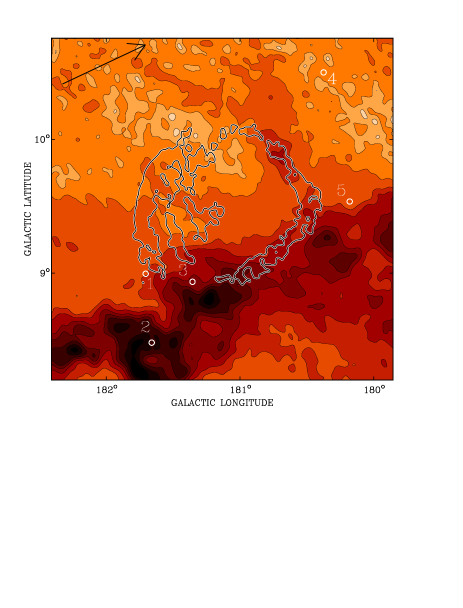
Further evidence for a connection between HVC H i and the object is found by tracing hydrogen in absorption at the shell’s periphery. The optical depth and density (cm-3) of the HVC gas in the environment around G181.1+9.5 can be estimated from H i continuum absorption lines towards unresolved continuum sources. Five appropriately bright sources are marked in Fig. 11 with white circles, and range in relative peak continuum brightness temperature (above background) from left-to-right: 22 K, 203 K, 188 K, 80 K, and 86 K (sources 1-5 respectively).
Absorption spectra for sources 1, 2, 3, and 5 are shown in Fig. 12. Only the range of velocities appropriate for the HVCs are plotted. We plot the dimensionless quantity:
| (4) |
Here is the radial velocity (relative to the Local Standard of Rest), is the brightness temperature observed at the continuum source’s position, and is the average around the continuum source. is the peak brightness temperature of the background continuum source measured at the same position as .
Source 1 is serendipitously found just on the Eastern edge of the shell. Even though it has the highest rms noise, the spectrum towards this source shows a line with a peak optical depth 0.2600.064 at 76.5 km s-1, and is similar to that of the bright Source 2 (0.2960.010), which is seen absorbed by a HVC in emission half a degree south of G181.1+9.5. The bright Source 3 is just off the projected Southern edge of the object, where no continuum shell is seen, and shows essentially no absorption at HVC velocities. Finally the two other Sources 4 and 5 which are well west of G181.1+9.5 and in the inter-cloud region of the HVC complex also show no significant absorption lines at the velocities of the HVCs (only the spectrum towards Source 5 is shown in Fig. 12 to demonstrate this).
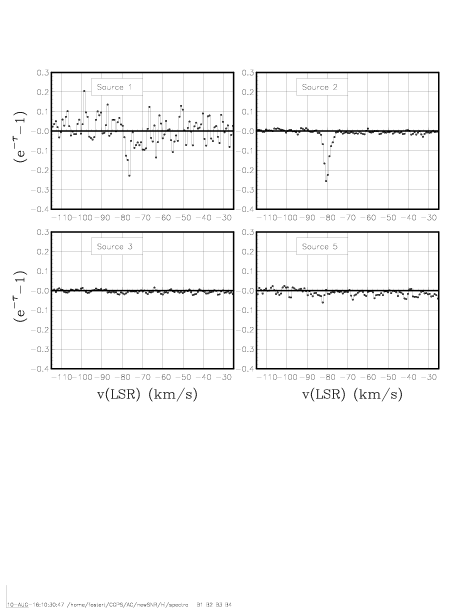
Thus, there appears to be cold H i immediately off the shell’s Eastern edge (the location of Source 1). In addition the remnant seems to be cut off at the bottom where the HVC clouds are at their brightest, indicating it could be limiting the expansion or breaking up the remnant there. This and the correspondence of H i emission with the shell of G181.1+9.5 leads us to conclude that this object is interacting with the HVC complex in the area.
4 Discussion
The newly discovered radio source G181.1+9.5 shows the typical radio morphology of a shell-type SNR. We found strong indication that the spectrum of the Eastern shell is non-thermal. The entire source G181.1+9.5 is highly linearly polarized with the Eastern shell showing a percentage polarization at the maximum expected for synchrotron emission. In fact, extrapolating the fractional polarization we found in the Eastern shell to the rest of the object, makes this SNR the highest polarized shell-type SNR known, closely followed by G107.51.5 (Kothes, 2003), G156.2+5.7 (Reich et al., 1992; Xu et al., 2007), and G182.4+4.3 (Kothes et al., 1998), a highly polarized supernova remnant just about below G181.1+9.5 in the Galactic plane. The intrinsic polarization angles indicate a tangential magnetic field within the shell and the interior filaments of G181.1+9.5. We also found faint diffuse X-ray emission in the RASS energy band between 0.5 and 2.0 keV, indicative of shocked heated ejecta. Therefore, we conclude that G181.1+9.5 is a mature shell-type supernova remnant.
The two polarized filaments inside the outside shells are likely related features, indicative of a highly structured environment. The two filaments are visible in total power at both frequencies and in polarization at 4850 MHz. They appear to be quite thin and contain a tangential magnetic field, therefore they must be highly compressed and moving mostly sideways relative to the line of sight. Viewed from the geometric centre, they expand towards the Southern part of the Eastern shell which shows a lower surface brightness than the Northern part. Therefore these two filaments are likely features inside the two major shells, which mark the impact of the shockwave on small clouds. However, we did not find any evidence of HI emission from clouds inside the SNR.
4.1 Distance and Environment of G181.1+9.5
The magnetic field inside the SNR G181.1+9.5 is tangential to all of its shells and filaments and shows in the centre an orientation that is mostly parallel to the direction of the shells (see Fig. 8), which indicates a magnetic field with an angle of about with the Galactic plane. According to the simulations of Kothes & Brown (2009), this indicates that the SNR is expanding into an ambient magnetic field with the same orientation. The Fan region, however, contains a magnetic field that is parallel to the Galactic plane, which can be nicely seen in the images of the WMAP observations (Page et al., 2007), but also in our 4850-MHz polarized intensity map including WMAP-based large-scale correction (see Fig. 3). Even at a frequency of 1420 MHz the Fan region is more than 30 % linearly polarized (Figs. 2 and 3) indicating this synchrotron emission originates from a long line of sight. Therefore, G181.1+9.5 cannot be somewhere in the interstellar medium along the line of sight, but must be either very far away in the halo, which could have a different magnetic field orientation, or related to a distinct feature that is not part of the Fan region. A location in the halo is unlikely, because at a large distance the SNR would be unreasonably large and the ambient density would be too low. This indicates a correlation with the HVC complexes, since those could have magnetic fields independent of the large-scale Galactic magnetic field. In fact, simulations by Santillán et al. (1999) show that HVCs colliding with the Galactic disk can significantly deform the magnetic field, which could even be perpendicular to the plane for some time.
We have shown in Sect. 3.4 that G181.1+9.5 is very likely related to HVC gas that is part of the huge Anti – Centre Shell identified by Heiles (1984), which extends for about 30 in the sky. Kulkarni & Mathieu (1986) used Ca K absorption features of stars with known distances and found that the Anti-Centre Shell must be more distant than 0.5 kpc. The maximum distance is 2.5 kpc, or may be even a little larger depending on the abundance of Ca. We adopt the centre of those limits, 1.5 kpc, as the heliocentric distance to G181.1+9.5 in order to quantitatively estimate some of its physical characteristics.
The density of the faint H i emission at the location of Source 1 is found from:
| (5) |
where (km s-1) is the velocity interval that corresponds to a path interval along the line-of-sight of (cm). Since we don’t know this a priori for the HVC region, we approximate here as the ratio of the velocity-width of the absorption feature (approximately 3.3 km s-1) to the spatial width of the absorbing cloud on the sky. We estimate this spatial width 7-12 pc by eye from the average angular width of HVC emission features related to this area of the shell ( - ), and the adopted distance of 1.5 kpc. The factor corrects the column density for optically thick H i gas not seen in emission. The density calculated from Eq. 5 is 0.9-1.5 cm-3. Since Source 1 is located on the sky ahead of the shock, we take this as the ambient density of the medium into which G181.1+9.5 evolves. The spherical structure of G181.1+9.5 and the symmetry of the radio shells also indicate that the ambient medium density of the SNR is not varying significantly.
4.2 Characteristics of the SNR G181.1+9.5
We produced a radial profile from the 1420-MHz total-power map at full resolution, without the EMLS data added in, over the Eastern shell only. Compact sources have been removed from the map. The amplitudes of the profile are ring-averaged flux densities, centred at the geometric centre of G181.1+9.5 ( and ). Individual rings are wide. This radial profile is shown in Fig. 13.
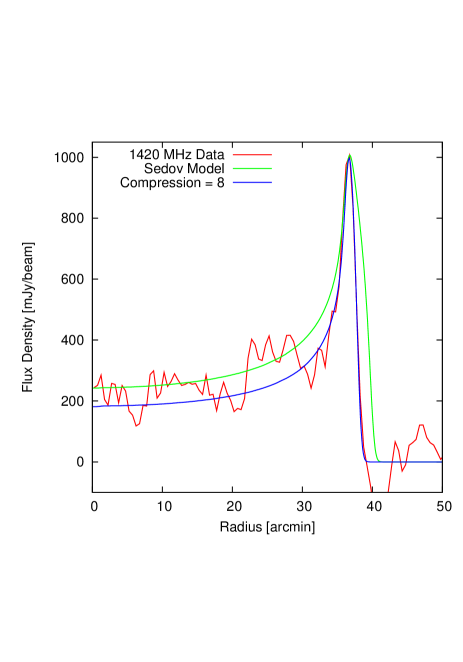
G181.1+9.5 has an angular radius of , which at a distance of 1.5 kpc translates to a physical radius of about 16 pc. We simulated maps of SNRs with different compression ratios and calculated radial profiles after convolution to the appropriate resolution. In those simulations, it has been assumed that magnetic field strength and relativistic electron distribution are constant within the SNR’s shell. If the supernova remnant is in the so-called energy-preserving Sedov phase of its evolution, the compression ratio should be 4 (Sedov, 1959). It is obvious from Fig. 13 that the compression in the Eastern shell of G181.1+9.5 is higher. We get a best agreement between model and observation for compression ratios of 8 and higher. At this point, the shell is apparently not resolved any more, which means that the width of the shell in the profile is dominated by the resolution of our observations. Nevertheless, it is obvious that G181.1+9.5 must be beyond the Sedov phase in the so-called radiative pressure-driven snowplow (PDS) phase, when SNRs become dominated by radiative energy losses.
We used the simulations by Cioffi et al. (1988) to determine characteristics of G181.1+9.5 assuming it is in the transition between the Sedov and the PDS phase. At the beginning of the PDS phase, Cioffi et al. (1988) determined the following equations for the radius , the velocity , and the age of the SNR , assuming solar abundances:
| (6) |
| (7) |
| (8) |
Here, is the explosion energy of the supernova in erg and the ambient number density in cm-3. Assuming that G181.1+9.5 has indeed entered the PDS phase and the explosion energy is the canonical erg, we calculate for the ambient number density a minimum of cm-3, for the age a maximum of yr, and for the current expansion velocity a minimum of km s-1. The mass of the material swept up by the supernova shock wave would be M⊙. The constrains on the average ambient density very well agree with the estimates for the density in the surrounding HVCs.
Although all characteristics estimated are typical values that would be expected from a normal mature shell-type supernova remnant, it is not clear why this SNR is so faint.
5 Conclusions
This paper presents radio observations and analysis of an uncatalogued object found in the high-latitude region of the Galactic plane. New data at 1420 MHz and 4850 MHz show the object as a highly symmetric circular shell with a radio spectrum indicative of non-thermal emission. The shell is significantly polarized at radio frequencies up to 4850 MHz, and has diffuse X-ray emission situated in its precise geometric centre. Based on these observed characteristics, we classify G181.1+9.5 as a new supernova remnant. Radio polarizaton maps at two frequencies demonstrates that the SNR has an intrinsic magnetic field that is tangential to its shell, and modelling of the shell’s thin edge shows this SNR has evolved beyond the Sedov phase into the radiative (or “snowplow”) phase.
Based on its morphological association with hydrogen clouds and diffuse emission in the Anticentre Chain of HVCs we suggest G181.1+9.5 is at the same distance as the HVC complex, about 1.5 kpc. The diameter of the shell is thus 32 pc. Its location far away from any star formation activity, high above the Gaactic plane, indicates a supernova of type Ia and therefore a White Dwarf as the progenitor star that travelled far away from its place of birth before it exploded.
Aside from its normal characteristics for a SNR, G181.1+9.5 is a remarkable object. It is the faintest SNR yet observed, with a radio surface brightness at 1 GHz of 1.110-23 W m-2 Hz-1 sr-1, a factor of three below the previous faintest known SNRs of Foster et al. (2013). G181.1+9.5 presents a rare opportunity to study SNR evolution and offshoot topics (such as reverse-shock heating of explosion ejecta, suggested by the X-rays in the object’s centre) in a uniquely pristine environment that is much different from the Galactic plane ISM. Certainly, more follow-up observations of G181.1+9.5 are needed to confirm its remarkable attributes, particularly in optical and X-ray bands, and we hope this discovery paper inspires and facilitates new observations by the ISM community of this unique object.
Acknowledgements.
We wish to thank Dr. Tom Landecker (DRAO) and Prof. Ernst Fürst (MPIfR) for careful reading of the manuscript. Special thanks go to the Effelsberg station manager, Dr. Alexander Kraus, for repeated scheduling of the difficult 4850-MHz observation at best weather conditions. We thank Dr. Jürgen Kerp for helpful discussions on HVCs. We also thank Dr. Andrew Gray of DRAO for scheduling two additional DRAO synthesis fields to map the SNR shell with more sensitivity after its initial discovery. The Dominion Radio Astrophysical Observatory is a National Facility operated by the National Research Council Canada. We have made use of the ROSAT Data Archive of the Max-Planck-Institut für extraterrestrische Physik (MPE) at Garching, Germany. The data are partly based on observations with the 100-m telescope of the MPIfR (Max-Planck-Institut für Radioastronomie) at Effelsberg.References
- Bennett et al. (2013) Bennett, C. L., Larson, D., Weiland, J. L., et al. 2013, ApJS, 208, 20
- Cioffi et al. (1988) Cioffi, D. F., McKee, C. F., & Bertschinger, E. 1988, ApJ, 334, 252
- Emerson & Gräve (1988) Emerson, D. T. & Gräve, R. 1988, A&A, 190, 353
- Foster & Brunt (2015) Foster, T. & Brunt, C. M. 2015, AJ, 150, 147
- Foster et al. (2013) Foster, T. J., Cooper, B., Reich, W., Kothes, R., & West, J. 2013, A&A, 549, A107
- Gerbrandt et al. (2014) Gerbrandt, S., Foster, T. J., Kothes, R., Geisbüsch, J., & Tung, A. 2014, A&A, 566, A76
- Haslam (1974) Haslam, C. G. T. 1974, A&AS, 15, 333
- Heiles (1984) Heiles, C. 1984, ApJS, 55, 585
- Jackson et al. (2008) Jackson, M. S., Safi-Harb, S., Kothes, R., & Foster, T. 2008, ApJ, 674, 936
- Kothes (2003) Kothes, R. 2003, A&A, 408, 187
- Kothes & Brown (2009) Kothes, R. & Brown, J.-A. 2009, in IAU Symposium, Vol. 259, Cosmic Magnetic Fields: From Planets, to Stars and Galaxies, ed. K. G. Strassmeier, A. G. Kosovichev, & J. E. Beckman, 75–80
- Kothes et al. (1998) Kothes, R., Fürst, E., & Reich, W. 1998, A&A, 331, 661
- Kothes et al. (2001) Kothes, R., Landecker, T. L., Foster, T., & Leahy, D. A. 2001, A&A, 376, 641
- Kothes et al. (2014) Kothes, R., Sun, X. H., Reich, W., & Foster, T. J. 2014, ApJ, 784, L26
- Kothes et al. (2005) Kothes, R., Uyanıker, B., & Reid, R. I. 2005, A&A, 444, 871
- Kulkarni et al. (1985) Kulkarni, S. R., Heiles, C., & Dickey, J. M. 1985, ApJ, 291, 716
- Kulkarni & Mathieu (1986) Kulkarni, S. R. & Mathieu, R. 1986, Ap&SS, 118, 531
- Landecker et al. (2000) Landecker, T. L., Dewdney, P. E., Burgess, T. A., et al. 2000, A&AS, 145, 509
- Landecker et al. (2010) Landecker, T. L., Reich, W., Reid, R. I., et al. 2010, A&A, 520, A80
- Page et al. (2007) Page, L., Hinshaw, G., Komatsu, E., et al. 2007, ApJS, 170, 335
- Reich & Reich (1986) Reich, P. & Reich, W. 1986, A&AS, 63, 205
- Reich et al. (1992) Reich, W., Fürst, E., & Arnal, E. M. 1992, A&A, 256, 214
- Reich et al. (2004) Reich, W., Fürst, E., Reich, P., et al. 2004, in The Magnetized Interstellar Medium, ed. B. Uyaniker, W. Reich, & R. Wielebinski, 45–50
- Santillán et al. (1999) Santillán, A., Franco, J., Martos, M., & Kim, J. 1999, ApJ, 515, 657
- Sedov (1959) Sedov, L. I. 1959, Similarity and Dimensional Methods in Mechanics (New York: Academic Press)
- Sofue & Reich (1979) Sofue, Y. & Reich, W. 1979, A&AS, 38, 251
- Sun et al. (2007) Sun, X. H., Han, J. L., Reich, W., et al. 2007, A&A, 463, 993
- Tamanaha (1997) Tamanaha, C. M. 1997, ApJS, 109, 139
- Taylor et al. (2003) Taylor, A. R., Gibson, S. J., Peracaula, M., et al. 2003, AJ, 125, 3145
- Tian et al. (2007) Tian, W. W., Leahy, D. A., & Foster, T. J. 2007, A&A, 465, 907
- Turtle et al. (1962) Turtle, A. J., Pugh, J. F., Kenderdine, S., & Pauliny-Toth, I. I. K. 1962, MNRAS, 124, 297
- Voges et al. (1999) Voges, W., Aschenbach, B., Boller, T., et al. 1999, A&A, 349, 389
- Wardle & Kronberg (1974) Wardle, J. F. C. & Kronberg, P. P. 1974, ApJ, 194, 249
- West et al. (2016) West, J. L., Safi-Harb, S., Jaffe, T., et al. 2016, A&A, 587, A148
- Willis (1999) Willis, A. G. 1999, A&AS, 136, 603
- Winkel et al. (2016) Winkel, B., Kerp, J., Flöer, L., et al. 2016, A&A, 585, A41
- Wolleben et al. (2006) Wolleben, M., Landecker, T. L., Reich, W., & Wielebinski, R. 2006, A&A, 448, 411
- Xu et al. (2007) Xu, J. W., Han, J. L., Sun, X. H., et al. 2007, A&A, 470, 969