Demographical Priors for Health Conditions Diagnosis Using Medicare Data
Abstract
This paper presents an example of how demographical characteristics of patients influence their susceptibility to certain medical conditions. In this paper, we investigate the association of health conditions to age of patients in a heterogeneous population. We show that besides the symptoms a patients is having, the age has the potential of aiding the diagnostic process in hospitals. Working with Electronic Health Records (EHR), we show that medical conditions group into clusters that share distinctive population age densities. We use Electronic Health Records from Brazil for a period of 15 months from March of 2013 to July of 2014. The number of patients in the data is 1.7 million patients and the number of records is 47 million records. The findings have the potential of helping in a setting where an automated system undergoes the task of predicting the condition of a patient given their symptoms and demographical information.
1 Introduction
Studies of comorbidities and diseases correlations have been mainly focusing on few diseases using techniques of hypothesis-testing camilo2004seizures ; murray2012illness ; murtagh2011trajectories ; murtagh2008illness ; teno2001dying ; finkelstein2009chronic or with focus on certain co-morbidities to index diseasespetri2010data . Recently, researchers started studying massive health records to uncover the associations and patterns in complex diseases demonstrating the potentials of studying health records jensen2012mining ; blair2013nondegenerate ; murtagh2011trajectories ; chen2009cancer . However, medical conditions data originate from various sources have a narrowed set of the general population of patients. Studies used statistical techniques to produce fine grained patient stratification and disease co-occurence statistic of patients in the Sct. Hans Hospital (the largest Danish psychiatric hospital) roque2011using . Studies used a network approach to analyze data covering 3 years of medical care claims, of patients who are 65 years or older, which biased the analysis towards the population of the elderlyhidalgo2009dynamic . However, recently studies were conducted on data of more heterogeneous populations. The studies focused on uncovering patterns centered on a small number of key diagnoses to detect diseases earlier in a patients life jensen2014temporal . Another study analyzed the structure of co-morbidity networks on five predefined age intervals of patients chmiel2014spreading .
The wisdom of doctors when it comes to assessing the susceptibility to medical conditions have been influenced by the years of practice and observation of many cases on daily basis. Doctors’ knowledge of the susceptibility of diseases to different ages/genders serves as an essential prior to perform diagnostics of incoming patients. Similar symptoms for patients might lead to different diagnosis depending on the age and gender of the patient, a patient who is 70 years old is more probable to be suffering a heart attack than that of a 10 years old even if both patients are suffering the symptom of chest pain. We show here that besides the symptoms a patient is having, age has the potential of significantly aiding the diagnostic process. In this paper, we aim at uncovering the relationship between health conditions and the age of a patient. We stratify health conditions that share similar population age densities.
2 Age Densities Signatures
The data used in the paper pertains to records of health insurance claims from Brazil for a period of 15 months from March of 2013 to July of 2014. The number of patients in the data is around 1.7 million patients. For each patient in the data, a log for each visit to the doctor is stored in the database. The database uses the International Classification of Diseases version 10 (ICD-10) world2004international . ICD-10 has a range of 23k codes each representing a health condition. The data includes the demographical attributes of the population (i.e. age and gender information of the patient). The total number of visit records in the data is about 6.6 million records.
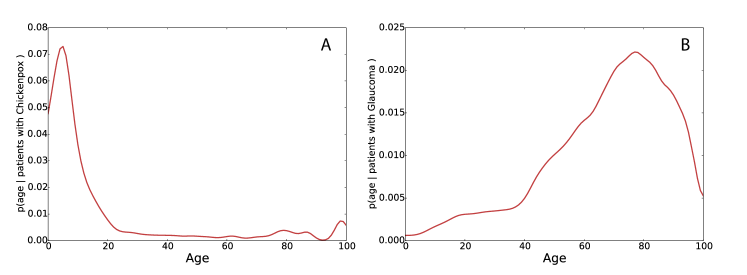
By inspection, ICD-10 codes have distinctive signatures of density on the age dimension that spans the various age groups from birth onward. Figure 1 shows example age density signatures of Chickenpox and Glaucoma. As expected, Glaucoma is more prevalent for the older age groups centers2011state while Chickenpox is more prevalent in younger age groupskliegman2016nelson ; centers2011epidemiology . The examples of the distributions hint that there is a pattern of higher likelihood of health conditions for certain age groups in contrast to others. The rest of the paper aims to investigate this further.
3 Hierarchal Clustering of Health Conditions
To uncover common patterns of the age distribution of ICD-10 codes, we used a Hierarchical Agglomeration Clustering (HAC) approach to group the codes based on the similarities of age distributions. Each code is represented by a vector of length 100 where each cell represents where is the set of patients with the condition on their records. The clusters are decided as the ones minimizing the variance of distances between codes in the cluster while maximizing the distance between the clusters (i.e. the ward minimum variance method) ward1963hierarchical .
HAC cluster vectors, where each vector is a representation of the probability mass function of a code in the data. The vector representation of the probability mass function of the ages of a ICD-10 code is as follows:
| (1) |
Where for a given code. At initialization, HAC assigns each vector object to a cluster, and sequentially merging them into clusters until all codes form one cluster. For measuring the distance between two vector representations of age density, we use euclidean distance. The Ward distance criterion of clusters is dependent on the within cluster distances and the across clusters distances. Ward algorithm is conservative when merging clusters, thus it tends to find very compact clusters ward1963hierarchical .
HAC provides a hierarchy structure of the clustered codes as illustrated in figure 2. To determine the number of clusters that best divide the data, we calculate the total within-cluster distances for from 1 to 20. The variance ratio drops as increase until it does not decrease significantly. We select that corresponds to the point where the total distances stops decreasing significantly. This method is known as the elbow curve method.
4 Results
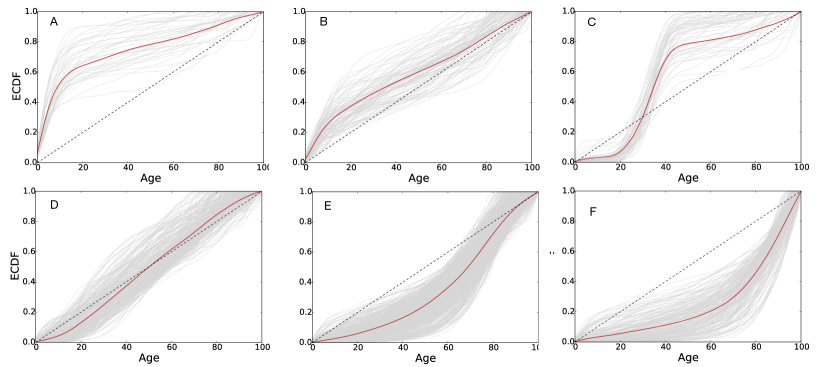
The age distribution of the codes clusters into six main clusters as shown in Figure 2. Clusters A and B show two clusters of codes having higher density towards the lower spectrum of age. Cluster C shows a group of codes that have age densities concentrated in the ages 20 to 40 years old. Cluster D has conditions that are almost uniformly distributed across the ages. Cluster E had codes with densities concentrating in the range of ages after 60 and cluster F had codes with age densities concentrating after the ages of seventies years old.
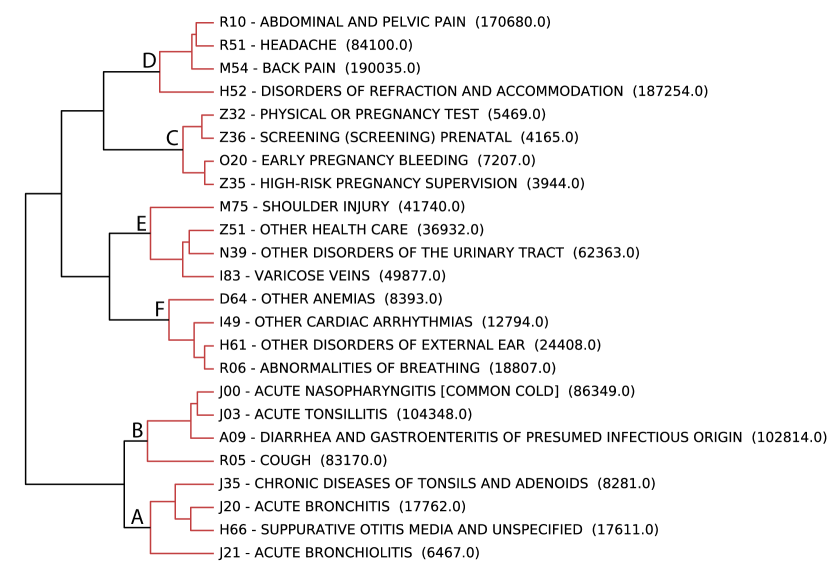
figure 3 illustrates a few examples of ICD-10 codes from the clusters discovered in the data. For each cluster, figure 3 shows four example conditions. The branches are labeled by their clusters from A to F. The example codes are the highest four in terms of their frequency in occurrence in the data. Within cluster A, J20 Acute Bronchitis and H66 Suppurative Otitis were observed in 17 thousand patients each and both have a concentration towards the lower ages as shown. Cluster B has A09 Diarrhea and J03 Acute Tonsillitis both with around 100 thousand patients. The noticed increase of the number of patients is due to the non-uniform population age distribution where the majority of the population is in the age range of early and middle adulthood. Cluster C has the conditions Z35 Early Pregnancy Bleeding with around 7 thousand patients and Z32 Physical and Pregnancy Test with 5 thousands patients. In general, we find that conditions in cluster C pertain to pregnancy, childbirth and postpartum conditions explaining the concentrated age distribution in figure 2-C. Cluster D has M54 Back Pain with 190 thousands patients and R10 Abdominal and Pelvic Pain with 170 thousand patients. We notice that as the clusters have more density around the peak of the age distribution of the population, the number of patients per code in the clusters becomes relatively high. Cluster E with age density more towards the elderly has R08 Abnormalities of Breathing as the most common with around 19 thousands patients and I50 Head Injuries in 8 thousand patients, also notice that Heart Failure comes third with around 7 thousands patients. Cluster F with age density well into the elderly age has M75 Shoulder Injury with 41 thousands patients and N40 Prostatic Hyperplasia with around 28 thousands patients.
5 Conclusion
In this paper, we show an example where demographical characteristics of patients namely the age of a patient could potentially aid the diagnostic process. Other demographical characteristics such as gender, race, income level among others have the potential in aiding the diagnostic process for incoming patients. The goal in this paper is to help build such age susceptibility prior knowledge for automated diagnostics in a setting where an automated system goes through the task of predicting the condition of a patient given their symptoms. Upon the availability of data, the study of the association of demographical characteristics such as gender, race and income level has the potential of uncovering useful prior knowledge to encode in models for predicting medical conditions given symptoms and demographical characteristics.
References
- [1] David R Blair, Christopher S Lyttle, Jonathan M Mortensen, Charles F Bearden, Anders Boeck Jensen, Hossein Khiabanian, Rachel Melamed, Raul Rabadan, Elmer V Bernstam, Søren Brunak, et al. A nondegenerate code of deleterious variants in mendelian loci contributes to complex disease risk. Cell, 155(1):70–80, 2013.
- [2] Osvaldo Camilo and Larry B Goldstein. Seizures and epilepsy after ischemic stroke. Stroke, 35(7):1769–1775, 2004.
- [3] LL Chen, N Blumm, NA Christakis, AL Barabasi, and Thomas Steve Deisboeck. Cancer metastasis networks and the prediction of progression patterns. British journal of cancer, 101(5):749–758, 2009.
- [4] Anna Chmiel, Peter Klimek, and Stefan Thurner. Spreading of diseases through comorbidity networks across life and gender. New Journal of Physics, 16(11):115013, 2014.
- [5] Joseph Finkelstein, Eunme Cha, and Steven M Scharf. Chronic obstructive pulmonary disease as an independent risk factor for cardiovascular morbidity. International journal of chronic obstructive pulmonary disease, 4:337, 2009.
- [6] Centers for Disease Control, Prevention, et al. Epidemiology and prevention of vaccine-preventable diseases. Washington DC: Public Health Foundation, 12, 2011.
- [7] Centers for Disease Control, Prevention, et al. The state of vision, aging, and public health in america. Atlanta: US Department of Health and Human Services, 2011.
- [8] César A Hidalgo, Nicholas Blumm, Albert-László Barabási, and Nicholas A Christakis. A dynamic network approach for the study of human phenotypes. PLoS Comput Biol, 5(4):e1000353, 2009.
- [9] Anders Boeck Jensen, Pope L Moseley, Tudor I Oprea, Sabrina Gade Ellesøe, Robert Eriksson, Henriette Schmock, Peter Bjødstrup Jensen, Lars Juhl Jensen, and Søren Brunak. Temporal disease trajectories condensed from population-wide registry data covering 6.2 million patients. Nature communications, 5, 2014.
- [10] Peter B Jensen, Lars J Jensen, and Søren Brunak. Mining electronic health records: towards better research applications and clinical care. Nature Reviews Genetics, 13(6):395–405, 2012.
- [11] Robert Kliegman, Richard E Behrman, Waldo E Nelson, et al. Nelson textbook of pediatrics, 2016.
- [12] Scott A Murray, Marilyn Kendall, Kirsty Boyd, and Aziz Sheikh. Illness trajectories and palliative care. Int Perspect Public Health Palliat Care, 30:2017–19, 2012.
- [13] Fliss EM Murtagh, Emma Murphy, and Neil S Sheerin. Illness trajectories: an important concept in the management of kidney failure. Nephrology Dialysis Transplantation, 23(12):3746–3748, 2008.
- [14] Fliss EM Murtagh, Neil S Sheerin, Julia Addington-Hall, and Irene J Higginson. Trajectories of illness in stage 5 chronic kidney disease: a longitudinal study of patient symptoms and concerns in the last year of life. Clinical Journal of the American Society of Nephrology, 6(7):1580–1590, 2011.
- [15] World Health Organization et al. International statistical classification of diseases and health related problems (The) ICD-10. PhD thesis, World Health Organization, 2004.
- [16] Hans Petri, Debra Maldonato, and Noah Jamie Robinson. Data-driven identification of co-morbidities associated with rheumatoid arthritis in a large us health plan claims database. BMC musculoskeletal disorders, 11(1):1, 2010.
- [17] Francisco S Roque, Peter B Jensen, Henriette Schmock, Marlene Dalgaard, Massimo Andreatta, Thomas Hansen, Karen Søeby, Søren Bredkjær, Anders Juul, Thomas Werge, et al. Using electronic patient records to discover disease correlations and stratify patient cohorts. PLoS Comput Biol, 7(8):e1002141, 2011.
- [18] Joan M Teno, Sherry Weitzen, Mary L Fennell, and Vincent Mor. Dying trajectory in the last year of life: does cancer trajectory fit other diseases? Journal of palliative medicine, 4(4):457–464, 2001.
- [19] Joe H Ward Jr. Hierarchical grouping to optimize an objective function. Journal of the American statistical association, 58(301):236–244, 1963.