Detection of a pair of prominent X-ray cavities in Abell 3847
Abstract
We present results obtained from a detailed analysis of a deep Chandra observation of the bright FRII radio galaxy 3C 444 in Abell 3847 cluster. A pair of huge X-ray cavities are detected along North and South directions from the centre of 3C 444. X-ray and radio images of the cluster reveal peculiar positioning of the cavities and radio bubbles. The radio lobes and X-ray cavities are apparently not spatially coincident and exhibit offsets by 61 kpc and 77 kpc from each other along the North and South directions, respectively. Radial temperature and density profiles reveal the presence of a cool core in the cluster. Imaging and spectral studies showed the removal of substantial amount of matter from the core of the cluster by the radio jets. A detailed analysis of the temperature and density profiles showed the presence of a rarely detected elliptical shock in the cluster. Detection of inflating cavities at an average distance of 55 kpc from the centre implies that the central engine feeds a remarkable amount of radio power (6.3 erg s-1 ) into the intra-cluster medium over 108 yr, the estimated age of cavity. The cooling luminosity of the cluster was estimated to be 8.30 erg s-1 , which confirms that the AGN power is sufficient to quench the cooling. Ratios of mass accretion rate to Eddington and Bondi rates were estimated to be 0.08 and 3.5 , respectively. This indicates that the black hole in the core of the cluster accretes matter through chaotic cold accretion.
keywords:
galaxies:active-galaxies:general-galaxies:individual: 3C 444:intra-cluster medium-X-rays:galaxies:clusters1 Introduction
Over the last three decades, observations of many clusters of galaxies showed that the X-ray emission is sharply peaked at the position of the central bright galaxy. A decrease in the temperature and an increase in the gas density towards the centre have been observed, suggesting the existence of cooling flows in the core of clusters (Fabian, 1994). In the densest central region with high cooling rate, the hot gas atmosphere continues to loose energy in the form of radiation (mostly in X-rays). The inferred short radiative cooling time towards (or at) the centre (shorter than the age of the cluster) indicates that the gas located at the centre cools faster than the gas in the outer part of the cluster and hence gas flows towards the core to maintain hydrostatic equilibrium (Fabian, 1994; Blanton et al., 2001a). The excess gas in the central region of the cluster subsonically flows towards the core and leads to the formation of cool clouds or stars (Fabian, 1994). As a result, the central massive galaxies continue to grow with time. The rate of cooling flow in nearby clusters is estimated to be in the range of 10 - 100 (Fabian, 1994). However, in a recent study of massive cluster SPT-CLJ2344-4243, the rate of cooling flow was found to be extremely high 3820 (McDonald et al., 2012).
Present day high resolution (spatial and spectral) observing facilities like Chandra and XMM-Newton have provided us with direct evidences of heating of the intra-cluster medium (ICM) in the cores of galaxy clusters through active galactic nuclei (AGN) feedback. Positive gradients in temperature profiles and short cooling time of the ICM in the core region are the indicative features of the cool-core clusters and have been confirmed through several studies in the last decade (Fukazawa et al., 1994; Kaastra et al., 2004; Hlavacek-Larrondo et al., 2012; McNamara et al., 2000; Sanders & Fabian, 2002; Rafferty et al., 2006; Fabian et al., 2006; Bîrzan et al., 2008; Dong et al., 2010; Dunn et al., 2010; O’Sullivan et al., 2011; David et al., 2009; Gitti et al., 2012). From recent studies, it is now established that the majority of cooling flow clusters host a powerful radio source associated with the central dominant galaxy. High resolution imaging and spectroscopic studies of cool core clusters using Chandra and XMM-Newton observatories revealed that the interaction of radio jets originating from the core of the cluster with the ICM results in formation of cavities, shocks, ripples etc. Well known examples which confirm such interactions are the Perseus cluster, Abell 2052, Hydra A (Fabian et al., 2000; Blanton et al., 2001b; McNamara et al., 2000). Thus the bipolar jets from the AGN pushes the ambient hot X-ray emitting gas outward and creates X-ray deficient regions along the jet direction known as “cavities”. The evidences for the presence of such cavities were first reported from the ROSAT observations of Perseus cluster (Boehringer et al., 1993). The availability of high quality data from Chandra observations of clusters and groups made it possible to detect many such cases and study their interaction with the ICM in detail (McNamara et al., 2000; Fabian et al., 2000; Sanders & Fabian, 2002; Rafferty et al., 2006; Fabian et al., 2006; Bîrzan et al., 2008; Dong et al., 2010; Dunn et al., 2010; O’Sullivan et al., 2011; David et al., 2009; Gitti et al., 2012; Pandge et al., 2013, 2012; Sonkamble et al., 2015; Vagshette et al., 2016). Radio observations of several such clusters revealed that these cavities spatially match with the radio lobes and are filled with non-thermal gas consisting of relativistic particles and magnetic field (McNamara & Nulsen, 2007; Gitti et al., 2012). Recent studies of cavities suggested that the powerful AGN outbursts release enormous amount of energy () and heat the ambient gas in the ICM (McNamara et al., 2005; McNamara & Nulsen, 2007; Vagshette et al., 2016). This amount of energy released (called the AGN feedback) is sufficient to balance the cooling of hot atmosphere surrounding the central engine (Bîrzan et al., 2004; Best et al., 2006; Dunn & Fabian, 2006; Rafferty et al., 2006; Bîrzan et al., 2009; Dong et al., 2010; Vagshette et al., 2016). Apart from AGN feedback, there are other possible heating mechanisms as proposed by several authors; like heating due to merging (Peterson & Fabian, 2006; Markevitch & Vikhlinin, 2007), supernovae heating (Domainko et al., 2004), cosmic rays heating (Colafrancesco et al., 2004; Totani, 2004), etc. However, AGN feedback mechanism provides the most acceptable explanation for heating the ICM.
3C 444 has been identified as a brightest galaxy at the centre of Abell 3847 cluster (Wyndham, 1965) and belongs to the class of weak-line FRII radio galaxy (Tadhunter et al., 2002; Dicken et al., 2012) positioned at RA=22:14:25.7, DEC=-17:01:36 at a redshift of =0.153. It is one of the famous radio sources and has been widely studied in radio bands (Kuehr et al., 1979; Geldzahler & Witzel, 1981; Roger et al., 1986; Dicken et al., 2008; Dicken et al., 2009). However, the X-ray properties of the cluster have not been investigated due to the lack of observations. Using 20 ks Chandra observation, Croston et al. (2011) identified the large scale shock features in the cluster. Apart from these results, nothing has been reported on the morphological and spectral properties of hot gas in the cluster. In the present work we report the imaging and spectral characteristics of hot gas and compare it with the radio morphology.
In this paper, we present results obtained from a systematic study of 3C 444 in Abell 3847 by using 166 ks Chandra archival observations. The structure of the paper is as follows: Section 2 provides details on the Chandra observation of the cluster and data reduction strategies. Section 3 describes results obtained from X-ray imaging analysis and its comparison with the radio map. We also provide spatially resolved spectral analysis of hot gas and the detection of shock in this section. Section 4 reports a brief discussion on cavity energetics, heating and cooling mechanism and central accretion phenomena. Finally, Section 5 presents the conclusions drawn from the study. Throughout this paper, we use cosmology with , =0.3 and =0.7 for 3C 444 cluster. This corresponds to an angular scale of 2.66 kpc arcsec-1.
2 Observation and Data reduction
3C 444 was observed with Chandra ACIS-23678 detector on 12-13 October 2013 with a net integration time of 166 ks (ObsID 15091) with the source focused on the back illuminated ACIS-S3 chip in ‘VFAINT’ mode. In this study, we used archival data of 3C 444 obtained from Chandra X-ray Center (CXC)111http://cda.harvard.edu/chaser/. The Chandra data were reprocessed following the standard data reprocessing procedure as described in Chandra interactive analysis of observations (CIAO-4.6222http://cxc.harvard.edu/ciao/threads/index.html) and employing CALDB V 4.6.2. To identify the flaring events during 3C 444 observation, we initially removed bright point sources from the raw image and than extracted X-ray counts in 2.5-7 keV energy range (David et al., 2009). The lcsigmaclip script of CIAO-sherpa package was used to identify and mark detected flares with 3 clipping threshold. However, during the Chandra observation of 3C 444, no significant flaring events were evident in the light curve.
ACIS-S blank-sky background data was used for background subtraction from the science data. CIAO task was used to identify the blank-sky background file corresponding to 3C 444 observation. Before this, the background data was normalized in such a way that the count rate of blank-sky and science data in 9–12 keV range matched, which was done by using the method described by Vikhlinin et al. (2001) and David et al. (2009). Identification of point sources in the detector field of view was done by using the CIAO script wavdetect and were excluded from further analysis. The spectra and response files were generated by using specextract task of CIAO and XSPEC-12.8.1 package of HEASOFT was used to perform spectral fitting.
3 Results
3.1 Imaging of radio galaxy 3C 444 in A3847

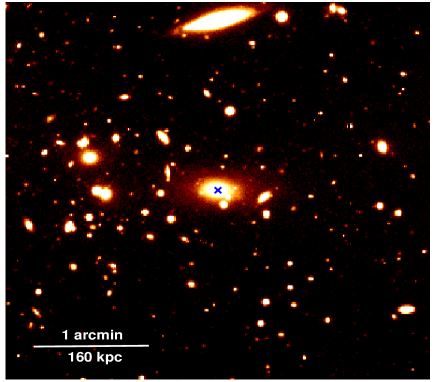
A 2 pixel (1) Gaussian smoothed, background subtracted and exposure-corrected 0.3-6 keV band Chandra X-ray image of A3847 is shown in the left panel of Figure 1 whereas the right panel depicts the R-band optical image of the cluster obtained from the archive of Gemini-South observatory. The “X”-marks in both the images denote the approximate centre of the bright galaxy 3C 444. The images shown in Figure 1 suggest the presence of diffuse X-ray emission with several peculiar features in the cluster though the central bright extended source is only seen in the optical image. The orientation of the central bright galaxy in the optical image is along the East-West direction whereas the X-ray morphology is found to be peculiar due to the presence of X-ray deficient regions. In the Chandra X-ray image, arrow marks along the North-South direction show the X-ray deficient regions in the cluster and have been visualized clearly using different techniques as discussed below.
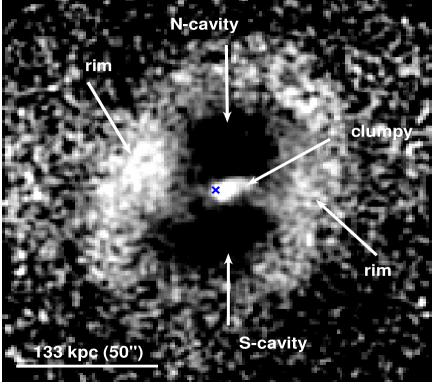
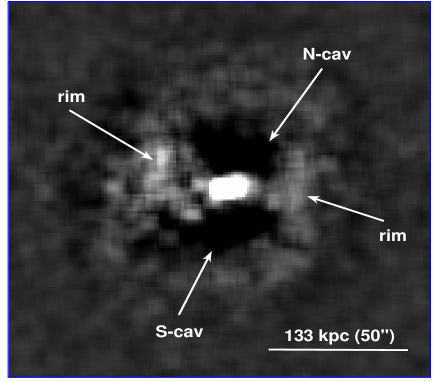
To identify the position and size of the X-ray deficient regions accurately and enhance the hidden features in the central part of A3847, we generated quotient and residual maps of the cluster by using 2D- model (Dong et al., 2010) and unsharp mask imaging (Dong et al., 2010; David et al., 2009) techniques. In 2D -model, the smoothed image of the cluster was produced by fitting 2D -model on the 0.3-6 keV Chandra image. The resultant best fit parameters of these functions are slope = 0.980.02 and core radius r0 = 54.411.4 arcsec. The original image was then divided with the smoothed 2D -model image. The resultant quotient image is shown in the left panel of Figure 2. Using the unsharp mask technique, the residual image of the cluster was obtained by subtracting 20 pixel (10) Gaussian smoothed 0.3-6 keV image from 3 pixel (1.5) Gaussian smoothed image in the same energy band and is shown in the right panel of Figure 2. Both the quotient and residual images revealed the presence of a pair of giant X-ray deficient regions, known as cavities, along the North-South direction of the X-ray peak. These cavities are found to be surrounded by an excess X-ray emission (bright rims). Apart from this, the central nuclear clumpy region is found to be elongated towards East from the X-ray centre (indicated with an “X” mark).
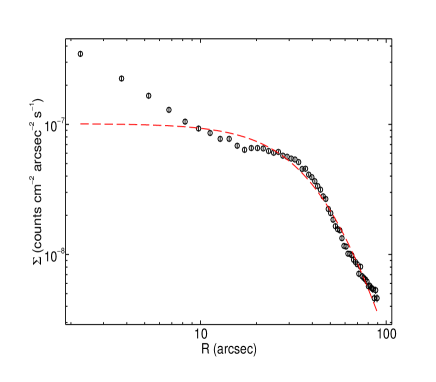

To investigate the distribution of X-ray emitting hot plasma in A3847 cluster, surface brightness profiles were extracted in 0.3-6 keV range by considering annular regions centered on the central peak position (for more details see Vagshette et al. 2016). The resultant surface brightness plots, corrected for background and exposure, are shown in Figure 3. Assuming ICM of A3847 to be in hydrostatic equilibrium in the gravitational potential of central dominant galaxy and well described by King’s approximation to the isothermal sphere (Gitti et al., 2012; King, 1962), the surface brightness profiles were fitted with the 1D -model through the expression
| (1) |
where, the functional parameters , and represent the central brightness, core radius, and slope, respectively. Best-fit values obtained from 1D -model fitting are = 1.040.04 and = 56.211.75 arcsec. A plot of azimuthally averaged surface brightness profile (black circle), fitted with 1D -model (dash line), is shown in the left panel of Figure 3. The azimuthally averaged surface brightness profile exhibits varieties of features such as (i) excess emission from the central region compared to the model confirming that A3847 to be a cool core cluster, (ii) X-ray depression between 10–25 arcsec region suggesting the presence of cavities, (iii) the excess emission at 25–45 arcsec and (iv) rapid fall of surface brightness at larger radii (above 50 arcsec).
To investigate the surface brightness features along the cavity (North and South directions) and non-cavity (East and West directions) regions, we derived surface brightness profiles in 0.3–6 keV band from four different wedge shaped sectors, covering North (25–120), East (130–210) South (220–310) and West (335–25). The background subtracted and exposure corrected resultant sectoral surface brightness profiles are shown in the right panel of Figure 3. For clarity and better presentation, surface brightness values obtained for four sectors are arbitrarily scaled along the vertical axis. For comparison, the best-fitted azimuthally averaged 1D -model is over-plotted in dashed lines (with appropriate normalization). These profiles clearly show the deficiency in surface brightness values compared to the model in annular regions between 10–30 arcsec radii along the North and South directions. All the profiles show excess emission at the centre of the cluster. However, between 70–80 arcsec annular regions, the surface brightness profiles along the North and South directions show shock like features and are discussed in detail in Section 3.6.
3.2 Spectral analysis
The source and background spectra were extracted by following the procedure described in Vagshette et al. (2016). For background estimation, blank-sky background observation was used. As A3847 is an X-ray bright cluster and the Chandra observation used in the present work is of very long exposure, spectral analysis of data extracted from the several regions of interest is viable. Spectra for such regions like nucleus of the cluster (within central 2radius), cavities (along North and South directions), shock regions etc. were extracted for model fitting. As the X-ray emission from galaxy clusters is dominated by thermal Bremsstrahlung, spectral fitting were performed by using collisionally ionized plasma code APEC (Smith et al., 2001) and absorption (wabs) fixed at the Galactic value. All the extracted spectra were fitted in the 0.5 – 7 keV energy band.
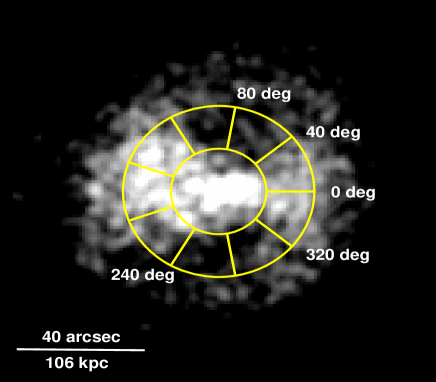
3.3 Cavity environment
The presence of cavities in A3847 are clearly evident in the residual images of the cluster (Figure 2) and have also been confirmed in the surface brightness profiles (Figure 3). We made an attempt to perform a comparative study of the cavities and its environment by fitting spectra obtained from different sectors of the ICM enclosed within an annular region of 15–35 arcsec radii which was divided into nine equal sectors (Figure 4, top panel). Spectral extraction was carried out from each sector separately. The spectral parameters like temperature and abundance were obtained by fitting each spectrum with a single temperature model. Figure 4 shows the variations in temperature (bottom left panel) and metal abundance (bottom right panel) values which reveal that the temperature of X-ray deficient regions (cavities) in A3847 was relatively higher than its surrounding regions, while the metal abundance was lower or comparable with the surrounding ICM.


3.4 Thermodynamical properties of the hot gas in ICM
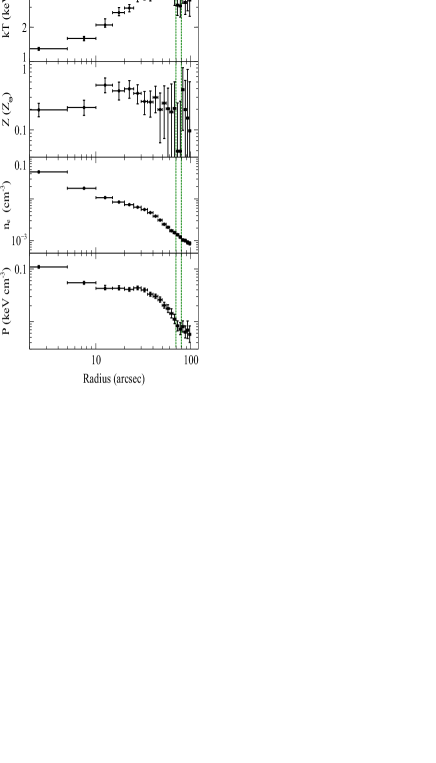
To investigate the thermodynamical properties of hot gas in the ICM of A3847, we extracted azimuthally averaged projected spectra from circular annuli centred on the X-ray peak up to 2 arcmin radii with each bin width of 5 arcsec. These spectra were extracted by assuming the ICM of the cluster as spherically symmetric. Blank-sky observation, as mentioned earlier, was used for background subtraction. Spectral fitting was performed by using single temperature collisionally ionized plasma code (APEC) with fixed Galactic absorption. All the three parameters (temperature, abundance and normalization) were allowed to vary during the fit. Once the values of temperature and normalization were obtained, other thermodynamical parameters such as electron density () and pressure () were estimated by following the method described in Gitti et al. (2012); Vagshette et al. (2016). Azimuthally averaged projected temperature, metallicity, electron density and pressure profiles are shown in the top to bottom panels of Figure 5, respectively. The rising temperature and decreasing metallicity, density and pressure in the outward direction from the centre indicate that A3847 is a cool core cluster. In the temperature profile, the minimum and maximum values were found to be 1.2 keV (at the centre) and 5 keV (in 50-60 arcsec annular region), respectively. However, in the 70-80 arcsec annular region, a sharp drop in the temperature by a factor of 2 is clearly seen. Similar effects are also seen at the same position in the metallicity and pressure profiles. Though the change in the number density was not significant like other parameters, a marginal decrease in the number density is evident in the third panel of Figure 5.
3.5 Sectoral spectral analysis
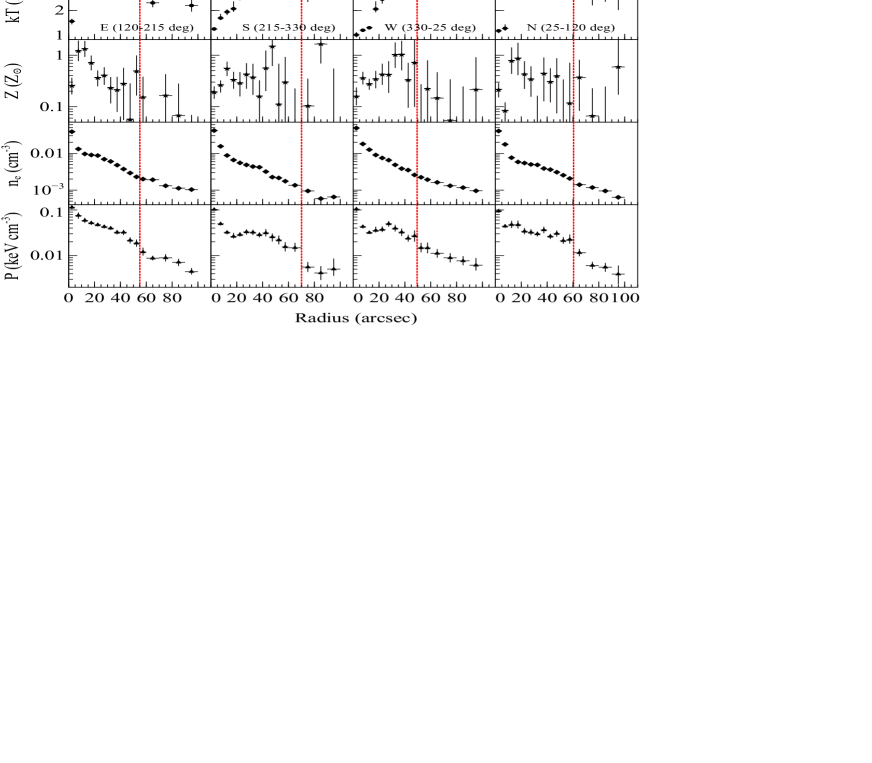
To study the nature of gas distribution in different directions, we extracted spectra from four different sectors (East, South, West and North) by selecting annular regions, each of width of 5 (up to 60) and 10(from 60to 100) radius from the centre of the cluster. All the spectra for each of the four sectors were well fitted with a single temperature (APEC) model and Galactic absorption yielding the values of metallicity and temperature at different radial distances. Using the parameters obtained from spectral fitting, we estimated electron density and pressure at different radii for each of the sector. The resultant temperature, metallicity, electron density and pressure profiles for all the four sectors are plotted in the top to bottom panels of Figure 6, respectively. The temperature profiles revealed that the ICM temperature at certain radii from the centre of A3847 is different in different sectors. Along North and South directions, at a radial distance of 70 arcsec (180 kpc) from cluster centre, the temperature profiles showed a sharp drop by a factor of 2. However, along East and West directions, the temperature drop by a factor 2 was observed at 50 arcsec (133 kps) from the centre (top panels). A similar drop was also evident in the pressure profiles (bottom panels) though the abundance and electron density profiles showed marginal drops in the corresponding values (second and third panels). These observed changes suggest the presence of shocks at the radial distance of 70 arcsec in North and South directions and 50 arcsec in East and West directions as marked with dashed lines in the figure.
Though the error bars in the metallicity plot in Figure 6 (second panels) are large, a careful observation of the profiles for the four sectors provides an important information. Metal abundance profiles show that the distribution of metallicity in the cluster is not symmetric in all the four directions. In the East sector, metallicity profile peaks sharply (1.3 Z⊙) at a radial distance of 15 arcsec radius (40 kpc) beyond which it decreases monotonically, while in the West sector it gradually increases to a peak value of 1 Z⊙ at a distance of 30–40 arcsec radii (80–107 kpc) beyond which it again decreases. Gradual increase in the value of metallicity from the centre to 15 arcsec in the East sector and 30 arcsec radius in the West sector can be explained as due to the presence of clumpy regions as seen in the residual images of the cluster (Figure 2) and cavity inflation. However, in the North and South sectors, the metallicity values decreases from the centre to the radial distance of 70 arcsec beyond which the measurements are inconclusive due to the less number of data points and poor signal. This suggests the presence of a shock at the radial distance of 70 arcsec from the centre of the cluster. Similarly, a sharp decrease in pressure is apparent at the same locations along the North and South directions, while marginal changes in electron number density are observed.
The overall scenario from the profiles shown in Figure 6 manifests that the bipolar outflows in the form of jets emerging from the AGN in the central dominant galaxy 3C 444 inflates large bubbles (radio lobes or cavities) in the ICM of the cluster. These lobes exert pressure on the surrounding gas and drive a shock (vertical dashed lines in Figure 6) in the ICM (McNamara et al., 2005). The shock features are also seen in the residual images in the form of ripples e.g. dark depression surrounding the clumpy regions (Figure 2). This suggests that the radio lobes removed substantial amount gas and metals from the cluster centre and spread in the ICM at a distance of 100–150 kpc (see metallicity profiles Figure 6). These kind of features were also seen in many clusters such as RBS 797, NGC 5813, HCG 62 Abell 2052, ZwCl 2701, Perseus clusters etc. (Blanton et al., 2011; Fabian et al., 2006; Gitti et al., 2012; Blanton et al., 2009; Vagshette et al., 2016).
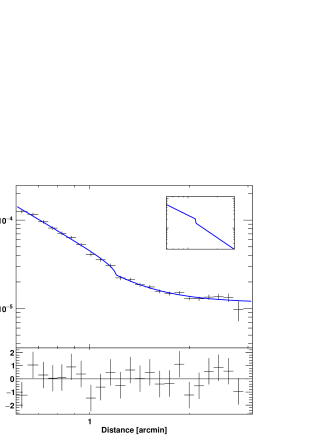
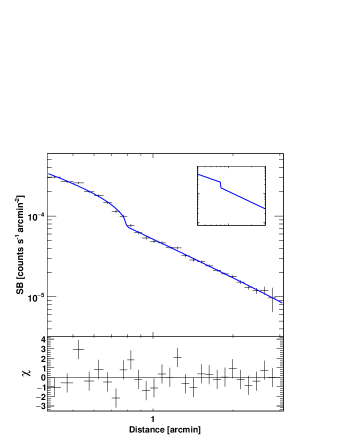
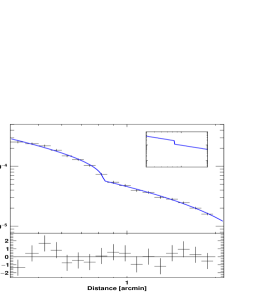
3.6 Shocks in ICM
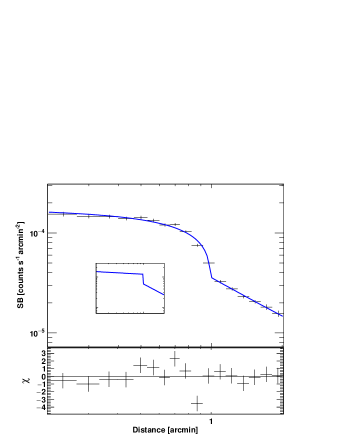
The presence of elliptical bright rim-like features in the residual images of A3847 cluster (Figure 2) hints the presence of elliptical shock surrounding the nuclear region. These shock features are also seen in the sectoral temperature profiles in all four directions (Figure 6), where temperature jumps are clearly seen. In order to confirm the shock front in these directions, we extracted surface brightness profiles along these directions. The same angular regions were adopted for all the segments, as mentioned in Section 3.5. We used the exposure corrected background subtracted and vignetting corrected image in 0.3-3.0 keV range. The surface brightness profiles were then fitted with the deprojected broken power-law density model within PROFFIT (Version 1.4) package (Eckert et al., 2011). The density model is defined as:
| (2) |
where is the electron number density which is a function of radius, is the density normalization, is the density compression factor of the shock, 1 and 2 are the power-law indices, is the radial distance from the centre and is the radius corresponding to the putative shock front. All the parameters of the model were allowed to vary in the fitting. The best fit broken power-law components along with the surface brightness profiles are shown in Figure 7. In North, East and West directions, these profiles reveal that there are sudden jumps in the surface brightness values in the range of 45–60 arcsec radii. Initially, along the South direction (215°- 330° ), we did not find a clear change in the profile, possibly due to the variable shock strength in the annular region. Therefore, we reduced the angular size of the South segment to 215°- 300° and fitted the surface brightness profile which showed a minor jump in the model at 70″ radius. The best fit parameters obtained from the fitting are tabulated in Table 1. By using an adiabatic index and the Rankine-Hugoniot jump conditions we calculated Mach numbers corresponding to these locations and these are given in the table. The maximum value of Mach number is along the North direction and it indicates that the propagation of the shock is faster compared to that in the East and West directions. The minimum value of Mach number is along the South direction and it could be due to projection effect, which was also reported earlier (Croston et al., 2011). Different values of Mach numbers and positions along different directions indicate that the observed shock is elliptical (in 2 dimensional figure). Similar kind of shocks are also seen in other clusters such as MS 0735 (McNamara et al., 2005; Vantyghem et al., 2014), Hydra A (Simionescu et al., 2009; Gitti et al., 2011), 3C 310 (Kraft et al., 2012), Virgo (Forman et al., 2005; Forman et al., 2007; Million et al., 2010).
| Regions | 1 | 2 | C | /dof | Mach No. () | ||
|---|---|---|---|---|---|---|---|
| (arcmin) | () | ||||||
| North(25°-120°) | 24.04/11 | ||||||
| South(215°-300°) | 12.92/17 | ||||||
| East(120°-215°) | 31.64/21 | ||||||
| West(330°-25°) | 10.95/11 |
3.7 Different regions in the ICM of 3C 444
In the earlier section, we described the observed radial thermodynamical properties and shocked regions in the ICM of A3847. To have a clear understanding of the distribution of gas in the central region of the cluster, spectral investigation was carried out for various selected regions as marked in Figure 8. These regions include the central compact source (within 2″ radius – marked as black circle), central clumpy region (marked as green ellipse, excluding the central compact source of 2″ radius), clumpy regions in East and West directions (marked as magenta ellipsoids), North and South X-ray deficient regions (marked as yellow ellipses) and North and South radio bubbles (marked as red ellipses). Spectral extraction from these individual regions and model fitting were performed as described earlier. Except the central compact source and the central clumpy regions, the other regions were well fitted with a single temperature APEC and Galactic absorption model. Spectra obtained from nuclear regions required an additional power-law component in the model fitting. The cause of the additional component could be due to the contribution from the AGN.
Nuclear clumpy region spectrum was initially fitted with a single temperature model in which and were allowed to vary. The best-fit parameters obtained from the single temperature fitting model are given in Table 2. Reduced (/dof =148.31/123) of 1.2 suggested that the single temperature model yielded a relatively poor fit. We tried to fit the spectrum by using a two components model (e.g. APEC+APEC), where the first temperature and abundance were allowed to vary and the second temperature was tied at half of () and abundance of the second APEC component was tied with the first one e.g. 2=1. The best fit parameters obtained from this model fitting are given in Table 2. Improved value of reduced (/dof=106.62/123) compared to that obtained from the single temperature component fitting indicates the presence of cool component in the core of the cluster.
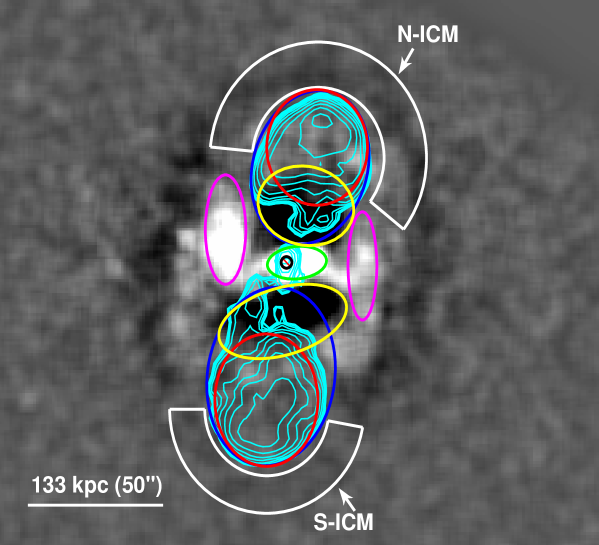
3.8 X-ray spectra of lobes
Following detection of non-thermal X-ray emission from the radio lobes in several FR II radio sources (Croston et al. 2005 and references therein), 3C 326 (Isobe et al., 2009), Cyg A (Yaji et al., 2010), we investigated the presence of such component in 3C 444. ICM spectra were extracted by selecting annular regions in the surroundings of north and south radio lobes and marked as N-ICM and S-ICM in Figure 8. These spectra were fitted with a single temperature APEC model in which the temperature and abundance parameters were allowed to vary. During spectral fitting of S-ICM, as the metal abundance reached its lower limit, we froze the parameter to 0.1. The best-fit parameters of N-ICM and S-ICM spectra are presented in Table 2.
To investigate the presence of non-thermal X-ray emission associated with the radio lobes, we extracted spectra from North-lobe and South-lobe (marked with red ellipses in Figure 8). The origin of this non-thermal component is understood to be due to the inverse Compton process (Yaji et al., 2010). In the beginning, the spectra from both the lobes were fitted with a single temperature APEC model. The parameters (temperature , abundance , reduced ) obtained from spectral fitting are given in Table 2. The values of North-lobe and South-lobe temperature were found to be marginally higher than the surrounding ICM temperature. Though the fitting was statistically acceptable, possible presence of power-law component in the lobe emission was investigated. Along with the APEC component (with temperature and abundance set at the values obtained for surrounding N-ICM and S-ICM), power-law component was added to the fitting model. Parameters obtained from the two component model fitting to the North and South lobe spectra are also given in Table 2. However, addition of non-thermal power-law component to the model did not yield significant improvement in the spectral fitting (Table 2). Therefore, the non-thermal emission from the radio lobes in 3C 320 is either absent or negligible.
3.9 X-ray and radio morphology
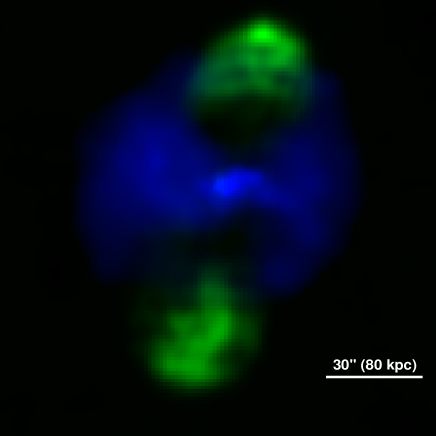
It is well understood that X-ray deficient regions (cavities) are created by powerful radio jets. To investigate the association of the cavities and the radio lobes, we generated a false colour image of 4.89 GHz VLA radio map (Project code-AV0088) and 0.3–3 keV range Chandra diffuse image of the cluster and is shown in Figure 9. In this figure, blue and green colours represent the hot diffuse gas and 4.89 GHz radio emission, respectively. Though the X-ray cavities are formed along the direction of radio jet, physical offset between the cavities and radio bubbles (61 kpc and 77 kpc along North and South directions, respectively) can be clearly seen in this figure as well as in Figure 8. The observed offset between the X-ray cavities and radio lobes may be either due to the projection effect of radio emission or the physical offset between the X-ray cavities and radio lobes due to two different episodic AGN outburst. This peculiar nature has been rarely seen in very few other clusters such as 3C 310 (Kraft et al., 2012), NGC 1316 (Lanz et al., 2010), Abell 4059 (Heinz et al., 2002), MS0735.6+742 (McNamara et al., 2005). The radio jets emitted along North and South directions of 3C 444 were seen to bend towards East and West directions at a distance of 8 arcsec (20 kpc) from the nuclear region of the central galaxy (Figure 8). Apart from these features, the clumpy hot gas which was located in the core of the cluster appeared to be shifted towards West direction from the X-ray centre of the galaxy. These feature indicated that the system is undergoing some sloshing of hot gas because of merging phenomena.
4 Discussion
4.1 Cavity energetics
It is well known that AGN feedback plays an important role in balancing cooling and heating of the ICM (Fabian, 1994; McNamara et al., 2005; Bîrzan et al., 2004; Rafferty et al., 2006; Doria et al., 2012; Pandge et al., 2012; Sonkamble et al., 2015; Vagshette et al., 2016). Power required to heat the ICM through AGN feedback can be derived by taking the ratio between the total energy required to create cavities in the ICM and the age of the cavity. Addition of total internal energy stored within the cavities and work done by the cavities on the surrounding gas of ICM provides the total energy required to create the cavities (Bîrzan et al., 2004; Rafferty et al., 2006). Therefore, the total energy required to create the cavities can be defined as;
| (3) |
where, (=4/3) is the volume of the ellipsoidal cavity which was estimated by visual inspection method (Bîrzan et al., 2004; Gitti et al., 2010; Vagshette et al., 2016), p (=1.92kT) is the pressure of the gas surrounding the X-ray cavities and is the specific heat ratio and is equal to 4/3 for relativistic plasma. The parameters required to derive the energy of cavities such as volume, surrounding gas pressure, temperature and density of gas are given in Table 3. Thus, the total energy () required to create the pair of X-ray cavities in the environment of A3847 is estimated to be 3.06 1060 erg. The age of the cavity was derived by using three different methods such as (i) sound crossing time (tsonic), (ii) buoyancy time (tbuoy) and (iii) refill time (trefill) as discussed in Bîrzan et al. (2004). The estimated age by using above three methods are also given in Table 3 and are in the range of 5–41 107 yr.
Once we have the cavity energy (Ecav) and age (tage), the total cavity power was estimated by using the relation Pcav = Ecav/tage. For convenience, we assumed that the age estimation through buoyancy equation is a better method and the sound crossing time and refill time methods give the lower and upper limits (see Table 3). Hence, the total cavity power was calculated to be Pcav = 6.13 .
We have also tried to estimate cavity power by assuming that the radio lobes filled the X-ray cavities entirely. Though it is not clearly visible in the present case, possibly due to the projection effect, the cavity regions were selected by covering radio lobes and X-ray deficient regions along north and south directions (blue ellipsoids along north and south directions in Figure 8). Physical parameters for these two regions were estimated as was done in previous case. These physical parameters used for the estimation of cavity power are given as N-cavity (ext) and S-cavity (ext) in Table 3 and the total power of the X-ray cavities was found to be 2.74 1045 erg s-1 which is approximately 5 times higher than the earlier estimate.
4.2 Heating Vs cooling of the ICM
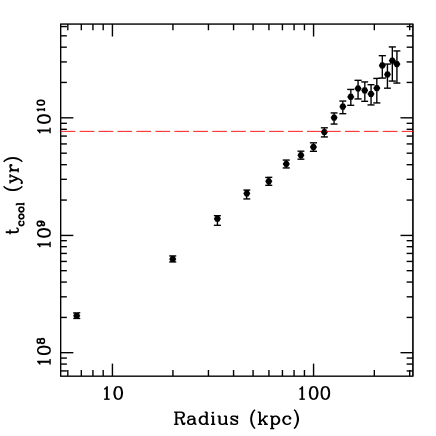
It is believed that in the absence of heating, huge amount of gas in the ICM cool radiatively and get deposited at the core of the cluster. Time required to cool the ICM by radiating its enthalpy was obtained by using the expression given in Cavagnolo et al. (2009). The resultant radial dependent cooling time profile of the cluster is shown in Figure 10, where the horizontal line at 7.7 Gyr represents the cosmological time (or age of the cluster) and corresponding radius is called as the cooling radius (McDonald et al., 2012; Bîrzan et al., 2004). The cooling radius for A3847 cluster was found to be 100 kpc. We estimated the cooling power within the cooling radius as Lcool = 8.30 erg s-1 and the AGN power Pcav 6.30 erg s-1 . Comparison of these estimates suggested that AGN feedback through radio jets is sufficiently large to offset the radiative cooling within the cooling radius.
In the cooling profile (Figure 10), the cooling time at the core of the cluster (within 5″or 13 kpc) was found to be 200 Myr which is 1/40 of the Hubble time. Even shorter cooling times have been reported in several other clusters (e.g. Voigt & Fabian 2004). We then calculated the cooling rate of the gas in ICM using the relation (McDonald et al., 2012; Bîrzan et al., 2004) which was found to be 59.36 within the cooling radius. This suggested that the radiative energy is being replenished on shorter time scale than the cooing time within 13 kpc of the core (Nulsen et al., 2005; McNamara & Nulsen, 2007).
| Regions | kT1 | Photon Index | Z | L0.3-10keV | |
|---|---|---|---|---|---|
| (in keV) | (in Z⊙) | (in 1042 erg s-1) | |||
| North Cavity | 3.50 | 0.42 | 8.7 | 69.5/80 | |
| South Cavity | 2.90 | 0.36 | 9.4 | 168.4/151 | |
| Nucleus | 1.05 | 1.7 | 0.36 | 1.5 | 49.7/49 |
| Nuclear Clump | 1.31 | 0.25 | 7.2 | 148.3/123 | |
| Nuclear Clumpa | 2.33 | 0.54 | – | 106.6/122 | |
| East Clump | 3.11 | 0.33 | 11.0 | 160.4/182 | |
| West Clump | 3.62 | 0.48 | 5.7 | 124.6/129 | |
| North ICM | 4.41 | 0.23 | 6.8 | 112.1/104 | |
| South ICM | 4.45 | 0.1b | 1.3 | 26.7/32 | |
| North Lobe | 4.43 | 0.21 | 10.0 | 67.9/68 | |
| South Lobe | 5.28 | 0.41 | 8.6 | 62/72 | |
| North-Lobec | 4.41b | 1.9 | 0.23b | — | 67.6/68 |
| South-Lobec | 4.45b | 1.5 | 0.1b | — | 64.8/72 |
a : Data were fitted with APEC+APEC model with temperature of the second APEC component fixed at the half of temperature of first APEC component whereas abundance of second component was tied with that of first component.
b : Corresponding parameters were frozen at the quoted values.
c : Presence of power-law (non-thermal) component was tested by adding with the thermal APEC component in the spectral fitting. During
fitting, the values of temperature and abundance were fixed at corresponding values obtained from the spectral fitting of surrounding ICM.
| Parameters | N-cavity | S-cavity | N-cav (ext) | S-cav (ext) |
|---|---|---|---|---|
| (kpc) | 47.5 36.30 | 64.64 31.0 | 70.01 55.63 | 82.52 62.82 |
| (kpc) | 56.0 | 54.3 | 88.64 | 105.15 |
| Vol ( cm3) | 7.67 | 7.62 | 26.59 | 39.97 |
| kT (keV) | 4.32 | 4.19 | 4.41 | 4.45 |
| ( cm-3) | 4.93 | 3.72 | 8.3 | 5.4 |
| ( erg cm-3) | 5.23 | 4.79 | 11.24 | 7.38 |
| E ( erg) | 1.60 | 1.46 | 11.96 | 11.80 |
| (km s-1) | 105431 | 103934 | 106543 | 1070101 |
| (km s-1) | 35273 | 33038 | 34671 | 33770 |
| ( yr) | 5.200.16 | 5.120.17 | 8.150.33 | 9.620.90 |
| ( yr) | 15.563.23 | 16.123.34 | 25.095.2 | 30.516.32 |
| ( yr) | 40.6816.87 | 41.6517.27 | 62.8326.05 | 73.5030.47 |
4.3 Central engine and the super massive black hole
If the AGN feedback is the primary source of ICM gas heating, then it is important to study the properties of the central engine of the galaxy cluster. It is well understood that every central dominated bright galaxy in clusters harbour a super massive black hole (SMBH) of mass in the range of 106 – 109 . Such SMBHs accrete matter from the surrounding and releases huge amount of energy in the form of radiation and/or outflows (Bardeen, 1970; Cattaneo et al., 2009). Even a small fraction (less than 1) of the released energy is sufficient to heat the bulge (Cattaneo et al., 2009) of the galaxy. Therefore, to study the properties of the central engine (AGN), it is necessary to understand the accretion and emission processes in the SMBH. For this, we derived mass of the black hole located at the centre of the bright galaxy in A3847 using stellar dispersion velocity and K-band luminosity. The stellar dispersion velocity = 164 34 km s-1 (as quoted by Smith et al. 1990) was used in our calculation, whereas the K-band luminosity (LK = 1.470.06 erg s-1 ) was taken from the NASA Extragalactic Database (NED). The mass of the black hole was estimated by using dispersion velocity and K-band luminosity methods to be 6.071.8 and 7.09 0.60 , respectively, and found to agree within one sigma limits. Mass accretion rate () of the SMBH in 3C 444 was obtained by using the relation = , where is cavity power and is the velocity of light. In the present work, the value of radiative efficiency is assumed to be 0.1 (Rafferty et al., 2006). Using this relation, the accretion rate was estimated to be = 0.11 .
Eddington accretion rate of a black hole depends on its mass and radiative efficiency through the relation = , where is the Eddington luminosity. For the SMBH in the central dominant galaxy 3C 444, the Eddington accretion rate was estimated to be = 1.340.26 . We estimated Bondi accretion rate by assuming spherically symmetric and steady state accretion onto the compact object. Bondi accretion process occurs within the Bondi radius and is defined as RB = 2G. The Bondi accretion rate for compact object is given by , where is sound speed in the surrounding medium. It is difficult to estimate the gas density within Bondi radius due to the limitations in the angular resolution of detectors. However, we used the gas density obtained from extraction of nuclear 2″spectrum, though it underestimate the value of number density. Using the mass of the SMBH in the bright galaxy in A3847 cluster, Bondi radius was estimated to be 1.79 10-3 kpc. By using the value of number density obtained from nuclear 2″spectrum (ne = 0.0750.007 ) and estimated Bondi radius, the Bondi accretion rate was derived to be = 3.08 10-6 .
The ratios of mass accretion onto the SMBH in 3C 444 () to the Bondi and Eddington accretion rates were found to be 3.5 104 and 0.08, respectively. The accretion rate is supposed to be sub-Eddington when is in the range of 10, where AGNs are often observed to be radiatively inefficient (Russell et al., 2013). Gaspari et al. (2015) suggested that black hole accretion rate can be boosted up to 10-2 times the Eddington rate and two to three orders above the Bondi accretion rate via a process known as “chaotic cold accretion” (CCA). In CCA model the cold filament and clouds condense out of the hot gas phase where cooling time is much low (in Myr order within 10 kpc region) and rain onto the SMBH, boosting the feedback mechanism and re-heating the ICM core.
5 Conclusions
Using the deep Chandra observation and 4.89 GHz VLA radio map, we investigated the properties of X-ray deficient regions, shocks and other substructures in the ICM of A3847 cluster. The results obtained from our study are summarized as follows.
-
1
A pair of giant X-ray deficient cavities along North and South directions were clearly detected in the residual images of the cluster.
-
2
X-ray and 4.8 GHz radio images revealed the peculiar positioning of the cavities and radio bubbles in A3847. The radio lobes and X-ray cavities are apparently not spatially coincident and they exhibit offset, by 61 kpc and 77 kpc from each other along the North and South directions, respectively.
-
3
Presence of shock is detected in the ICM of cluster A3847.
-
4
Using results obtained from the radial thermodynamical profiles, it is confirmed that the radio bubbles are responsible for removing substantial amount of matter from the centre of the cluster.
-
5
The AGN feedback power that heats up the ICM was estimated to be 6.3 erg s-1 and is sufficiently large to offset the cooling (Lcool 8.30 erg s-1 ) of the ICM in A3847 cluster.
-
6
The ratio of estimated accretion rate to the Eddington rate and Bondi rate suggested that the SMBH in the central dominant galaxy 3C 444 accretes matter through chaotic cold accretion.
Acknowledgments
The authors are grateful to the anonymous referee for constructive comments and suggestions on the paper. The authors thank A. R. Rao for careful reading of the manuscript. This work has made use of data from the Chandra, VLA and Gemini-South archive, NASA’s Astrophysics Data System(ADS), Extragalactic Database (NED), software provided by the Chandra X-ray Center (CXC), HEASOFT for spectral fitting and Veusz plotting tools.
References
- Bardeen (1970) Bardeen J. M., 1970, Nature, 226, 64
- Best et al. (2006) Best P. N., Kaiser C. R., Heckman T. M., Kauffmann G., 2006, MNRAS, 368, L67
- Bîrzan et al. (2008) Bîrzan L., McNamara B. R., Nulsen P. E. J., Carilli C. L., Wise M. W., 2008, ApJ, 686, 859
- Bîrzan et al. (2009) Bîrzan L., Rafferty D. A., McNamara B. R., Nulsen P. E. J., Wise M. W., 2009, in S. Heinz & E. Wilcots ed., American Institute of Physics Conference Series Vol. 1201 of American Institute of Physics Conference Series, The Detectability of AGN Cavities in Cooling-Flow Clusters. pp 301–304
- Bîrzan et al. (2004) Bîrzan L., Rafferty D. A., McNamara B. R., Wise M. W., Nulsen P. E. J., 2004, ApJ, 607, 800
- Blanton et al. (2011) Blanton E. L., Randall S. W., Clarke T. E., Sarazin C. L., McNamara B. R., Douglass E. M., McDonald M., 2011, ApJ, 737, 99
- Blanton et al. (2009) Blanton E. L., Randall S. W., Douglass E. M., Sarazin C. L., Clarke T. E., McNamara B. R., 2009, ApJ, 697, L95
- Blanton et al. (2001a) Blanton E. L., Sarazin C. L., McNamara B. R., Wise M. W., 2001a, ApJ, 558, L15
- Blanton et al. (2001b) Blanton E. L., Sarazin C. L., McNamara B. R., Wise M. W., 2001b, in Bulletin of the American Astronomical Society Vol. 34 of Bulletin of the American Astronomical Society, Chandra Observations of Cooling Flow Clusters with Central Radio Sources. pp 573–+
- Boehringer et al. (1993) Boehringer H., Voges W., Fabian A. C., Edge A. C., Neumann D. M., 1993, MNRAS, 264, L25
- Cattaneo et al. (2009) Cattaneo A., Faber S. M., Binney J., Dekel A., Kormendy J., Mushotzky R., Babul A., Best P. N., Brüggen M., Fabian A. C., Frenk C. S., Khalatyan A., Netzer H., Mahdavi A., Silk J., Steinmetz M., Wisotzki L., 2009, Nature, 460, 213
- Cavagnolo et al. (2009) Cavagnolo K. W., Donahue M., Voit G. M., Sun M., 2009, ApJS, 182, 12
- Colafrancesco et al. (2004) Colafrancesco S., Dar A., De Rújula A., 2004, A&A, 413, 441
- Croston et al. (2005) Croston J. H., Hardcastle M. J., Harris D. E., Belsole E., Birkinshaw M., Worrall D. M., 2005, ApJ, 626, 733
- Croston et al. (2011) Croston J. H., Hardcastle M. J., Mingo B., Evans D. A., Dicken D., Morganti R., Tadhunter C. N., 2011, ApJ, 734, L28
- David et al. (2009) David L. P., Jones C., Forman W., Nulsen P., Vrtilek J., O’Sullivan E., Giacintucci S., Raychaudhury S., 2009, ApJ, 705, 624
- Dicken et al. (2009) Dicken D., Tadhunter C., Axon D., Morganti R., Inskip K. J., Holt J., González Delgado R., Groves B., 2009, ApJ, 694, 268
- Dicken et al. (2012) Dicken D., Tadhunter C., Axon D., Morganti R., Robinson A., Kouwenhoven M. B. N., Spoon H., Kharb P., Inskip K. J., Holt J., Ramos Almeida C., Nesvadba N. P. H., 2012, ApJ, 745, 172
- Dicken et al. (2008) Dicken D., Tadhunter C., Morganti R., Buchanan C., Oosterloo T., Axon D., 2008, ApJ, 678, 712
- Domainko et al. (2004) Domainko W., Gitti M., Schindler S., Kapferer W., 2004, A&A, 425, L21
- Dong et al. (2010) Dong R., Rasmussen J., Mulchaey J. S., 2010, ApJ, 712, 883
- Doria et al. (2012) Doria A., Gitti M., Ettori S., Brighenti F., Nulsen P. E. J., McNamara B. R., 2012, ApJ, 753, 47
- Dunn et al. (2010) Dunn R. J. H., Allen S. W., Taylor G. B., Shurkin K. F., Gentile G., Fabian A. C., Reynolds C. S., 2010, MNRAS, 404, 180
- Dunn & Fabian (2006) Dunn R. J. H., Fabian A. C., 2006, MNRAS, 373, 959
- Eckert et al. (2011) Eckert D., Molendi S., Paltani S., 2011, A&A, 526, A79
- Fabian (1994) Fabian A. C., 1994, ARA&A, 32, 277
- Fabian et al. (2000) Fabian A. C., Sanders J. S., Ettori S., Taylor G. B., Allen S. W., Crawford C. S., Iwasawa K., Johnstone R. M., Ogle P. M., 2000, MNRAS, 318, L65
- Fabian et al. (2006) Fabian A. C., Sanders J. S., Taylor G. B., Allen S. W., Crawford C. S., Johnstone R. M., Iwasawa K., 2006, MNRAS, 366, 417
- Forman et al. (2007) Forman W., Jones C., Churazov E., Markevitch M., Nulsen P., Vikhlinin A., Begelman M., Böhringer H., Eilek J., Heinz S., Kraft R., Owen F., Pahre M., 2007, ApJ, 665, 1057
- Forman et al. (2005) Forman W., Nulsen P., Heinz S., Owen F., Eilek J., Vikhlinin A., Markevitch M., Kraft R., Churazov E., Jones C., 2005, ApJ, 635, 894
- Fukazawa et al. (1994) Fukazawa Y., Ohashi T., Fabian A. C., Canizares C. R., Ikebe Y., Makishima K., Mushotzky R. F., Yamashita K., 1994, PASJ, 46, L55
- Gaspari et al. (2015) Gaspari M., Brighenti F., Temi P., 2015, A&A, 579, A62
- Geldzahler & Witzel (1981) Geldzahler B. J., Witzel A., 1981, AJ, 86, 1306
- Gitti et al. (2012) Gitti M., Brighenti F., McNamara B. R., 2012, Advances in Astronomy, 2012, 6
- Gitti et al. (2011) Gitti M., Nulsen P. E. J., David L. P., McNamara B. R., Wise M. W., 2011, ApJ, 732, 13
- Gitti et al. (2010) Gitti M., O’Sullivan E., Giacintucci S., David L. P., Vrtilek J., Raychaudhury S., Nulsen P. E. J., 2010, ApJ, 714, 758
- Heinz et al. (2002) Heinz S., Choi Y.-Y., Reynolds C. S., Begelman M. C., 2002, ApJ, 569, L79
- Hlavacek-Larrondo et al. (2012) Hlavacek-Larrondo J., Fabian A. C., Edge A. C., Ebeling H., Sanders J. S., Hogan M. T., Taylor G. B., 2012, MNRAS, 421, 1360
- Isobe et al. (2009) Isobe N., Tashiro M. S., Gandhi P., Hayato A., Nagai H., Hada K., Seta H., Matsuta K., 2009, ApJ, 706, 454
- Kaastra et al. (2004) Kaastra J. S., Tamura T., Peterson J. R., Bleeker J. A. M., Ferrigno C., Kahn S. M., Paerels F. B. S., Piffaretti R., Branduardi-Raymont G., Böhringer H., 2004, A&A, 413, 415
- King (1962) King I., 1962, AJ, 67, 471
- Kraft et al. (2012) Kraft R. P., Birkinshaw M., Nulsen P. E. J., Worrall D. M., Croston J. H., Forman W. R., Hardcastle M. J., Jones C., Murray S. S., 2012, ApJ, 749, 19
- Kuehr et al. (1979) Kuehr H., Nauber U., Pauliny-Toth I. I. K., 1979, A Catalogue of radio sources
- Lanz et al. (2010) Lanz L., Jones C., Forman W. R., Ashby M. L. N., Kraft R., Hickox R. C., 2010, ApJ, 721, 1702
- Markevitch & Vikhlinin (2007) Markevitch M., Vikhlinin A., 2007, Phys. Rep., 443, 1
- McDonald et al. (2012) McDonald M., Bayliss M., Benson B. A., Foley R. J., Ruel J., Sullivan P., Veilleux S., Aird K. A., Ashby M. L. N., Bautz M., Bazin G., Bleem L. E., Brodwin M., Carlstrom J. E., Chang C. L., Cho H. M., Clocchiatti A., et. al. 2012, Nature, 488, 349
- McNamara & Nulsen (2007) McNamara B. R., Nulsen P. E. J., 2007, ARA&A, 45, 117
- McNamara et al. (2005) McNamara B. R., Nulsen P. E. J., Wise M. W., Rafferty D. A., Carilli C., Sarazin C. L., Blanton E. L., 2005, Nature, 433, 45
- McNamara et al. (2000) McNamara B. R., Wise M., Nulsen P. E. J., David L. P., Sarazin C. L., Bautz M., Markevitch M., Vikhlinin A., Forman W. R., Jones C., Harris D. E., 2000, ApJ, 534, L135
- Million et al. (2010) Million E. T., Werner N., Simionescu A., Allen S. W., Nulsen P. E. J., Fabian A. C., Böhringer H., Sanders J. S., 2010, MNRAS, 407, 2046
- Nulsen et al. (2005) Nulsen P. E. J., Hambrick D. C., McNamara B. R., Rafferty D., Birzan L., Wise M. W., David L. P., 2005, ApJ, 625, L9
- O’Sullivan et al. (2011) O’Sullivan E., Giacintucci S., David L. P., Gitti M., Vrtilek J. M., Raychaudhury S., Ponman T. J., 2011, ApJ, 735, 11
- Pandge et al. (2012) Pandge M. B., Vagshette N. D., David L. P., Patil M. K., 2012, MNRAS, 421, 808
- Pandge et al. (2013) Pandge M. B., Vagshette N. D., Sonkamble S. S., Patil M. K., 2013, Ap&SS, 345, 183
- Peterson & Fabian (2006) Peterson J. R., Fabian A. C., 2006, Phys. Rep., 427, 1
- Rafferty et al. (2006) Rafferty D. A., McNamara B. R., Nulsen P. E. J., Wise M. W., 2006, ApJ, 652, 216
- Roger et al. (1986) Roger R. S., Costain C. H., Stewart D. I., 1986, A&AS, 65, 485
- Russell et al. (2013) Russell H. R., McNamara B. R., Edge A. C., Hogan M. T., Main R. A., Vantyghem A. N., 2013, MNRAS, 432, 530
- Sanders & Fabian (2002) Sanders J. S., Fabian A. C., 2002, MNRAS, 331, 273
- Simionescu et al. (2009) Simionescu A., Roediger E., Nulsen P. E. J., Brüggen M., Forman W. R., Böhringer H., Werner N., Finoguenov A., 2009, A&A, 495, 721
- Smith et al. (1990) Smith E. P., Heckman T. M., Illingworth G. D., 1990, ApJ, 356, 399
- Smith et al. (2001) Smith R. K., Brickhouse N. S., Liedahl D. A., Raymond J. C., 2001, ApJ, 556, L91
- Sonkamble et al. (2015) Sonkamble S. S., Vagshette N. D., Pawar P. K., Patil M. K., 2015, Ap&SS, 359, 21
- Tadhunter et al. (2002) Tadhunter C., Dickson R., Morganti R., Robinson T. G., Wills K., Villar-Martin M., Hughes M., 2002, MNRAS, 330, 977
- Totani (2004) Totani T., 2004, Physical Review Letters, 92, 191301
- Vagshette et al. (2016) Vagshette N. D., Sonkamble S. S., Naik S., Patil M. K., 2016, MNRAS, 461, 1885
- Vantyghem et al. (2014) Vantyghem A. N., McNamara B. R., Russell H. R., Main R. A., Nulsen P. E. J., Wise M. W., Hoekstra H., Gitti M., 2014, MNRAS, 442, 3192
- Vikhlinin et al. (2001) Vikhlinin A., Markevitch M., Murray S. S., 2001, ApJ, 551, 160
- Voigt & Fabian (2004) Voigt L. M., Fabian A. C., 2004, MNRAS, 347, 1130
- Wyndham (1965) Wyndham J. D., 1965, AJ, 70, 384
- Yaji et al. (2010) Yaji Y., Tashiro M. S., Isobe N., Kino M., Asada K., Nagai H., Koyama S., Kusunose M., 2010, ApJ, 714, 37