Quantifying perceived impact of scientific publications
Abstract
Citations are commonly held to represent scientific impact. To date, however, there is no empirical evidence in support of this postulate that is central to research assessment exercises and Science of Science studies. Here, we report on the first empirical verification of the degree to which citation numbers represent scientific impact as it is actually perceived by experts in their respective field. We run a large-scale survey of about corresponding authors who performed a pairwise impact assessment task across more than scientific articles. Results of the survey show that citation data and perceived impact do not align well, unless one properly accounts for strong psychological biases that affect the opinions of experts with respect to their own papers vs. those of others. First, researchers tend to largely prefer their own publications to the most cited papers in their field of research. Second, there is only a mild positive correlation between the number of citations of top-cited papers in given research areas and expert preference in pairwise comparisons. This also applies to pairs of papers with several orders of magnitude differences in their total number of accumulated citations. However, when researchers were asked to choose among pairs of their own papers, thus eliminating the bias favouring one’s own papers over those of others, they did systematically prefer the most cited article. We conclude that, when scientists have full information and are making unbiased choices, expert opinion on impact is congruent with citation numbers.
I Introduction
Metrics based on bibliographic data increasingly inform important decision-making processes in science, such as hiring, tenure, promotion, and funding Harzing (2010); Bornmann and Daniel (2006); Bornmann et al. (2008); Lovegrove and Johnson (2008); Hornbostel et al. (2009); Bornmann et al. (2011). Many, if not most, of these bibliometric indicators are derived from article-level citation counts Bar-Ilan (2008); Van Noorden (2010), e.g. the h-index Hirsch (2005) and the journal impact factor Garfield (2006), due to the wide availability of extensive bibliographic records. However, they rest on the frequently undeclared assumption that citations are an accurate and reliable reflection of scientific impact. Bornmann et al. Bornmann and Daniel (2008a) and Sarigol et al. Sarigöl et al. (2014) find that citations can serve as reasonable approximations of social indicators such as popularity or success, but they do not support the most important assumption underlying most work in the area of citation-based impact indicators, namely that citations quantify scientific impact. Here, we investigate this assumption directly by determining whether citation data truly reflect scientific impact as it is perceived by expert scholars in their respective fields. Such an assumption is central in the long-standing debate about the proper use of citation data Garfield (1979). One common argument against the use of citation data in assessment exercises rests in particular on the doubts about their validity as indicators of true scientific impact MacRoberts and MacRoberts (1996); Adler et al. (2009); MacRoberts and MacRoberts (2010). In fact, the literature frequently confounds “impact”, “influence”, and “rank” with citation-derived metrics Wuchty et al. (2007); Radicchi et al. (2008); Wang et al. (2013) although these metrics can vary along multiple distinct dimensions Bornmann and Daniel (2008b); Bollen et al. (2009).
Determining whether citations actually indicate scientific impact is an empirical question which can not be resolved by theoretical discussions of the perceived or presumed benefits vs. demerits of citation data alone. For this reason, we decided to define and empirically quantify a novel post-publication metric, namely impact as perceived by the authors themselves. Our goal is to understand whether citation numbers “truly” reflect a particular dimension of impact: the influence or importance of papers in the daily practice of researchers.
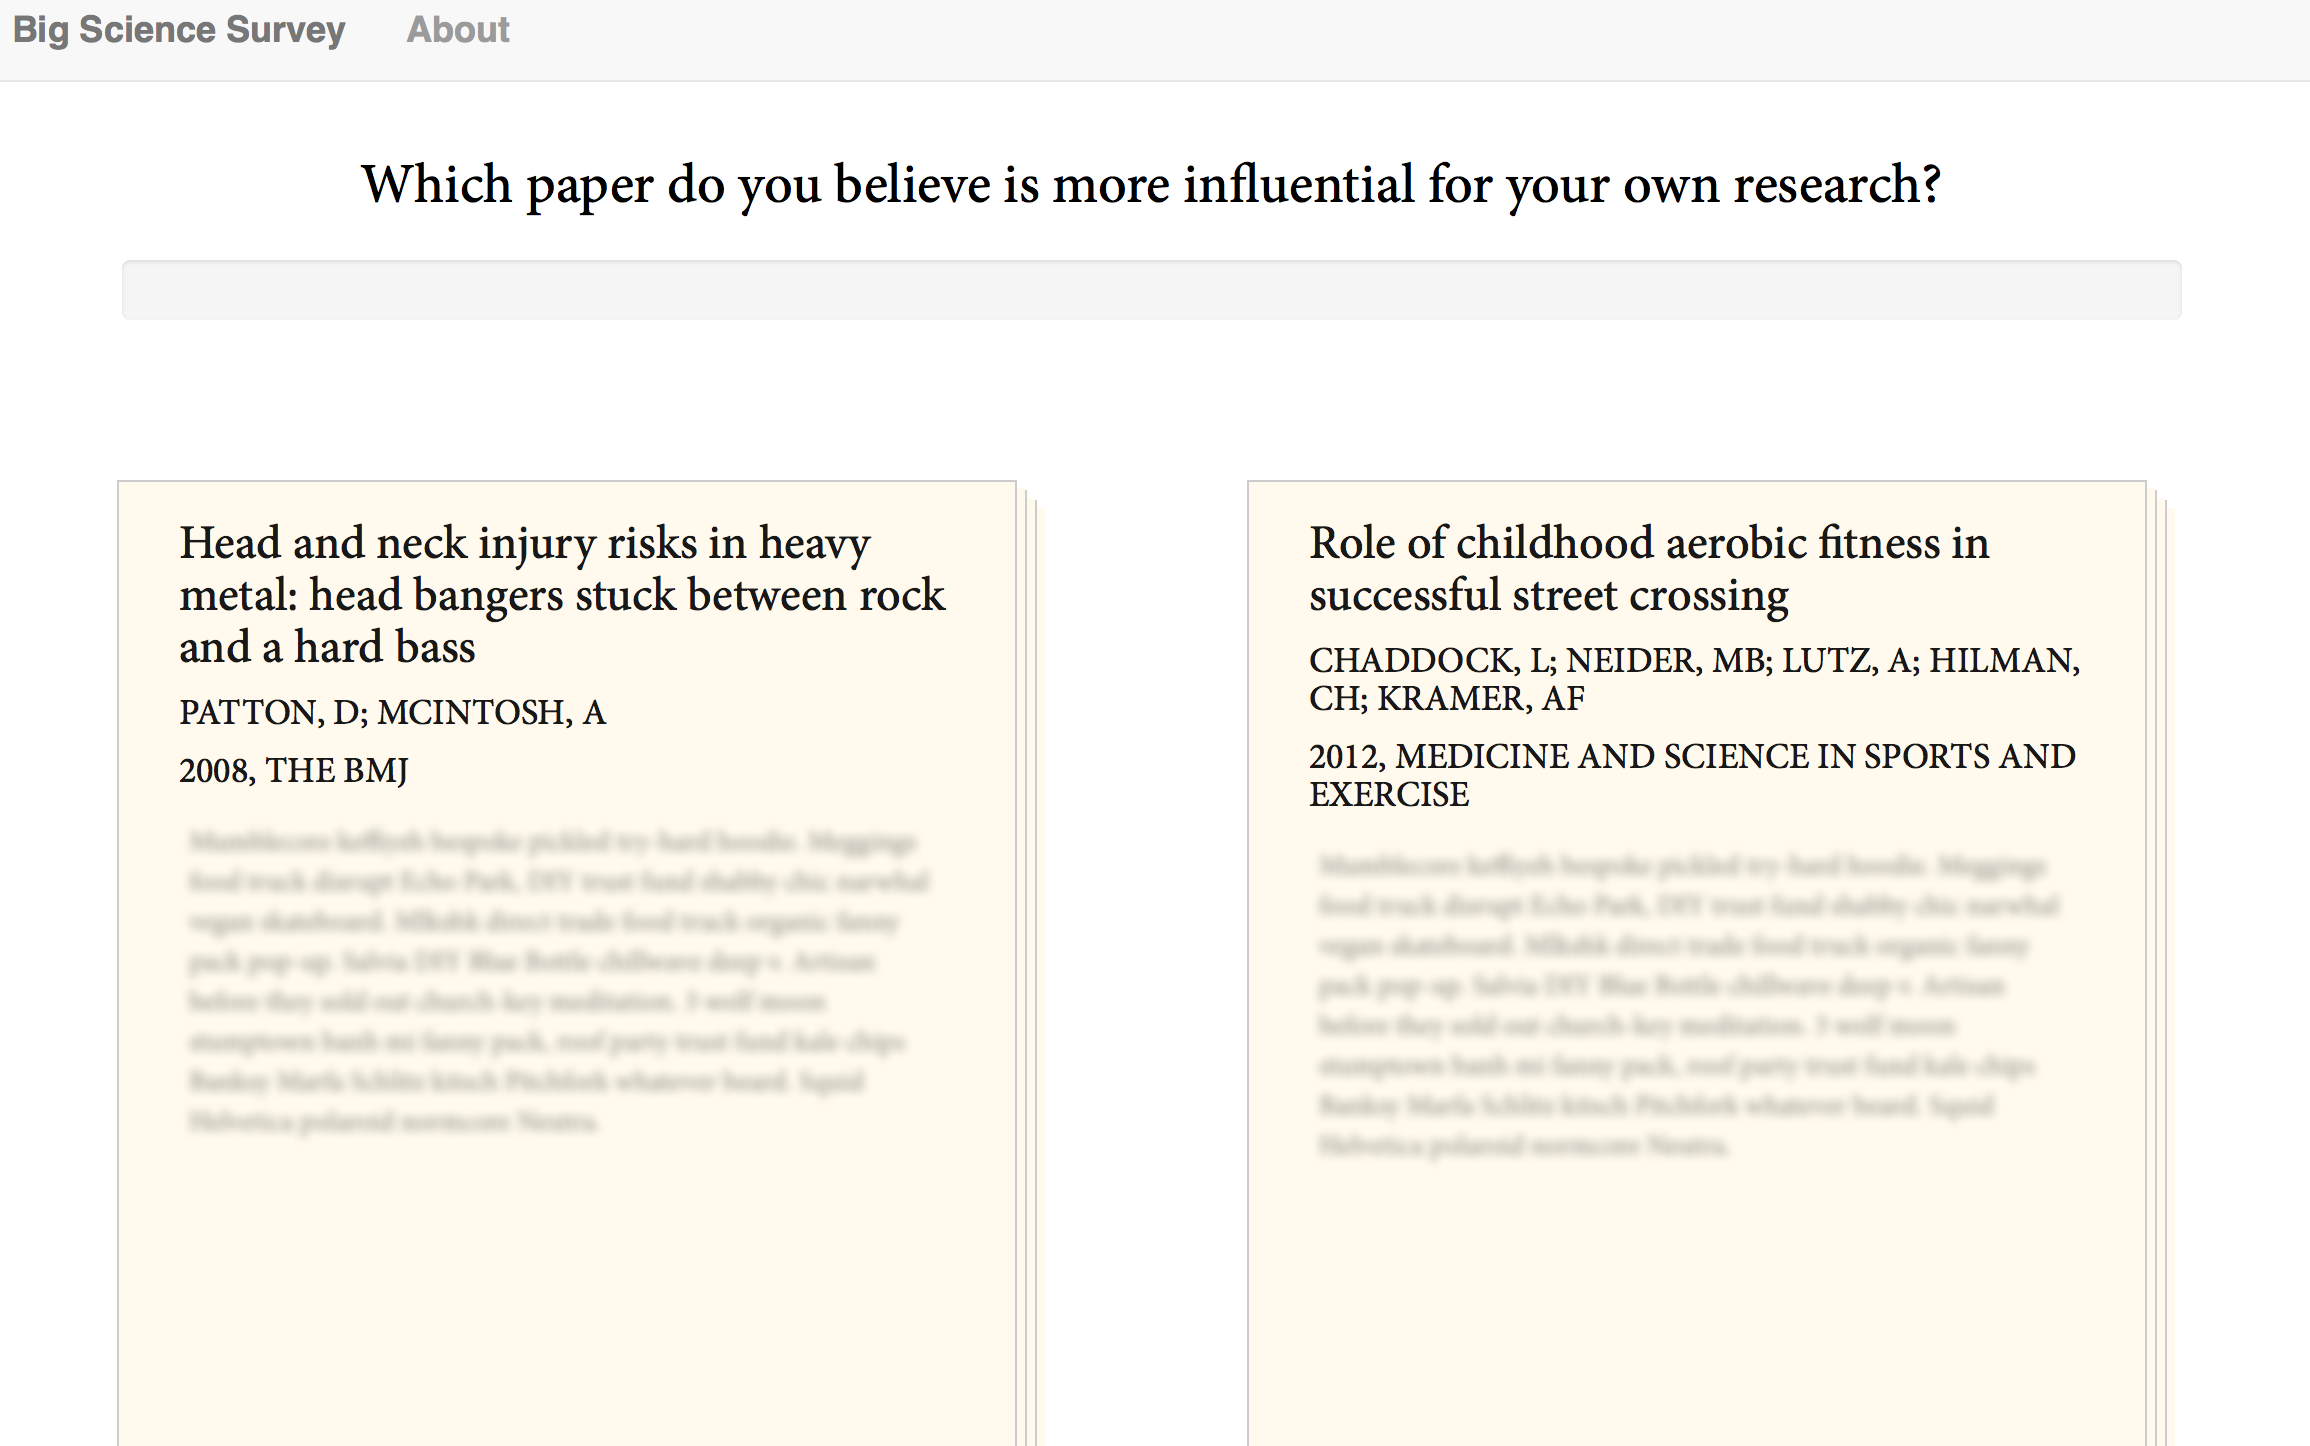
We designed a large-scale survey at bigscience.soic.indiana.edu to collect responses from thousands of experienced scholars in a multitude of disciplines (Fig. A1). We asked researchers to make a pairwise decision with regards to their preference of one paper over the other. These decisions were made under two conditions: whether the articles were written by the expert scholars themselves or by other scholars. We then aggregated results over the entire population of respondents to quantify the degree of correlation between the pairwise preferences of respondents (i.e., perceived impact) and the actual difference in the number of citations accumulated (i.e., citation impact) for the pair of papers. Our results indicate that, from the perspective of individual researchers, their assessment of impact vs. impact judged from citation data are only related for pairs of their own papers. Every time that a paper not co-authored by the individual is involved in the estimation of perceived impact, this comparison shows null or negative correlation with citation impact.
II Methods
To build the infrastructure needed for the survey, we took all scientific articles with a publication year up to from the Web of Science (WoS) database. We associated every article with the total number of citations accumulated until in the WoS citation network as an indication of its citation impact. We identified all articles that were associated with corresponding author(s) from three major public universities in the US: (1) Indiana University (IU), (2) University of Michigan (UMICH), and (3) University of Minnesota (UMN). We chose IU to run the first pilot experiment since it is our home university ; this would make initial data validation more straightforward. UMICH and UMN were selected since they have the largest number of recent publications among all public universities in the US. All three universities host departments in almost all disciplines of the natural and social sciences, offering a relatively unbiased sample of participants in terms of field of expertise. Articles were matched to their corresponding author(s) using the email address(es) provided in the article metadata. For example, email addresses ending in “indiana.edu” were taken as an indication that the authors were based at IU. Similarly for UMICH and UMN, we identified researchers from those institutions by retaining email addresses that ended with “umich.edu” and “umn.edu,” respectively.
In our data set, articles published prior to 1995 did not provide author email addresses. After 1995, the proportion of articles carrying at least one email address increased rapidly each year. The vast majority of recent articles provide at least one email address. This may introduce a potential source of bias in our study towards relatively recent publications, but this procedure generated a number of very important advantages. First, the association between articles and physical persons was virtually free from homonymy-induced errors. Second, and very important for our purpose, email addresses allowed us to directly contact researchers and invite them to participate in our large-scale survey.
We sent an email message that contained a unique and customized URL to every potential participant (Fig. A2). This URL pointed to a web page in which the respondent was presented with a maximum of ten pairwise comparisons between scientific papers. In each comparison, we provided only the journal and year of publication of the papers, their title and list of authors. For every pair of papers, the respondent was asked to select the one article she/he believed to be more “influential” for her/his own research. Note that this task did not involve any consideration of, nor information on, citation data for any of the two papers. We tailored the survey for every respondent; papers were selected from three different pools that were constructed using information from the publication and citation record of the respondent: (i) “Own” publications (OWN), (ii) “Top cited” articles (TCD), and (iii) “Random” papers (RND). The OWN pool consisted of articles written by the respondents themselves, i.e., they were associated with the email address of the responding author. The pool of TCD articles was constructed as follows. First, we identified all articles appearing at least once in the reference lists of publications by the respondent. We eliminated from this set articles that appeared also in the pool of OWN articles. We then ranked the remaining articles based on their citation impact, and selected the top 10 articles in the list. This procedure allowed us to populate the TCD pool with the most popular articles in the respondent’s area of research, but that were not written by the respondent her/himself. The pool of RND papers was simply generated as the union of articles (co-)authored or cited (not just the top cited) by all potential participants, thus comprising mainly articles unknown to the respondent. This pool was used only for the IU sample as a control set to check for the presence of possible systematic biases in the survey. Several respondents were confused when presented with random papers. We therefore decided to remove the RND pool from subsequent surveys made at UMICH and UMN. Although the IU respondents reported discomfort about having to make selections from the RND pool of papers, the data generated was useful to validate construction of the other two pools, and to test for the absence of systematic biases in the visual format used in the online survey (Fig. A3). Once the three article pools were generated, every comparison presented to respondents in their personalized survey was composed of pairs of papers taken at random from the various pools. This allowed us to collect information about the preferences of respondents among pairs of papers within the same pool and across different pools. We recorded the preferences expressed by every participant, and we used it to estimate the perceived impact of one paper with respect to the other in the comparison.
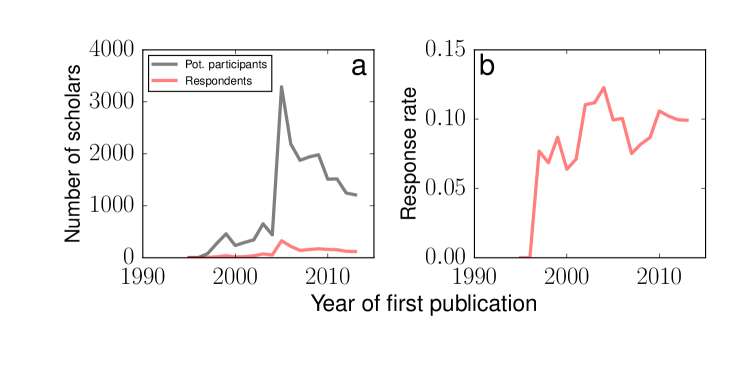
We sent emails for participation to a total of researchers (Table A1). scholars participated in the survey, for a total of pairwise comparisons among distinct articles. This is a low but acceptable response rate for an online survey with a self-selected sample Sheehan (2001). Importantly, we didn’t observe any systematic bias in the pool of participants in terms of academic age (Fig. A4), although we can not exclude the presence of all selection bias in the sample of researchers who participated in the survey Bethlehem (2010). We remark that our estimate of the response rate is conservative; some of the email addresses we used to contact researchers might be no longer active, e.g., through retirement or change of affiliation. Note that the resulting survey sample was more than ten times larger than that of a recent attempt to characterize the features of the top 10 most cited scientific publications authored by biomedical researchers Ioannidis et al. (2014).
III Results
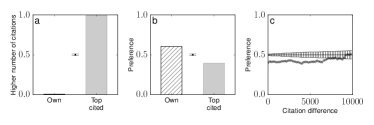
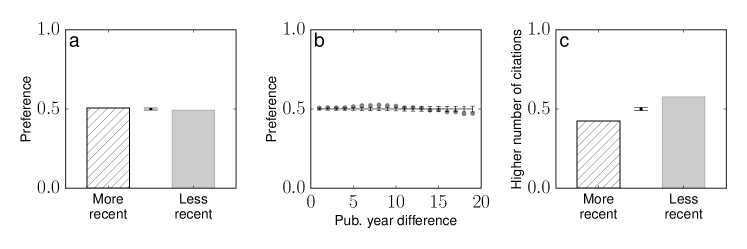
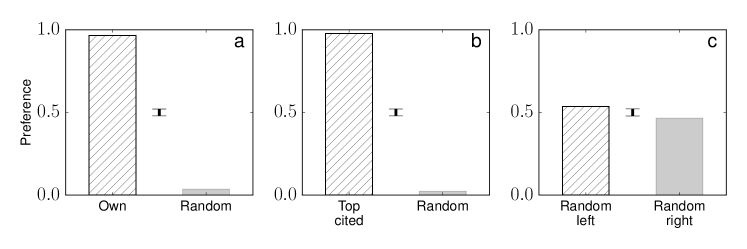
Figure 1 summarizes the relation between citation and perceived impact obtained from the analysis of comparisons between one paper taken from the OWN and the other from the TCD pool. Naturally, a paper in the TCD pool is very likely to have a citation impact larger than an article of the OWN, as the measure of the probability shows in Fig. 1a. Here, denotes the total number of citations accumulated by paper , and denotes the pool of the paper ( stands for OWN, and for TCD). Nonetheless, perceived impact of articles written by respondents themselves is generally higher than the ones of papers from the TCD pool, revealing a strong bias towards respondents’ own papers. This is visualized in Fig. 1B, where we consider the probability , i.e., the probability that an OWN article was preferred to one from the TCD pool (the notation denotes preference of paper with respect to paper ). To quantify the statistical significance of our measurements, we use absolute values of the standard score with respect to an unbiased binomial distribution, hence , where is the actual value of the probability measured in the experiment, , and is the size of the sample (i.e., number of comparisons). Note that, since only two possibilities are available, it doesn’t matter if we measure the probability or its complementary probability . The absolute value of the standard score doesn’t depend on this choice. The statistical interpretation of the standard score for an unbiased binomial distribution with sufficiently large sample sizes, as in our case, is similar to the one valid for the standard normal distribution, so that -values approximately correspond to , and the -value decreases exponentially fast as increases. The empirical results of Fig. 1B are highly unlikely to happen by chance. In fact, we have and , leading to . One may wonder whether this result is actually dependent on the difference in citation impact between the two papers or not. Fig. 1C points to a possible answer to this question. We consider the probability that respondents preferred the more cited paper among the two articles in the comparison as a function of the difference in citations between the two papers (for brevity we used the suffix to indicate the pools where the two papers were taken from). Surprisingly, citation and perceived impact are negatively correlated, in a statistically significant manner, for a wide range of values of the difference of citations accumulated by the two papers. Only when the citation impact of the TCD paper is much larger than the one of the OWN paper, we do not longer observe a statistically significant preference. The fact that scholars tended to systematically prefer their own articles regardless of the comparison can be interpreted as the consequence of an egocentric Ross and Sicoly (1979) or familiarity bias Zajonc (1968). Egocentric bias doesn’t necessarily have a negative connotation. The bias could be reconcilable with the fact that researchers base most of their work on results of their own past research, and they might have interpreted the generic question posed in the survey in this way. Furthermore, since researchers are inherently most familiar with their own work, the uncertainty with regards to their impact might be lower and hence these articles might enjoy the authors’ preference over a paper that is less familiar and whose impact is thus more difficult to assess reliably.
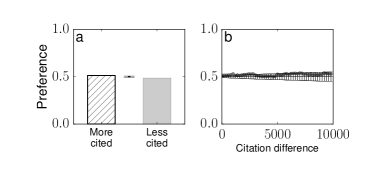
To discount for the presence of an egocentric or familiarity bias, we turn our attention to results obtained from comparisons where both papers were extracted from the same pool. We start from the description of our findings regarding the TCD pool (Fig. 2). Here, a positive correlation is observed between citation impact and perceived impact. Overall, papers with higher citation impact were preferred at higher rates by researchers, but only with probability leading to a standard score (-value = , Fig. 2a). Also, perceived impact doesn’t vary significantly with citation impact even if the difference in citations received by papers in the comparison can be larger than three orders of magnitude (Fig. 2b). The result seems not dependent on the age of papers, as we do not observe any systematic preference (Fig. A5). We speculate that, from the perspective of individual researchers, citing a top-cited article in their own research area may be interpreted as a public “homage” to the collective popularity of the paper, and thus reconcilable with a cumulative advantage principle Price (1976); Barabási and Albert (1999); Wang et al. (2013), the conformity bias Asch (1956), or a copying behaviour Krapivsky and Redner (2005); Simkin and Roychowdhury (2002), rather than a true recognition of the importance of the work for their own research.
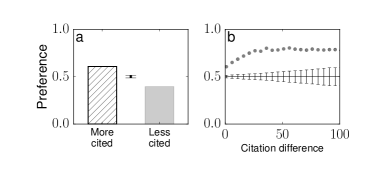
Figs. 1 and 2 suggest that the total number of citations received by a paper doesn’t reliably quantify the true impact or influence that the paper has for the actual research of a scholar. Such a conclusion is, however, overturned when we consider pairwise comparisons between articles from the OWN pool (Fig. 3). In this case, we observe a significant alignment between citation impact and expert impact as researchers systematically preferred the highest cited articles among their own articles. Preference to the more cited article was given with probability , corresponding to (Fig. 3a). Furthermore, we observed a systematic increase in the preference for the more cited paper as a function of the difference of citation impact between the papers in the comparison (Fig. 3b). Preference values saturate to almost , if citations accumulated by papers differ by or more. This effect is even stronger when one accounts for the general tendency of preference for more recent publications, and the fact that more recent publications generally exhibit lower citation impact (Fig. A6). Overall, this finding conclusively supports the observations by Ioannidis et al. in their small-scale survey Ioannidis et al. (2014).
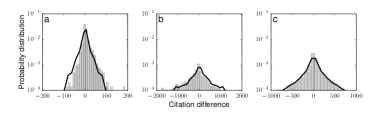
Our observations are further supported by the results presented in Fig. 4, where we consider the distribution of the difference in citation impact between preferred and non-preferred articles in different types of comparisons. The distribution is clearly right-skewed for comparisons between papers in the pool of OWN articles (Fig. 4a). The distribution for comparisons between articles from the OWN and TCD pools on the other hand has negative average value, and is negatively skewed (Fig. 4b). Finally, the distribution in Fig. 4c, for comparisons between papers in the TCD pool, provides evidence of a slight preference for articles with higher number of citations, but the preference is much less evident than in the case of Fig. 4a.
IV Conclusions
In summary, our work quantifies the degree of correlation between citation impact and a new post-publication metric, namely impact as perceived by the authors themselves. Our survey serves to understand whether citation numbers “truly” reflect the impact of papers as it pertains to the daily practice of researchers. This is a particular dimension of impact that has been not quantified before. The results from our large-scale survey generate one very important conclusion: citation numbers approximate with good accuracy the perceived impact of scientific publications, but only when psychological biases that make authors prefer their own papers above those of others are removed. This conclusion can be justified by the reasonable assumption that the self-assessment of one’s own papers is the most objective (and least biased) quantification of perceived impact since authors are assumed to know their own articles best and are thus the best judges of their comparative impact. Another possible explanation could be the Goodhart effect Goodhart (1984), namely that the preferences of authors are shaped by the knowledge of citations accumulated by their own papers. As a result, pairwise assessments of their own papers will be congruent with citation data.
Acknowledgements
We are grateful to all researchers who took part in our survey. This work uses Web of Science data by Thomson Reuters, provided by the Network Science Institute at Indiana University. This work is funded by the National Science Foundation (grant SMA-1446078 and SMA-1636636).
References
- Harzing (2010) A.-W. Harzing, The publish or perish book (Tarma Software Research, 2010).
- Bornmann and Daniel (2006) L. Bornmann and H.-D. Daniel, Scientometrics 68, 427 (2006), ISSN 0138-9130.
- Bornmann et al. (2008) L. Bornmann, G. Wallon, and A. Ledin, PLoS One 3, e3480 (2008).
- Lovegrove and Johnson (2008) B. G. Lovegrove and S. D. Johnson, Bioscience 58, 160 (2008).
- Hornbostel et al. (2009) S. Hornbostel, S. Böhmer, B. Klingsporn, J. Neufeld, and M. von Ins, Scientometrics 79, 171 (2009).
- Bornmann et al. (2011) L. Bornmann, R. Mutz, W. Marx, H. Schier, and H.-D. Daniel, Journal of the Royal Statistical Society: Series A (Statistics in Society) 174, 857 (2011).
- Bar-Ilan (2008) J. Bar-Ilan, Journal of Informetrics 2, 1 (2008).
- Van Noorden (2010) R. Van Noorden, Nature 465, 864 (2010).
- Hirsch (2005) J. E. Hirsch, Proceedings of the National academy of Sciences of the United States of America 102, 16569 (2005).
- Garfield (2006) E. Garfield, JAMA: the journal of the American Medical Association 295, 90 (2006).
- Bornmann and Daniel (2008a) L. Bornmann and H.-D. Daniel, Journal of Documentation 64, 45 (2008a).
- Sarigöl et al. (2014) E. Sarigöl, R. Pfitzner, I. Scholtes, A. Garas, and F. Schweitzer, arXiv preprint arXiv:1402.7268 (2014).
- Garfield (1979) E. Garfield, Scientometrics 1, 359 (1979).
- MacRoberts and MacRoberts (1996) M. H. MacRoberts and B. R. MacRoberts, Scientometrics 36, 435 (1996).
- Adler et al. (2009) R. Adler, J. Ewing, and P. Taylor, Statistical Science 24, 1 (2009).
- MacRoberts and MacRoberts (2010) M. H. MacRoberts and B. R. MacRoberts, Journal of the American Society for Information Science and Technology 61, 1 (2010).
- Wuchty et al. (2007) S. Wuchty, B. F. Jones, and B. Uzzi, Science 316, 1036 (2007).
- Radicchi et al. (2008) F. Radicchi, S. Fortunato, and C. Castellano, Proceedings of the National Academy of Sciences USA 105, 17268 (2008).
- Wang et al. (2013) D. Wang, C. Song, and A.-L. Barabási, Science 342, 127 (2013).
- Bornmann and Daniel (2008b) L. Bornmann and H. Daniel, Journal of Documentation 6, 45 (2008b).
- Bollen et al. (2009) J. Bollen, H. Van de Sompel, A. Hagberg, and R. Chute, PloS one 4, e6022 (2009).
- Sheehan (2001) K. B. Sheehan, Journal of Computer-Mediated Communication 6, 0 (2001).
- Bethlehem (2010) J. Bethlehem, International Statistical Review 78, 161 (2010).
- Ioannidis et al. (2014) J. Ioannidis, K. W. Boyack, H. Small, A. A. Sorensen, and R. Klavans, Nature 514, 561 (2014).
- Ross and Sicoly (1979) M. Ross and F. Sicoly, Journal of personality and social psychology 37, 322 (1979).
- Zajonc (1968) R. B. Zajonc, Journal of personality and social psychology 9, 1 (1968).
- Price (1976) D. d. S. Price, Journal of the American society for Information science 27, 292 (1976).
- Barabási and Albert (1999) A.-L. Barabási and R. Albert, science 286, 509 (1999).
- Asch (1956) S. E. Asch, Psychological Monographs 70, 1 (1956).
- Krapivsky and Redner (2005) P. Krapivsky and S. Redner, Physical Review E 71, 036118 (2005).
- Simkin and Roychowdhury (2002) M. V. Simkin and V. P. Roychowdhury, arXiv preprint cond-mat/0212043 (2002).
- Goodhart (1984) C. A. Goodhart, Problems of monetary management: the UK experience (Springer, 1984).
Appendix
Hello,

You are receiving this email because you are the
corresponding author of several scientific publications.
We are conducting a survey, the largest of its kind,
to determine the relative importance of scientific
publications as perceived by experienced researchers.

We’ve generated a survey specifically for you that
consists of anywhere between 1 and 10 pairs of papers
drawn from our database. The publications may be drawn
from your own publications or publications you’ve cited.
For each pair, we ask you to select the publication that
you believe is more influential for your own research.

It should take less than two minutes to complete the
ten comparisons. To participate, please follow this link:

bigscience.soic.indiana.edu/access-token/{{access_token}}

This survey is a step towards critically assessing the
way the scientific community measures the impact of
its work.  We hope you will participate and help further
this important research.

This survey is being conducted by Alexander Weissman and
Filippo Radicchi from the School of Informatics at
Indiana University. The research is sponsored by
the NSF (Award #1446078) and approved by the Indiana
University IRB (Protocol #1407480218). For more information,
please write to Filippo Radicchi: filiradi@indiana.edu.

With regards,

Alexander Weissman and Filippo Radicchi
School of Informatics and Computing
Indiana University
| Institution | Potential participants | Respondents | Response rate |
|---|---|---|---|
| Indiana University | |||
| University of Michigan | |||
| University of Minnesota | |||