Simulations of populations of Sapajus robustus in a fragmented landscape
Abstract
The study of populations subject to the phenomenon of loss and fragmentation of habitat, transforming continuous areas into small ones, usually surrounded by anthropogenic matrices, has been the focus of many researches within the scope of conservation. The objective of this study was to develop a computer model by introducing modifications to the renowned Penna Model for biological aging, in order to evaluate the behavior of populations subjected to the effects of fragmented environments. As an object of study, it was used biological data of the robust tufted capuchin (Sapajus robustus), an endangered primate species whose geographical distribution within the Atlantic Rain Forest is part of the backdrop of intense habitat fragmentation. The simulations showed the expected behaviour based on the three main aspects that affects populations under intense habitat fragmentation: the population density, area and conformation of the fragments and deleterious effects due the low genetic variability in small and isolated populations. The model showed itself suitable to describe changes in viability and population dynamics of the species crested capuchin considering critical levels of survival in a fragmented environment and also, actions in order to preserve the species should be focused not only on increasing available area but also in dispersion dynamics.
keywords:
computer modeling , habitat fragmentation , Penna modelPACS:
07.05.Tp , 87.23.Cc , 89.75.-kMSC:
[2008]23-5571 Introduction
Fragmentation and subsequent habitat loss is considered one of the major causes of biodiversity depletion in natural environments (Fahrig, 2003; Gibson et al., 2011; Vitousek et al., 1997). Effects of habitat fragmentation on populations will vary depending on species with different life story strategy (Robinson et al., 1995; Ewers and Didham, 2006; Ferraz et al., 2007; Koprowski, 2005; Srinivasaiah et al., 2012). Features such as large body size (Gehring and Swihart, 2003; Lomolino and Perault, 2007), specialized ecological requirements (Dale et al., 1996) and extensive home range (Crooks, 2002; Gerber et al., 2012) resulted in lowering the viability of populations subjected to loss and habitat fragmentation. Besides these effects take a role on entire structure of the community, such as changing patterns of richness and abundance depending on the size and degree of isolation of the fragments (Laurance, 1997; Laurance et al., 2002, 1998).
Some species of vertebrates, such as primates, are especially sensitive to loss and fragmentation of habitat. A recently published study showed that the diversity and abundance of primates was directly proportional to the size of the reserves (Pontes et al., 2012). The work of Chiarello and de Melo (2001) observed that the population density of three species of primates endemic to the Atlantic rainforest was directly correlated with the size of the fragments studied, leading to the conclusion that the species population viability may be compromised in the medium and long term in small fragments. Cristóbal-Azkarate and Arroyo-Rodríguez (2007) observed differences in diet, living area and population size of Alouatta palliata in fragmented areas of Mexico .
For the Atlantic rainforest biome, only 8.5% of its original area still resists and is heavily fragmented (SOS Mata Atlantica, 2013), resulting in a great number of species considered endangered of extinction. Nearly two thirds of the 26 endangered species of primates in Brazil take place in the Atlantic Forest (MMA, 2014). Concerning Sapajus, formerly genus Cebus (Alfaro et al., 2012), three out of the four endemic species of the Atlantic rainforest are considered endangered (S. xanthosternos, S. flavius and S. robustus). From this, Sapajus robustus is among the 10 most endangered primates on the Atlantic rainforest, being the third most endangered of the Cebidae in Brazil . Probably abundant in the past, the main threats to the populations of this species are habitat destruction and intense hunting pressure (IUCN, 2016; MMA, 2014).
In order to simulate the population dynamics of the species of primate Sapajus robustus subject to the effects of habitat fragmentation, a computational model, whose bases were structured from acknowledged Penna Model for biological aging (Penna, 1995) was developed. The Penna model is based on the “Mutation Accumulation”(Medawar, 1952) theory, which states that the pressure of natural selections decreases with age. That way, bad mutations or deleterious alleles would be harmless in early stages of life when the selection is strong, however, in old ages, when selection is weak, the sum of the effects of all mutations could cause dangerous outcomes in the organism. Only the individuals that bypass this first stage (the strong selection) and reach the sexual maturity are able to transmit their genes. Those genes start to accumulate in the population by genetic drift, leading to age evolution.
In this work we have developed a new version of sexual Penna model on a lattice with the introduction of a “identification genome” to take into account the effects of inbreeding, also simulating different space configurations. It was named here as “Fragmented Penna Model”.
This paper is organized as follows: Section 2: Modeling context; Section 3: Results and discussions; Session 4: Conclusion and Future Perspectives.
2 Modeling context
2.1 Penna model of aging - sexual version
The Penna model (Penna and Stauffer, 1995) is a computer model based in accumulation of mutation theory. This model has successfully explained the semelparous senescence of Pacific salmon(Penna et al., 1995), the control mechanism of menopause in parental care on sexual populations (Moss de Oliveira et al., 1999), the process of sympatric speciation(Oliveira et al., 2003), the effects of temperature over population dynamics(De Oliveira et al., 2008), the emergence of chaotic behaviour(Bernardes et al., 1998; Castro e Silva and Bernardes, 2001) and recent simulations have shown some results regarding population stability and carrying capacity (Piñol and Banzon, 2011). The first works with sexual version of Penna model was carried by (Bernardes, 1996; Stauffer et al., 1996). Sousa et al. (2000) simulated inbreeding depression through mutation accumulation theory. These authors tested, among other things, the effect of the influence of environmental conditions on reproduction and its consequences in population aging - longevity and catastrophic senescence. More recently, the Penna sexual model has been used not only as a mathematical perspective, but also considering simulation applied to the biological insect control(de Souza et al., 2009). Another adaptations using species characteristics, environmental factors and others were performed as well(Magdoń and Maksymowicz, 1999; Kim et al., 2012) .
In the sexual version, each individual is represented by two “alleles” or chronological genomes given by “bit” strings formed by two sequences of “0s” and “1s”. These sequences have a length of a computer word (usually 32 or 64 bits) that represents the organism’s life span. The bits in these words are time ordered in “years”, and a bit “1” in a given position represents a bad mutation that will lead to a disease in that related year. The disease will be expressed taking into account if the “1s” appears in both alleles (homozygous) or if the bad mutation is dominant. The diseases are accumulative, and the organism dies at the age when diseases are expressed. The whole population is aged structured and when sexual maturity is reached, couples are formed randomly among males and females with age greater than . The reproduction is done with crossing-over recombination of the parents words, and mutations are introduced in random positions of the offsprings chronological genomes. The gender of the descendants is chosen between male or female with 50% chance. In order to simulate a carrying capacity of the environment, , preventing an unrealistic growth of the population, each individual can die with a probability given by the Verhulst factor, namely , where is the number of individuals at time.
2.2 Biological parameters of the model
The present model was built considering the inherent biological parameters Sapajus robustus species from published studies (Table 1). Given the taxonomic conflict around the old genus Cebus111Silva Jr. (2001) elucidated the taxonomy of the genus Cebus, C. robustus revalidated as a species. More recently the species was separated into another genus: Sapajus (Alfaro et al., 2012)., this species was considered for many years as a subspecies of Cebus apella (Torres de Assumpção, 1983) or, as a subspecies of C. nigritus. That brings a lack of unique ecological data for the species. Thus, information that refer to genus, prioritizing those alluding to Sapajus nigritus were used. This species is phylogenetically close to S. robustus, and has its geographical distribution in the Atlantic Forest Biome (Alfaro et al., 2012; Rylands et al., 2005)
The species is distributed geographically in an area of intense interference on landscape by human activities, with extensive fragmented areas, and subject to various uses and occupations of the soil, which places it in a situation of greater vulnerability than S. nigritus.
All the information on the ecology and reproduction of the species, considered essential to feeding and dynamics of the model (Table 1), were then raised. Every significant aspect to the understanding of social structure and behavioral information were also assessed for information and indirect validation of the model.
| Atribute | Value | References |
|---|---|---|
| Dispersion age (male) (average) | 5.7 years | (Di Bitetti and Janson, 2001; Janson et al., 2012) |
| Sexual rate | 01:01:00 | (Fragaszy et al., 2004) |
| Longevity (average) | 32 years | (Di Bitetti and Janson, 2001; Janson et al., 2012) |
| Male sexual maturity | 5 - 7 years | (Di Bitetti and Janson, 2001; Janson et al., 2012) |
| Female sexual maturity | 5 - 8 years | (Di Bitetti and Janson, 2001; Fragaszy et al., 2004) |
| Gestation length (average) | 6 months | (Di Bitetti and Janson, 2001; Fragaszy et al., 2004; Janson et al., 2012) |
| Fertility rate | 1 | (Di Bitetti and Janson, 2001; Fragaszy et al., 2004; Janson et al., 2012) |
2.3 Fragmented Penna Model
In order to simulate the Sapajus robustus behaviour in fragmented environment, some adaptations were made in the Penna model. The first is the introduction correct set of parameters (Table 1). In this case, , lifespan=, and . The second one is the environment. In the original Penna model there is no definition of the environment, or “space” where the dynamics takes place. There is just one environmental parameter, the carrying capacity .
In the fragmented model, the simulations are done in square lattices of size , with one individual for cell. In the initial condition of the dynamic () the cells are filled randomly with equal amount of males and females, following a density . Each cell is labeled according to the sexual status of its individual at present time: (-1) for young males, (-2) sexually mature males, (1) young females, (2) sexually mature females, (3) pregnants and (4) parental care. It is important to note that, even if we do not take into account dispersion and sexual preferences, males and females have different reproductive stages during its lifetime. Pregnant females and females in parentar care are unable to reproduce while those states does not occur in males. The use of so many states are, in this case, necessary to perform a more realistic simulation of this species reprodutctive behaviour.
The simulation can be summarized as follows. Each time step is considered one year, in this period there are the steps of migration, reproduction, birth and death. At each time step first occurs the displacement of individuals. The sum of empty sites on Moore neighborhood222The Moore neighborhood is defined on a two-dimensional square lattice and is composed of a central cell and the eight cells which surround it. of each individual comprises its space accessible on that dispersion round. After that, the accessible sites are drawn in random order to be occupied by individuals in their neighborhood. When there are more individuals than empty sites, the individuals are chosen randomly. Males are allowed to perform larger displacements than females, since they can cross the border of their territory, under the probability of dispersion .
After the dispersion round, it is time for matching and reproduction, given by the following rules:
-
1.
Male and female must be sexually mature, that is, their age must be greater than .
-
2.
Females in parental care state (4) are unable to reproduce during 2 time steps.
-
3.
Females choose males in her Moore neighborhood.
-
4.
One couple will generate an offspring only if there was an empty cell available on neighborhood to be occupied by these offspring.
The displacement of the offspring is leaded by the mother. When the mother moves one cell, the offspring takes the previous mother position, following her during 2 time steps, never leaving the mother’s neighborhood. Finally, death comes by disease, for the individuals that reach the threshold .
The last adaptation is regarding to the length of the computer word used to model each individual. In this work, instead using words of 32 bits, each individual is represented by two words of 64 bits. The first 32 positions are “alleles” inherited from parents during sexual reproduction and used on the aging dynamics. The last 32 positions are used to identify the groups in fragmented areas, and called “identification genome”. The presence of this genome introduce the last modification in this version of Penna model. Apart from the random mutations introduced in reproduction, was inspect how similar the “identification genomes” of the parents are. The “identification genomes” are inherited from mothers, having no role in crossing over and reproduction. If the genomes are similar (meaning the parents are closed relatives), another deleterious mutation is introduced. The number of mutations inserted is proportional to the similarity as follows: if the similarity of the couple is in the range (meaning that they have at least one common grandparent), one mutation is added; if the similarity reaches (the couple are brothers), the amount of mutations increase to . The similarity of two individual is measured comparing their “identification genomes” one by one, which result in combinations, and choose the greater one as result. The introduction of different mutation rates was done in order to simulate inbreeding.
2.4 Functionality
To test the functionality of the model, the first analysis was performed on the behavior of the population as a function of the initial density (). Population at time zero consists of random samples of individuals with random bit-strings (both chronological genome and identification strings), ages uniformly distributed between 1 and 7 years, and female or male sex equally likely. The density at any time is computed as . Thus, it was necessary to assess what value of initial density would provide "chronological genome" variability for the population, from the point of temporary stabilization of the curve, were able to maintain viable populations for the model simulations. The initial density values ranged from 0.1 to 1.0 for three sizes lattice: L= (100 sites or cells), L= (400 sites or cells), and L= (900 sites or cells) (See Results, subsection 3.1).
The second analysis is related to how the area affects the population behavior. It was done by running the model with same initial condition for six different sizes of square lattices. In this case, the effect of area is measured without considering possible interactions between sub-lattices or the influence of variability of the "identification genome" in the results. (Subsection 3.2).
In the subsection 3.3, the same analysis was performed, but individuals, represented by dispersing males, were allowed to migrate from one territory to another. Those fragmented territories are represented by square sub-lattices.
In the subsection 3.4 was carried an investigation about the effects of geometric configuration in demographic behavior for each type of sub-lattice with and without dispersion of individuals. Lattices with sizes L = were divided into subnets of equal areas, but with different geometric configurations. The different subnets were here inserted to map the classic formation of patches subject to the so-called “edge effects” in fragmented environments (Murcia, 1995). They can also represent the demographic effects caused by loss of effective area in population viability (Fletcher et al., 2007). The edge effect tends to decrease the amount and diversity of resources, which may disrupt the balance between consumption and production that affect the carrying capacity of the environment (Fagan et al., 1999; Saunders et al., 1991). Besides directly influencing the mobility of organisms, altering the flow of emigration and immigration (Ries and Sisk, 2004).
Finally, in subsection 3.5 a study was developed about the effect that would have on population survival if the migration was made by females instead of males, regarding individuals dispersion. To avoid the influence of the previously observed area effects, it was used a fixed-size square lattice L= subdivided into four sub-lattices.
3 Results and discussion
3.1 The effect of density in population
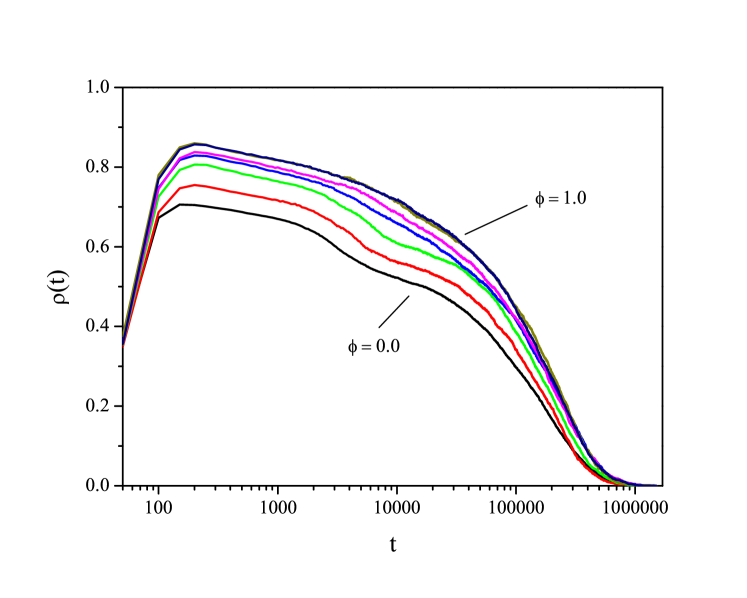
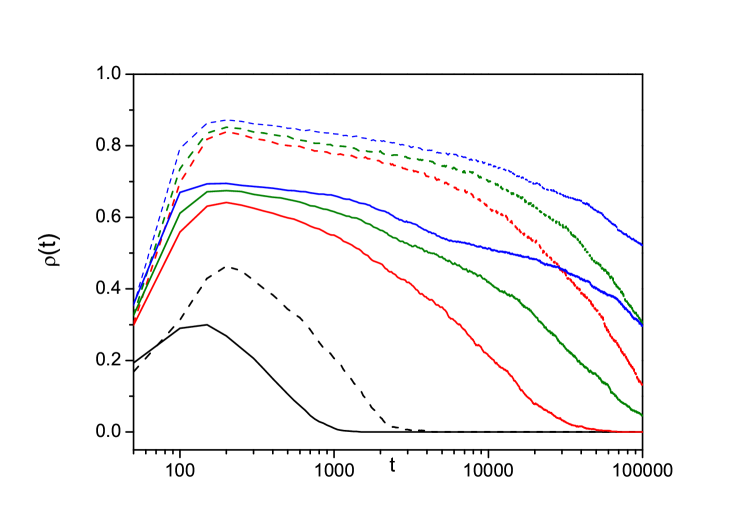
For a lattice with L = , considered small, any initial density condition leads to the disappearance of the population without presenting any stability period (Figure 1). However, the behavior of the population becomes different as the initial density reaches 0.5. For initial densities below 0.5, the population fell continuously until the total disappearance of the population, i.e., translates into a population on which the number of individuals who have a viable "chronological genome" is insignificant. The model eliminates individuals who fail to reach reproductive age at the threshold . Without a minimum number of breeders, the population tends to quickly fade. It is important to note that, due the huge simulation time steps, the horizontal time axis was changed to logarithmic. Therefore, the initial density cannot be taken as the intercept of the curves with -axis. In this plot, the curves are arranged in decreasing order of , starting from , the uppermost curve, to , the bottommost one. The same applies to all plots with logarithmic time axis.
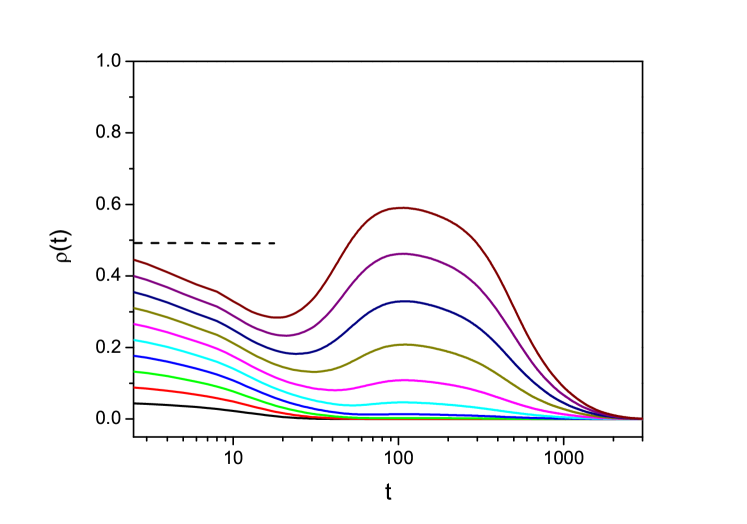
Initial densities above 0.5 show a initial drop in population, corresponding to the selection of viable chronological genome (dashed horizontal bar in Figure 1), followed by population growth; these growth rates are increasing functions of initial density values . Because space is the limiting factor here, populations behave as confined populations, where not even an increase of individuals selected in time is able to overcome the effects of a small population and low variability. It is possible that parentage factor leads to a rapid population decline due to the increasing number of deleterious mutations, analogous to the expected effects for small populations: such as demographic stochasticity and genetic drift (Young et al., 2000; Allendorf et al., 2013).
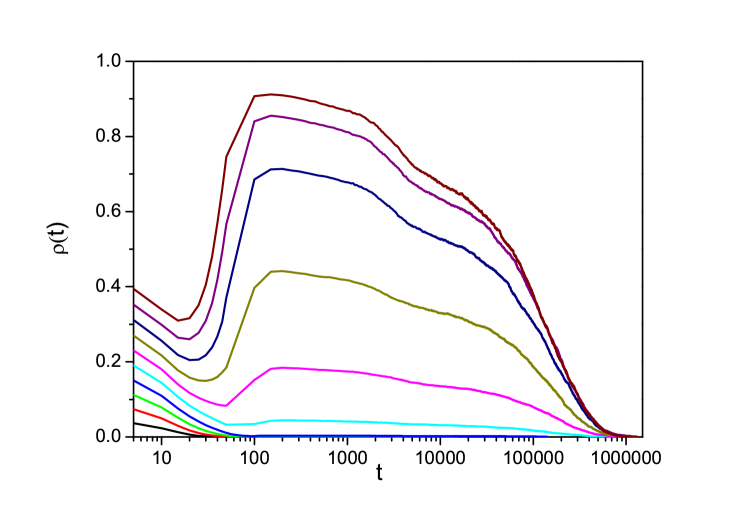
Similar outcomes were found for lattices of size L = (Figure 2), with the minimum viable initial density . Although, in this case, populations now have a much longer persistence time, they eventually fade – this is something inherent to the Penna model. Also, larger values of do not result here in longer persistence times, the influence of the space limitation factor.
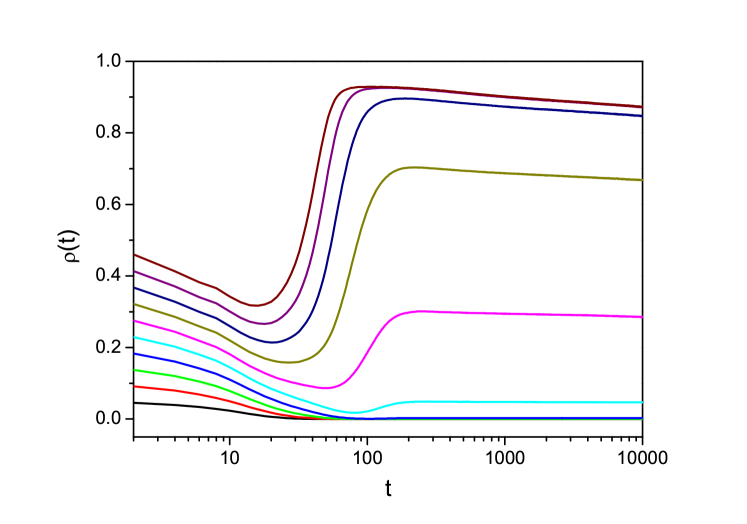
In lattices of size L = , after the initial “chronological genome” selection, the population recovers and remains at nearly constant density (Figure 3). The extremely low rate of population decline, with no predictable sudden drop even for very long simulation times 333The simulation times were limited by computer available RAM., make L = large-size lattices for the model. That is, to a large and densely populated lattice, the effect of the accumulation of deleterious mutations is not observed since a broader range of sexual partners will be present. A discernible effect in space limitation is the saturation of population density for . It is possible to say that the population reaches a steady state for an indefinitely long time, which means that the effect of deleterious mutations does not reach the threshold to take the population to extinction.
Low initial density values lead the population to disappearance in a short time, for all lattice sizes, and also below critical values in a viable size areas (L=, ). There is a minimum value 0.5, above which the population recovers and remains viable. The increased area and density variation from that minimum value will give the population higher survival rates, but always controlled by the environment capacity of the support, represented in this model by the space factor (available sites and isolating areas). In nature the space variable can be represented by the space itself. A good example would be a landscape of small fragments without connectivity; and the effective space or lack of proper resource: a large fragment in size, but composed of advanced forest interleaved with dirty pasture, or an area of mono-specific reforestation could represent a large area in spatial terms, but a non-effective area in ecological requirements.
The model developed was able to exhibit two major aspects related to population dynamics: the relationship between density-dependent growth(Lotka, 1925; Volterra, 1926) and the so-called minimum viable population (Soulé, 1985; Shaffer, 1981).
The density-dependent population growth reveals that low densities are not able to maintain viable populations, because they affect the rate of population growth if the density reaches a critical value. Low densities in nature represent a relationship between reproductive fitness of the individuals of a species and the density of conspecifics (Allee, 1927), lead to a decrease in the population growth and may cause, for example, local extinctions. Several factors are identified as causes of this effect, such as changing the values of sex ratio (Caughley, 1994), susceptibility to predation (Gascoigne and Lipcius, 2004) and especially the demographic aspects, such as active dispersal. For instance, demographic aspects can lead to the decrease in population growth by loss of individuals (Bonte et al., 2004; Young et al., 2000) and genetic factors such as inbreeding depression, result from the effects of genetic drift.
In this model, the concept of a minimum viable population was evidenced by the existence of a minimum viable density . Minimum viable population or minimum number of individuals in an ideal area refers to a minimum population capable of ensuring the persistence of the population in a viable state for a given time interval (Rai, 2003), i.e. maintaining gene flow and genetic diversity (Allendorf et al., 2013).
3.2 Effect of area in population behavior
Based on the results of density observed for three lattice sizes, was adopted to test the model and analyze other parameters. A density is able to support a sufficiently large variability of chronological genomes so that initial density is not a bias in the evolution of the model.
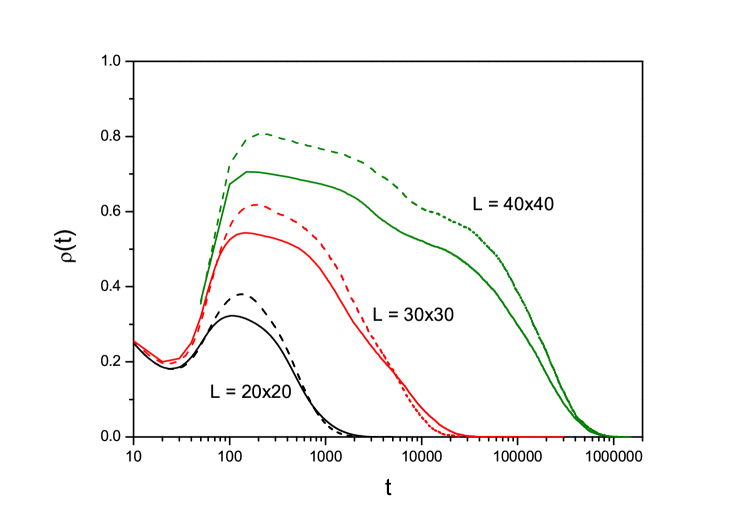
Six different sizes of square lattices were considered and results can be found in Figure 4. Clearly the lattice size (area) directly affects the viability of the population. Disregarding the initial occupation effect, a population confined to a small area tends to fade much faster than a population with the same rate of occupancy in a large area. Another behavior extract from this graph is that populations in a small lattice, although they can recover from the chronological genome selection, they do not maintain stabilized values, that is, the behavior is always downward to extinction. From L= on, it is observed the existence of a period of population stability, the length of which increases as lattice size increases, reaching a size of , where the space effect ceases. L= would then be an area size capable of maintaining a viable population for an indefinitely long period of time.
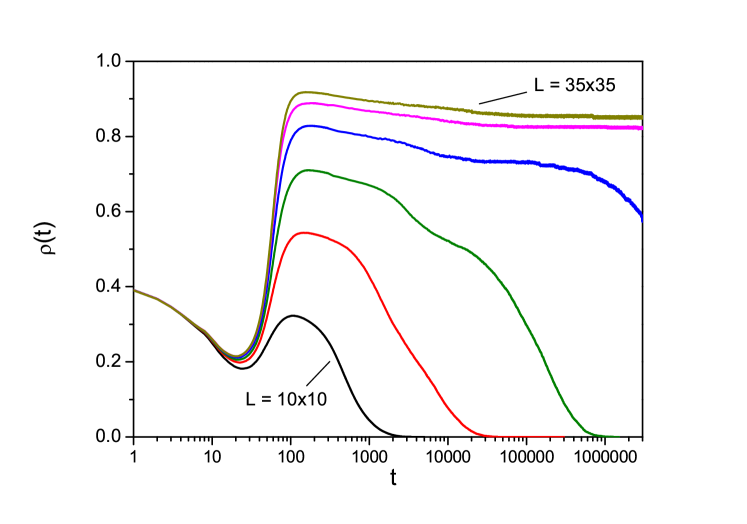
The effects of mutation accumulation seem to be diluted for large lattices. Since in this case, more groups with different “identification genomes” are present and also space mobility is greater, the population probably evolves with a weaker spatial correlation between siblings and parents, decreasing the probability of inbreeding. This aspect is further discussed ahead, when the inbreeding rate was analyzed in different scenarios.
Small lattices represent areas unable to maintain viable population for a long time. Two recent studies have shown the effects of area on the richness and abundance of primates: Boyle and Smith (2010) analyzed the distribution and persistence of six species of primates found in forest fragments, isolated from the year 1989 in the Brazilian Amazon. They have found a direct correlation between the wealth of primates and the size of the fragments. Harcourt and Doherty (2005) conducted a comprehensive analysis of the species-area relationship for tropical forest primates in studies compiled for about 133 fragments, distributed in 33 areas of the five continents. Data analysis indicated that the wealth and the proportion of the wealth of primates decrease in an almost linear relationship with the area of the fragment.
In this model the area showed an almost direct relation to population density. Lack of resources limits growth, leading to the intrinsic effects of small populations. On the other hand, a large area with few individuals and no external inputs (no migration) will suffer almost the same effect as a small, densely populated area: fewer individuals, fewer players, changes in the reproductive rate and low variability (genetic diversity) – "identification genomes". It is worth noting, however, that in nature , this relationship may vary considering intrinsic factors of the ecology of species. As example, the size of the living area (Mitani and Rodman, 1979; Pearce et al., 2013), body size (Bennett, 2009) and the degree of specialization with regard to ecological requirements (Chaves et al., 2012; Dale et al., 1996; Gascon et al., 1999; Püttker et al., 2013) becoming something more or less susceptible to the mentioned effects.
Studies for the genus Cebus showed that most species have large living areas, although they are able to keep up with high densities in small areas due to two main factors: the type of resources available in the area and; the ability to exploit the resources seasonally (Fragaszy et al., 2004). Although this model is not able to describe the individual contribution of each resource factor that controls the population dynamics of the species in the wild, the occupation of sites and parentage parameters have represented, so far, the general behavior of the population from critical levels of survival (a small, isolated area) to viable levels (a large continuous area).
3.3 The viability of population in square fragments
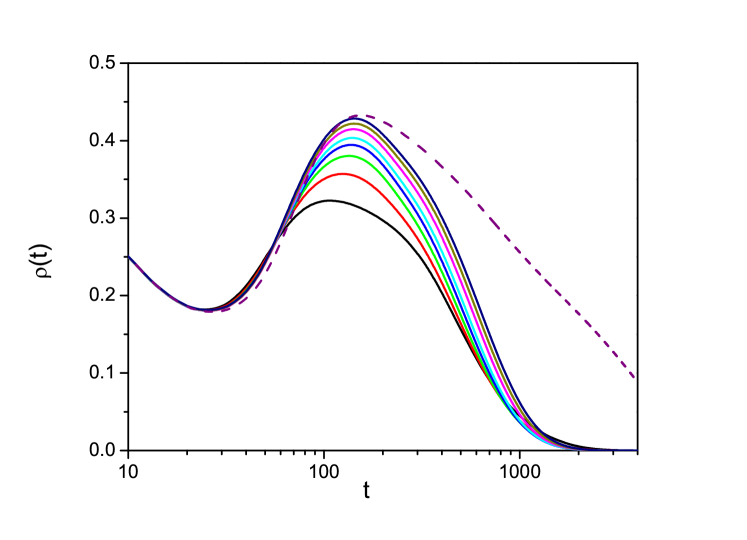
Considering a lattice of intermediate size, considering 400 sites for each sublattice (area), it is observed that from a (across the border) dispersion rate of the effects of variability can modify the behavior of the curve; although it will not generate increased survival (Figure 5). Thus, this value was defined as the cutoff, maintaining a dispersion of active probability throughout life, from 7 years old, and for males only.
When evaluating the effect of dispersion for different sizes of square sublattice, the change in the behavior of demographic population seems to be ineffective since even by increasing the size of lattices, i.e. eliminating the effect of the area, the dispersion changes the rate of population growth without, however, increasing the survival rate (Figure 6). For small sublattices ( and ) dispersing the population leads to a more rapid decrease, making it clear again that the effects of density (initial density) and the lattice size (size of the available area) reflects directly on the viability of the population. The flow of reproductive partner migrating from one lattice to another is insufficient to cause a visible change since the number of individuals as a whole is insufficient for the simple reproduction behavior. In this conformation, migration may represent a larger loss for the origin territory than it is a gain to the destination patch, which may be already irreversibly doomed.
The disappearance of the population with and without dispersion occurs essentially at the same time step, representing long-term absence of effective flow considering the behavior of the model (Figure 6). The behavior of dispersion of viable sub-lattice (L = ) seems to work as a leakage flux of males between different social groups within a continuous area. The flow occurs within the Hardy-Weinberg Balance for males (constant allelic frequency), i.e., maintaining the genetic diversity of the population. Thus, other factors such as space, resource competition and predation will control and maintain the population at a value of dynamic equilibrium (Weinberg, 1908). The dispersion, for this lattice configuration, will not alter survival, which is already controlled by the carrying capacity of the environment. Noting that the disappearance of the entire population, even for viable lattice sizes, is a consequence of the accumulation of deleterious mutations, inherent to the original model itself.
3.4 The viability of population in sub-lattices with different geometric configurations
Strictly considering the model, the behavior of populations differ for each type of sublattice because the movement changes. The Figure 7 shows the effect of the width by the length (perimeter/area) directly affects the behavior of graphics. The lower the perimeter/area ratio the greater the viability of a population (1.04; 0.58; 0.5; 0.4). Each sublattice edge will offer different possibilities of internal displacement according to the position of the individual. In sublattices there are fewer opportunities for displacement: there are at most (05) five shift positions inside the sublattice and up (05) five positions of choice for dispersion considering that this individual is positioned in top or bottom edge of its territory. In addition, if a female chooses a partner, but has no available space to allocate their offspring, the newborn dies. At the other extreme, to a sublattice the edge effects practically do not exist, since the possibilities of displacement and dispersion are virtually total (08 possibilities for movement and dispersion) for any position of the sublattice. In this case, the behavior will be dictated by total area and not by perimeter ratio. Since it remains a small lattice, the population tends to disappear in a relatively short time interval.
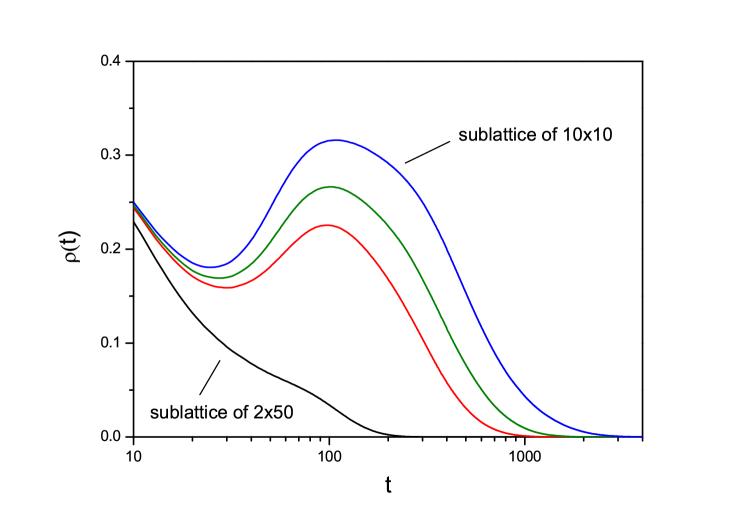
The dispersion is expected to be capable of preventing the extinction of populations by working as a mechanism of genetic exchange and maintenance (Hanski, 2001). However, their demographic behavior when subject to an active dispersal in 100-site sublattices, was decreasing until the total disappearance of the population in all sublattices. Although one can observe a period of population growth until reaching a maximum value for sublattices of L = , and , the density increase does not influence survival of populations, possibly due to the effect of small populations (Figure 8).
Thus, the contribution of “identification genomes” brought by dispersing individuals among small populations cannot cause changes that would bring the survival of population. Instead, the dispersion leads to a curve behavior with a sharper drop. The model does not consider the continuous flow between fragments, that is, a meta-population behavior. That would even the loss of balance between individuals and maintain patches as a single functional population (Hanski and Gaggiotti, 2004). Thus, the dispersion between small lattices, in this model, represents a loss of isolated individuals, since there is no guarantee that the individual will emigrate to a lattice minimally populated.
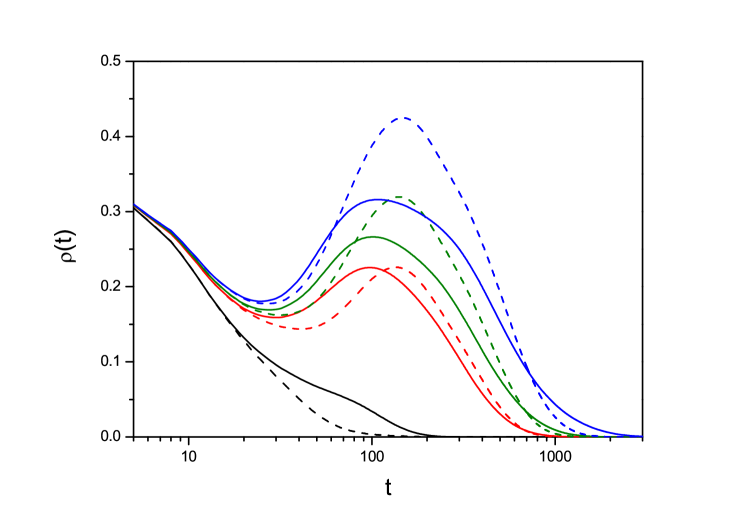
For lattices with sub-lattices of 400 sites, the same behavior found for sublattices of 100 sites is observed, on a much longer time, however (Figure 9). That shows the influence that the area plays in maintaining a population. By quadruplicating the area, considering the configuration of the sublattice of L = to 100 sites and L = to 400 sites, sublattice that would have similar geometric configuration, the average survival increases by a factor of six.
By introducing the dispersion model for sublattices with L = 400 sites, the observed demographic behavior completely changes (Figure 9) leading to believe that the effect of dispersion only makes sense when related to a (critical) minimum population size. The minimum value relates to the inflow and outflow of individuals, i.e. the model indicates there must be a balance between migrants and immigrants to the variability of “identification genomes” effectively raise survival chances.
In natural environments, the minimum population amount to be benefited with different populations of alleles inputs may not be related to an absolute value, as noted in the model, but an ecological value, such as a balance between active adults. Often, a few immigrants should be able restore the genetic diversity(Mills and Allendorf, 1996).
Figure 8 shows a high rate of population growth, after selecting the “chronological genome”, until reaching a maximum value (for L = and lattices), momentarily reducing the effect of accumulation of deleterious mutations. This maximum density may represent an ecological value that restores genetic diversity in nature. However, as the limiting factor in the model is the space, the population has a higher rate of encounter (mating) between relatives in small lattices. That quickly eliminates the effect of variability, increasing the accumulation of deleterious mutations and leading to population decline. In nature, the decrease is not due to to genetic effects, but the effects of lack of resources since the populations are isolated in small areas.
Thus, as observed in the model, in order to achieve survival, ie, demographic recovery, there must be resources available (sites, in the model). The entry of individuals in isolated populations can recover genetic diversity, but can not lead to population survival. Thus, even if dispersion is present, the recovery of populations in fragmented landscapes must come associated with measures to ensure the connectivity of the landscape, such as the formation of ecological corridors that increase the effective area; also the recovery of degraded areas, with reforestation involving native species and increase of food items.
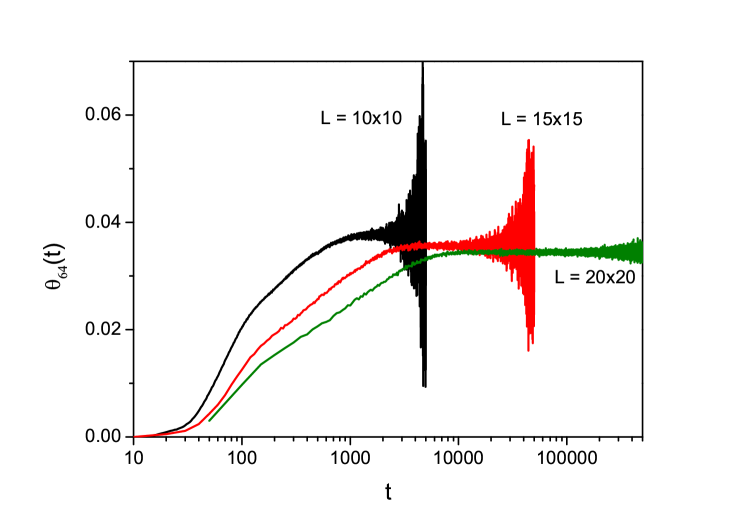
Figure 10 makes clear the effect of the area relative to the size of the population, at a fixed density in the variability of “identification genomes” in the population. Once the density is fixed, the larger the lattice is, the higher will be the number of individuals and therefore the smaller the fraction of matings between individuals of identical pairs of identification genomes. Over time the amount tends to reach a plateau, given the behavior of the model, i.e a function of predicted accumulation of deleterious mutations. In the final steps of time, the oscillatory behavior (high variance) of is a function of the density or its absence, down to the point where population vanishes. To obtain increased survival from individuals flow, the minimum area and the geometric conformation of the fragments must be taken into account. In nature, immigration is related to the distance between fragments and the type of matrix found in the surroundings. Therefore, no neighborhood effect (availability of sites) is present. In this model, this effect works as the support capacity of the fragment, so that fragments with high perimeter/area ratios present little core area and are unable to provide suitable amounts of resources.
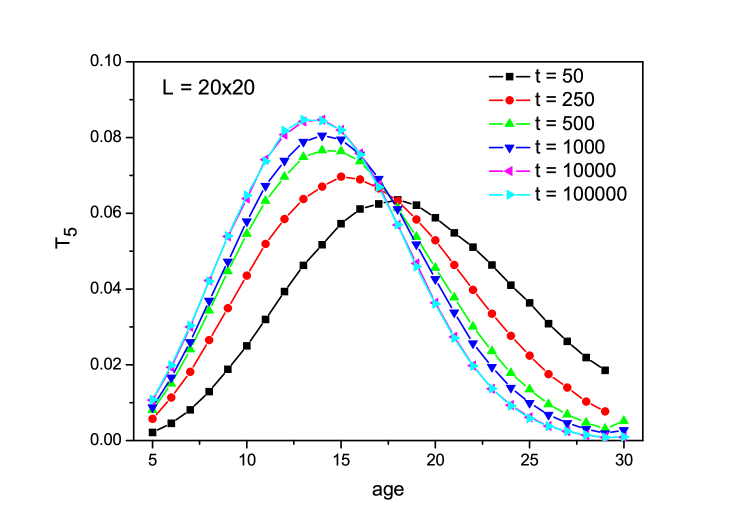
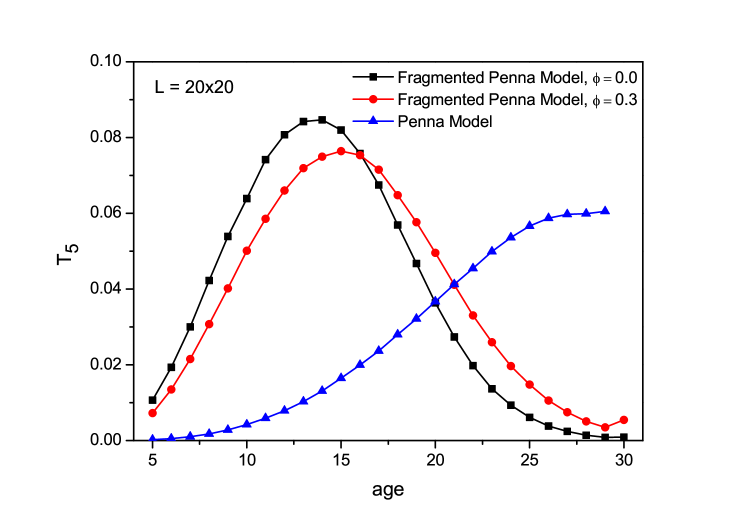
In order to analyze the accumulation of deleterious mutations it was plotted the fraction of population that reach the threshold T = 5, ()444It is important here to note that, once all individuals are diploid, 5 deletery mutations does not imply in 5 expressed diseases, due effects of dominance. That way, in the text, we refer to threshold T=5 or , when the individual suffers 5 acummulative diseases.as a function of age; i.e. at what age the individuals are doomed to die, for different times (Figure 11). Note that as the time passes, the 5th expressed disease occurs to younger ages due to the effect of inbreeding in the population. It is know that inbreeding is more likely when smaller is the population, and fragmented landscapes tends to decrease the population size once the individuals are trapped in a limited area. Figure 12 shows the same data of previous plot ( as function of age), but now comparing the fragmented Penna model with and , and the Penna model with the same paremeters, for the time 50000, at which the age structure of the population is already stable. It is important to remind that, in Figure 12, the Penna model runs on the lattice as the fragmented one, but lacking the part regarding to the “identification genome”. In Penna model, the 5th expressed disease will occur for older ages, that is, the model tends to select individuals over time so that the expressed diseases concentrate in more advanced ages. Differently from what happens with the Penna model, in our model the highest incidence of the 5th expressed disease occurs for intermediate ages. And when dispersion between networks is added, the effect is slightly minimized, with the highest incidence occurring for ages a little older. Note also that the curve with the spread after 16 years is always higher than the case without dispersion. And the curve without diffusion is higher compared with diffusion case, for ages under 16. This shows that diffusion is positive, postponing the incidence of the 5th expressed disease.
3.5 Preservation: Effect of dispersion and variability of “chronological genome” (gene flow) for females
The results found showed a completely different behavior from that observed previously for males, allowing a considerable survival for the population. When migration of females was imposed, the expected behavior of the model for individuals’ extinction by the accumulation of deleterious mutations, was shifted to much longer time steps (Figure 13).
This effect may have been caused by the increased breeding chances of the immigrant individual, since it is the female who chooses to which partner available in her neighborhood she will mate. By moving from one sublattice to another and meeting females, the chances of success of an immigrant male is 1:8 to be chosen by females of the new group. These chances increase now to 7:8 if a female immigrant meets male neighbors. A male can be surrounded by females, but may simply not be chosen. With the dispersion of females, the reproductive success, at every time step, inserts new individuals in the population that can also reproduce and gradually increase the variability in the population.
It was expected at first that the rate of variability and density would be more effective with the dispersion of males because males may mate with different females in the same time step. However, for a small lattice breed with several females means generating many brothers and sisters with few sites for displacement, which ends up increasing the chances of meeting and mating between siblings. In this way, the effect of deleterious mutations accumulation will overcome the effect of variability of an immigrant in the population.
Commonly a male can mate with more than one female in a single reproductive event, subject to the existing hierarchical relations for capuchin monkeys: multi-male, multi-female system (Fragaszy et al., 2004). In the present model, this effect is controlled by female choices. In nature the failure of male immigrants can be brought about by species behavioral effects, such as male acceptance in the new group, by males and females, where these choose which and how many males they want to mate (Fragaszy et al., 2004). In addition, the capuchin monkey females are said promiscuous, with the alpha male being given priority over matings, although every one may mate (Alfaro, 2005; Carosi, M. Linn, G. Visalberghi, 2005). Thus, copulation is not a guarantee of reproductive success and the male can take more than a reproductive cycle to pass on their genes to future generations.
4 Conclusion and Future Perspectives
This model was able to describe changes in viability and population dynamics of the species crested capuchin considering critical levels of survival in a fragmented environment. The effects generated by the amount, shape and isolation degree of habitat patches available; dispersal ability of species in different matrices; and effective population size, represented in the model by population density. The simulations results had a refined correspondence with what is expected to be found in the real space, enabling conservation implications. May be cited: 1) The effects of density (initial density) and lattice size (size of the available area) reflects directly in viability of the population. 2) The disappearance of the whole population, viable even for trellis size, is a consequence of deleterious mutations accumulation, inherent to the original model. An analogy to what is found in the effective size of a population. 3) The lower the perimeter/area ratio is; the greater is the viability of a population. 4) Dispersion between small lattices, in this model, represents a loss of isolated individuals. 5) In order to achieve survival (demographic recovery); there must be resources available, represented in the model by empty sites. 6) Even if the dispersion is observed, the recovery of populations in fragmented landscapes should come associated with measures to ensure the increase of the area for the species. 7) The increase in population survival, even with individuals’ dispersion, depends on the minimum area and the geometric conformation of the fragments. 8) Migration of females affects the behavior of the individuals’ extinction by the accumulation of deleterious mutations, more than in the case of males’ displacement.
Finally, it is believed that the overlap of a lattice containing attributes of the geographic space in this model (considering potential locations of species occurrence) is able to generate future extrapolations, with more reliable demographic values, in order to establish the species protection strategies.
Acknowledgements
We kindly thank L. Scoss and S. P. Ribeiro for invaluable discussions and Caio Martim Costa for English manuscript review. This work was supported by the Brazilian agencies FAPEMIG (Fundação de Amparo à Pesquisa do Estado de Minas Gerais), CAPES (Coordenação de Aperfeiçoamento de Pessoal de Nível Superior) and CNPq (Conselho Nacional de Desenvolvimento Científico e Tecnológico).
—————–
References
- Alfaro (2005) Alfaro, J. W. L., 2005. Male mating strategies and reproductive constraints in a group of wild tufted capuchin monkeys (cebus apella nigritus). American Journal of Primatology 67 (3), 313–328.
- Alfaro et al. (2012) Alfaro, J. W. L., Silva, J. d. S. E., Rylands, A. B., 2012. How different are robust and gracile capuchin monkeys, an argument for the use of sapajus and cebus. American Journal of Primatology 74 (4), 273–286.
- Allee (1927) Allee, W. C., 1927. Animal aggregation. The Quarterly Review of Biology, 367–398.
- Allendorf et al. (2013) Allendorf, F. W., Luikart, G., Aitken, S. N., 2013. Conservation and the genetics of populations, 2nd edition. Wiley-Blackwell.
- Bennett (2009) Bennett, B. C., 2009. Primate body size – home range relationships ; a comparison between four locomotive techniques. Undergraduate Journal of Anthropology 1, 131–140.
- Bernardes (1996) Bernardes, A. T., 1996. Strategies for reproduction and ageing. Annalen der Physik 508 (6), 539–549.
- Bernardes et al. (1998) Bernardes, A. T., Moreira, J.-G., Castro e Silva, A., 1998. Simulation of chaotic behaviour in population dynamics. The European Physical Journal B-Condensed Matter and Complex Systems 1 (3), 393–396.
- Bonte et al. (2004) Bonte, D., Lens, L., Maelfait, J.-P., 2004. Lack of homeward orientation and increased mobility result in high emigration rates from low-quality fragments in a dune wolf spider. Journal of Animal Ecology 73 (4), 643–650.
- Boyle and Smith (2010) Boyle, S. A., Smith, A. T., 2010. Can landscape and species characteristics predict primate presence in forest fragments in the brazilian amazon? Biological Conservation 143 (5), 1134–1143.
- Carosi, M. Linn, G. Visalberghi (2005) Carosi, M. Linn, G. Visalberghi, E., 2005. The Sexual Behavior and Breeding System of Tufted Capuchin Monkeys (Cebus apella). Advances in the Study of Behavior 35, 105–149.
- Castro e Silva and Bernardes (2001) Castro e Silva, A., Bernardes, A. T., 2001. Analysis of chaotic behaviour in the population dynamics. Physica A: Statistical Mechanics and its Applications 301 (1), 63–70.
- Caughley (1994) Caughley, G., 1994. Directions in conservation biology. Journal of Animal Ecology 63 (2), 215–244.
- Chaves et al. (2012) Chaves, O. M., Stoner, K. E., Arroyo-Rodríguez, V., 2012. Differences in diet between spider monkey groups living in forest fragments and continuous forest in mexico. Biotropica 44 (1), 105–113.
- Chiarello and de Melo (2001) Chiarello, A., de Melo, F., 2001. Primate Population Densities and Sizes in Atlantic Forest Remnants of Northern Espírito Santo, Brazil. International Journal of Primatology 22 (3), 379–396.
- Cristóbal-Azkarate and Arroyo-Rodríguez (2007) Cristóbal-Azkarate, J., Arroyo-Rodríguez, V., 2007. Diet and activity pattern of howler monkeys (alouatta palliata) in los tuxtlas, mexico: effects of habitat fragmentation and implications for conservation. American Journal of Primatology 69 (9), 1013–1029.
- Crooks (2002) Crooks, K. R., 2002. Relative sensitivities of mammalian carnivores to habitat fragmentation. Conservation Biology 16 (2), 488–502.
- Dale et al. (1996) Dale, V., Pearson, S., Offerman, H., O’Neill, R., 1996. Relating patterns of land-use change to faunal biodiversity in the central amazon. Biological Conservation 2 (76), 216.
- De Oliveira et al. (2008) De Oliveira, A., Martins, S., Zacarias, M., 2008. Computer simulation of the coffee leaf miner using sexual penna aging model. Physica A: Statistical Mechanics and its Applications 387 (2), 476–484.
- de Souza et al. (2009) de Souza, A., Martins, S., Zacarias, M., 2009. Computer simulation applied to the biological control of the insect aphis gossypii for the parasitoid lysiphlebus testaceipes. Ecological Modelling 220 (6), 756–763.
- Di Bitetti and Janson (2001) Di Bitetti, M. S., Janson, C. H., 2001. Reproductive socioecology of tufted capuchins (cebus apella nigritus) in northeastern argentina. International Journal of Primatology 22 (2), 127–142.
- Ewers and Didham (2006) Ewers, R. M., Didham, R. K., 2006. Confounding factors in the detection of species responses to habitat fragmentation. Biological Reviews 81 (01), 117–142.
- Fagan et al. (1999) Fagan, W. F., Cantrell, R. S., Cosner, C., 1999. How habitat edges change species interactions. The American Naturalist 153 (2), 165–182.
- Fahrig (2003) Fahrig, L., 2003. Effects of habitat fragmentation on biodiversity. Annual review of ecology, evolution, and systematics, 487–515.
- Ferraz et al. (2007) Ferraz, G., Nichols, J. D., Hines, J. E., Stouffer, P. C., Bierregaard, R. O., Lovejoy, T. E., 2007. A large-scale deforestation experiment: effects of patch area and isolation on amazon birds. science 315 (5809), 238–241.
- Fletcher et al. (2007) Fletcher, Jr, R. J., Ries, L., Battin, J., Chalfoun, A. D., 2007. The role of habitat area and edge in fragmented landscapes: definitively distinct or inevitably intertwined? Canadian journal of zoology 85 (10), 1017–1030.
- Fragaszy et al. (2004) Fragaszy, D. M., Visalberghi, E., Fedigan, L. M., 2004. The Complete Capuchin: The Biology of the Genus Cebus. Cambridge University Press.
- Gascoigne and Lipcius (2004) Gascoigne, J. C., Lipcius, R. N., 2004. Allee effects driven by predation. Journal of Applied Ecology 41 (5), 801–810.
- Gascon et al. (1999) Gascon, C., Lovejoy, T. E., Jr., R. O. B., Malcolm, J. R., Stouffer, P. C., Vasconcelos, H. L., Laurance, W. F., Zimmerman, B., Tocher, M., Borges, S., 1999. Matrix habitat and species richness in tropical forest remnants. Biological Conservation 91 (2–3), 223–229.
- Gehring and Swihart (2003) Gehring, T. M., Swihart, R. K., 2003. Body size, niche breadth, and ecologically scaled responses to habitat fragmentation: mammalian predators in an agricultural landscape. Biological Conservation 109 (2), 283–295.
- Gerber et al. (2012) Gerber, B. D., Karpanty, S. M., Randrianantenaina, J., 2012. The impact of forest logging and fragmentation on carnivore species composition, density and occupancy in madagascar’s rainforests. Oryx 46 (03), 414–422.
- Gibson et al. (2011) Gibson, L., Lee, T. M., Koh, L. P., Brook, B. W., Gardner, T., Barlow, J., Peres, C., Bradshaw, C. J., Laurance, W. F., Lovejoy, T. E., Sodhi, N. S., 2011. Primary forests are irreplaceable for sustaining tropical biodiversity. Nature 478 (7369), 378–81.
- Hanski (2001) Hanski, I., 2001. Population dynamic consequences of dispersal in local populations and in metapopulations. Dispersal. Oxford University Press, Oxford, 283–298.
- Hanski and Gaggiotti (2004) Hanski, I., Gaggiotti, O. E., 2004. Ecology, genetics, and evolution of metapopulations. Academic Press.
- Harcourt and Doherty (2005) Harcourt, A. H., Doherty, D. A., 2005. Species–area relationships of primates in tropical forest fragments: a global analysis. Journal of Applied Ecology 42 (4), 630–637.
- IUCN (2016) IUCN, 2016. Red List of Threatened Species.
- Janson et al. (2012) Janson, C., Baldovino, M. C., di Bitetti, M., 2012. Long-Term Field Studies of Primates. Springer Berlin Heidelberg, Berlin, Heidelberg, Ch. The Group Life Cycle and Demography of Brown Capuchin Monkeys (Cebus [apella] nigritus) in Iguazú National Park, Argentina, pp. 185–212.
- Kim et al. (2012) Kim, Y., Choi, W., Yook, S.-H., 2012. Modified penna bit-string network evolution model for scale-free networks with assortative mixing. Journal of the Korean Physical Society 60 (4), 621–624.
- Koprowski (2005) Koprowski, J. L., 2005. The response of tree squirrels to fragmentation: a review and synthesis. Animal Conservation 8 (4), 369–376.
- Laurance (1997) Laurance, W. F., 1997. Responses of Mammals to Rainforest Fragmentation in Tropical Queensland: a Review and Synthesis. Wildlife Research 24 (5), 603.
- Laurance et al. (1998) Laurance, W. F., Ferreira, L. V., Rankin de Merona, J. M., Laurance, S. G., 1998. Rain forest fragmentation and the dynamics of amazonian tree communities. Ecology 79 (6), 2032–2040.
- Laurance et al. (2002) Laurance, W. F., Lovejoy, T. E., Vasconcelos, H. L., Bruna, E. M., Didham, R. K., Stouffer, P. C., Gascon, C., Bierregaard, R. O., Laurance, S. G., Sampaio, E., 2002. Ecosystem Decay of Amazonian Forest Fragments: a 22-Year Investigation. Conservation Biology 16 (3), 605–618.
- Lomolino and Perault (2007) Lomolino, M. V., Perault, D. R., 2007. Body size variation of mammals in a fragmented, temperate rainforest. Conservation Biology 21 (4), 1059–1069.
- Lotka (1925) Lotka, A. J., 1925. Elements of Physical Biology. Williams and Wilkins Company.
- Magdoń and Maksymowicz (1999) Magdoń, M. S., Maksymowicz, A. Z., 1999. Penna model in migrating population–effect of environmental factor and genetics. Physica A: Statistical Mechanics and its Applications 273 (1), 182–189.
- Medawar (1952) Medawar, P., 1952. An Unsolved Problem of Biology. H.K. Lewis and Company, London.
- Mills and Allendorf (1996) Mills, L. S., Allendorf, F. W., 1996. The one-migrant-per-generation rule in conservation and management. Conservation Biology 10 (6), 1509–1518.
- Mitani and Rodman (1979) Mitani, J. C., Rodman, P. S., 1979. Territoriality: The relation of ranging pattern and home range size to defendability, with an analysis of territoriality among primate species. Behavioral Ecology and Sociobiology 5 (3), 241–251.
- MMA (2014) MMA, M. d. M. A., 2014. Portaria nº 444, de 17 de dezembro de 2014. anexo i: Lista nacional oficial de espécies da fauna ameaçada de extinção. Diário Oficial da União 69 (9), 1013–1029.
- Moss de Oliveira et al. (1999) Moss de Oliveira, S., Bernardes, A. T., Sá Martins, J., 1999. Self-organisation of female menopause in populations with child-care and reproductive risk. The European Physical Journal B 7 (3), 501–504.
- Murcia (1995) Murcia, C., 1995. Edge effects in fragmented forests: implications for conservation. Trends in ecology & evolution 10 (2), 58–62.
- Oliveira et al. (2003) Oliveira, S. M. D., Stauffer, D., Sousa, A. O., 2003. Computer Simulation of Sympatric Speciation with Penna Ageing Model III The Penna model with phenotype selection. Brazilian Journal of Physics 33 (3), 623–627.
- Pearce et al. (2013) Pearce, F., Carbone, C., Cowlishaw, G., Isaac, N. J. B., 2013. Space-use scaling and home range overlap in primates. Proceedings of the Royal Society B: Biological Sciences 280 (1751).
- Penna et al. (1995) Penna, T., de Oliveira, S. M., Stauffer, D., 1995. Mutation accumulation and the catastrophic senescence of the pacific salmon. Physical Review E 52 (4), R3309.
- Penna and Stauffer (1995) Penna, T., Stauffer, D., 1995. Efficient monte carlo simulation of biological aging. International Journal of Modern Physics C 6 (02), 233–239.
- Penna (1995) Penna, T. J. J., 1995. A bit-string model for biological aging. Journal of Statistical Physics 78 (5), 1629–1633.
- Piñol and Banzon (2011) Piñol, C. M., Banzon, R., 2011. Catastrophic senescence and semelparity in the penna aging model. Theory in Biosciences 130 (2), 101–106.
- Pontes et al. (2012) Pontes, A. R. M., de Paula, M. D., Magnusson, W. E., 2012. Low Primate Diversity and Abundance in Northern Amazonia and its Implications for Conservation. Biotropica 44 (6), 834–839.
- Püttker et al. (2013) Püttker, T., Bueno, A. A., de Barros, C. d. S., Sommer, S., Pardini, R., 2013. Habitat specialization interacts with habitat amount to determine dispersal success of rodents in fragmented landscapes. Journal of Mammalogy 94 (3), 714–726.
- Rai (2003) Rai, U. K., 2003. Minimum Sizes for Viable Population and Conservation Biology. Nature 1, 3–9.
- Ries and Sisk (2004) Ries, L., Sisk, T. D., 2004. A predictive model of edge effects. Ecology 85 (11), 2917–2926.
- Robinson et al. (1995) Robinson, S. K., Thompson, F. R., Donovan, T. M., Whitehead, D. R., Faabrog, J., 1995. Regional forest fragmentation and the nesting success of migratory birds. Science 267, 1987–1990.
- Rylands et al. (2005) Rylands, A. B., Kierulff, M. C. M., Mittermeier, R. A., 2005. Notes on the taxonomy and distributions of the tufted capuchin monkeys (cebus, cebidae) of south america. Lundiana 6, 97–110.
- Saunders et al. (1991) Saunders, D. A., Hobbs, R. J., Margules, C. R., 1991. Biological Consequences of Ecosystem Fragmentation: A Review. Conservation Biology 5 (1), 18–32.
- Shaffer (1981) Shaffer, M. L., 1981. Minimum Population Sizes for Species Conservation. BioScience 31 (2), 131–134.
- Silva Jr. (2001) Silva Jr., J. S. E., 2001. Especiação nos macacos-prego e caiararas, gênero Cebus erxleben, 1777 (Primates, Cebidae). Ph.D. thesis, Universidade Federal do Rio de Janeiro.
- SOS Mata Atlântica and INPE (2013) SOS Mata Atlântica and INPE, 2013. Atlas dos remanescentes florestais da Mata Atlântica período 2011-2012.
- Soulé (1985) Soulé, M. E., 1985. What is Conservation Biology? BioScience 35 (11), 727–734.
- Sousa et al. (2000) Sousa, A. d. O., de Oliveira, S. M., Bernardes, A. T., 2000. Simulating inbreeding depression through the mutation accumulation theory. Physica A: Statistical Mechanics and its Applications 278 (3), 563–570.
- Srinivasaiah et al. (2012) Srinivasaiah, N. M., Anand, V. D., Vaidyanathan, S., Sinha, A., 2012. Usual populations, unusual individuals: insights into the behavior and management of Asian elephants in fragmented landscapes. PloS one 7 (8), e42571.
- Stauffer et al. (1996) Stauffer, D., de Oliveira, P., de Oliveira, S., dos Santos, R., 1996. Monte Carlo simulations of sexual reproduction. Physica A: Statistical Mechanics and its Applications 231 (4), 504–514.
- Torres de Assumpção (1983) Torres de Assumpção, C., 1983. An ecological study of the primates of south-eastern Brazil, with an re-appraisal of "Cebus apella" races. Ph.D. thesis, Univ. of Edinburgh.
- Vitousek et al. (1997) Vitousek, P. M., Mooney, H. A., Lubchenco, J., Melillo, J. M., 1997. Human domination of earth’s ecosystems. Science 277 (5325), 494–499.
- Volterra (1926) Volterra, V., 1926. Fluctuations in the abundance of a species considered mathematically. Nature 118, 558–560.
- Weinberg (1908) Weinberg, W., 1908. Über den Nachweis der Vererbung beim Menschen. Vol. 64.
- Young et al. (2000) Young, A., Industry, C. P., Genetics, F. C., Clarke, G., Entomology, C., Ecology, M., Plans, A., 2000. Genetics , Demography and Viability of Fragmented Populations. Cambridge University Press.