Host galaxies and large-scale structures of active galactic nuclei
Abstract
Our understanding of the cosmic evolution of supermassive black holes (SMBHs) has been revolutionized by the advent of large multiwavelength extragalactic surveys, which have enabled detailed statistical studies of the host galaxies and large-scale structures of active galactic nuclei (AGN). We give an overview of some recent results on SMBH evolution, including the connection between AGN activity and star formation in galaxies, the role of galaxy mergers in fueling AGN activity, the nature of luminous obscured AGN, and the connection between AGN and their host dark matter halos. We conclude by looking to the future of large-scale extragalactic X-ray and spectroscopic surveys.
keywords:
(galaxies:) quasars: general, galaxies: Seyfert, surveys, X-rays: galaxies, (cosmology:) large-scale structure of universe1 Introduction
The past two decades have seen great progress in understanding the growth and evolution of supermassive black holes (SMBHs) over cosmic time (for one of several recent reviews see Alexander & Hickox 2012). It is now well-established that SMBHs obtain the bulk of their mass through accretion of matter, observable as active galactic nuclei (AGN), and that there are connections between the cosmic growth of SMBHs and that of their host galaxies, due to common evolution histories or to feedback processes that link the growth of SMBHs to the state of gas and star formation in their host systems (see Fabian 2012 and Kormendy & Ho 2013 for recent reviews).
Recently, large multiwavelength extragalactic surveys have enabled breakthroughs in understanding the AGN-galaxy connection through detailed statistical studies of the host galaxies and large-scale structures of AGN. The resulting insights into SMBH evolution are analogous to the understanding of galaxies that emerged from the large redshift surveys in the 2000’s (e.g., Strateva et al. 2001; Zehavi et al. 2005; Blanton 2006; Coil et al. 2006). Particularly valuable observational resources have been the Chandra X-ray Observatory (Tananbaum et al., 2014) and XMM-Newton (Jansen et al., 2001), for performing deep X-ray surveys detecting large numbers of AGN to high redshift; the Herschel Space Observatory (Pilbratt et al., 2010) to constrain star formation rates (SRFs) in AGN host galaxies; the Spitzer Space Telescope (Werner et al., 2004) and Wide-Field Infrared Survey Explorer (WISE; Wright et al. 2010) for identifying large numbers of luminous, obscured quasars; the Nuclear Spectroscopic Telescopic Array (NuSTAR Harrison et al. 2013) for studying the high-energy emission from heavily obscured AGN; and extensive follow-up of AGN with ground-based multi-object spectrographs.
In this Proceedings, we begin with an overview of recent progress on the connection between AGN activity and star formation (SF) in galaxies. We then discuss the link between AGN activity and galaxy mergers, highlight observational studies of the luminous, obscured AGN that may represent an important phase in the evolution of massive galaxies, and discuss the utility of AGN clustering measurements in understanding the connection between AGN and their host dark matter (DM) halos. Finally, we look toward the future of statistical studies of AGN host galaxies and structures with the next generation of very large X-ray and spectroscopic surveys.
2 The AGN star-formation connection
There is compelling indirect evidence for a global connection between AGN activity and SF in galaxies, from the tight correlation between SMBH masses and galaxy properties (e.g., McConnell & Ma, 2013; Kormendy & Ho, 2013) and the similar cosmic evolutionary histories of these two processes (e.g., Merloni & Heinz, 2013; Kormendy & Ho, 2013). We can now probe this connection directly by observing the SF properties of AGN host galaxies. One useful observational tool is the distribution of galaxy colors and luminosities (e.g., Strateva et al., 2001; Blanton, 2006), which clearly separates galaxies into two populations: blue, star-forming, relatively low-mass galaxies, and red, passive, higher-mass systems. When we locate AGN host galaxies (out to redshifts ) in color-luminosity space, we find that the hosts of radiatively efficient, rapidly growing SMBHs (identified as AGN based on X-ray, infrared, or optical line emission) are predominantly located among the star-forming systems (e.g., Nandra et al., 2007; Hickox et al., 2009; Goulding et al., 2014; Mendez et al., 2015). There is a preference for more luminous AGN to be found in the more massive, redder end of the star-forming galaxy population (e.g., Schawinski et al., 2009, 2010b). perhaps connected to the higher Eddington limit associated with their more massive SMBHs (e.g., Aird et al., 2012; Trump et al., 2015).
We can further study the host galaxies of mechanically-dominated AGN identified by radio synchrotron emission from relativistic jets. In contrast to the radiatively-efficient AGN, radio AGN are found predominantly in massive, passive galaxies, generally avoiding the star-forming systems (e.g., Hickox et al., 2009; Goulding et al., 2014; Mendez et al., 2015). (Note that AGN with radio jets and high-excitation emission lines are generally found among the star-forming galaxies; Smolčić 2009.) These results point toward a general picture in which rapidly-growing, radiatively-efficient AGN are found in star-forming galaxies, fueled by the supply of cold gas that also produces the SF, while mechanically-dominated, slowing growing AGN are found in passive galaxies, producing the feedback required to stop cooling of hot gas in their massive halos (e.g., Bower et al., 2006; Croton et al., 2006).
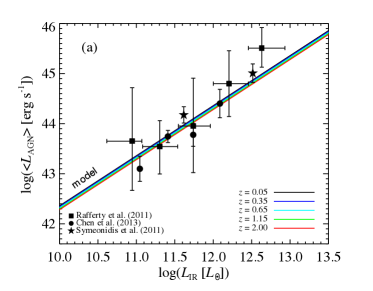
Recent studies have built on this work by taking advantage of Herschel for reliable measures of SFR in AGN host galaxies based on far-IR emission, where there is little contamination from the AGN (e.g., Mullaney et al., 2011a). These results have shown that when averaging over the full star-forming galaxy population, the average SMBH growth is correlated with SFR (e.g., Mullaney et al., 2012), with a linear relationship between SFR and average accretion rate (e.g., Chen et al., 2013, Figure 1). However, the picture becomes more complicated when looking at individual AGN. The colors, SFRs, spatial clustering, and merger rates of AGN hosts are essentially indistinguishable from typical star-forming galaxies of similar mass (e.g., Cardamone et al., 2010; Xue et al., 2010; Mullaney et al., 2011b; Cisternas et al., 2011; Treister et al., 2012; Mendez et al., 2015). The average SFR of AGN host galaxies at depends strongly on redshift similarly to inactive galaxies, but shows little if any dependence on AGN luminosity (e.g., Shao et al., 2010; Rosario et al., 2012; Stanley et al., 2015).
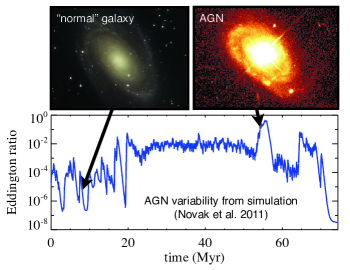
We therefore are presented with a puzzle in which there is a strong global correlation between SF and AGN activity, but the links are weak if non-existent for individual sources. This raises the question: ”why are only a fraction of star-forming galaxies observed as AGN?” The answer appears to lie in the stochastic variability of AGN. Simulations (e.g., Novak et al., 2011; Gabor & Bournaud, 2013) and observations of AGN light echoes (e.g. Schawinski et al., 2010a; Keel et al., 2015) suggest that AGN accretion can vary over many orders of magnitude on timescales of 1 Myr or less, much shorter than the typical evolution timescale for galaxies. We might therefore think of all star-forming galaxies as hosting an AGN, when averaged over Myr timescales. Hickox et al. (2014) presented a simple analytic model for the AGN population based on a direct connection between SMBH accretion and star formation and including stochastic variability. This simple model is able to reproduce the observed relationships between AGN luminosity, SFR, and merger rates, as well as the general evolution of the AGN luminosity function. Other recent simulations have found similar results (e.g., Thacker et al., 2014; Volonteri et al., 2015), highlighting the need for future studies to not simply compare AGN host galaxies with their inactive counterparts, but to measure the distribution of AGN accretion rates as a function of host galaxy properties.
Given the clear connection between SMBH growth and SF, an important question arises regarding the nature of AGN feedback, and whether in some cases the AGN can shut down star formation by heating or removing the gas supply (see Fabian 2012 for a review). Some simulations show that outflows from radiatively efficient AGN can have a strong effect on galaxy-scale gas (e.g., Di Matteo et al., 2005; Booth & Schaye, 2011), but other models of AGN in disk galaxies show a limited impact of the AGN on the star-forming disk (Gabor & Bournaud, 2014). Some theoretical studies also indicate that AGN activity can trigger SF through positive feedback (e.g., Zubovas et al., 2013; Nayakshin, 2013). Observationally, AGN radiation can ionize gas in the galaxy out to large scales (e.g., Hainline et al., 2013, 2014), and outflows clearly drive out large quantities of ionized and molecular gas in some systems (e.g., Harrison et al., 2014; Feruglio et al., 2015). There are systems in which powerful outflows appear to be driven by compact starbursts rather than AGN (e.g., Diamond-Stanic et al., 2012; Geach et al., 2014). Together, these results point toward a complex relationship between AGN activity and star formation, and understanding the details of this connection is the focus of a great deal of ongoing research.
3 Fueling of AGN by galaxy mergers
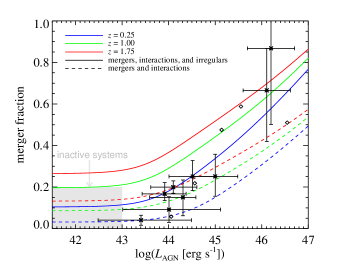
An important aspect of the connection between SMBHs and galaxies has been the role of galaxy mergers in fueling AGN activity. This has long been a matter of debate, with some studies showing a clear link between AGN activity and mergers (e.g., Bahcall et al., 1997; Urrutia et al., 2008; Koss et al., 2010; Glikman et al., 2015), while other studies show effectively no difference in the merger rates between AGN and inactive galaxies (e.g., Grogin et al., 2005; Gabor et al., 2009; Cisternas et al., 2011; Kocevski et al., 2012; Mechtley et al., 2015). Treister et al. (2012) suggested that these differences can be reconciled when considering AGN as a function of luminosity, with powerful quasars commonly found in mergers, while less luminous AGN have merger rates of 20% or less, similar to ”normal” galaxies (Figure 2, left). While this work necessarily relies on heterogeneous definitions of ”mergers”, the results are broadly suggestive of a trend with AGN luminosity.
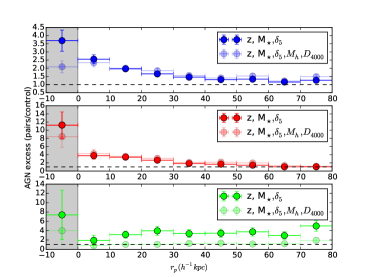
A powerful way to test the merger-AGN connection is by directly tracing AGN activity along the merger sequence, using kinematic pairs of galaxies. Kinematic pairs are well-known to show an enhancement of SFR that increases with decreasing separation (e.g., Ellison et al., 2008; Woods et al., 2010; Kampczyk et al., 2013). The incidence of AGN activity shows very similar behavior (Figure 2, right), for AGN identified from optical emission lines (Ellison et al., 2015), X-ray luminosity (Silverman et al., 2011), or mid-infrared (IR) colors (Satyapal et al., 2014). Radio-loud AGN with low-excitation optical spectra are also more common in galaxy pairs, however in constrast to the radiatively-efficient AGN, this enhancement does not depend on separation (Ellison et al., 2015), suggesting that fueling is not directly related to galaxy interactions. To probe the end stages of the merger sequence, one can search for galaxies with double nuclei through careful analysis of optical images. These double nuclei show a clear enhancement in the frequency of X-ray AGN (Lackner et al., 2014), further supporting a connection between AGN and mergers.
Despite these clear connections between AGN and mergers, a statistical analysis of the AGN population suggests that mergers are associated with only only a minority (20%) of the total AGN activity (Lackner et al., 2014). In general, SMBH growth may simply trace the availability of cold gas, so that most AGN are found in normal star-forming galaxies, but the probability of finding an AGN is enhanced in mergers just as is observed for SF. Thus it may be possible to reconcile apparently contradictory observations with a picture in which SMBH growth is connected to galaxy interactions, but due to stochastic variability, an excess in the fraction of mergers is only detectable for the most luminous AGN (Hickox et al., 2014, Figure 2, right).
4 Obscured AGN and the evolutionary sequence
In studying the population of luminous AGN fueled by major mergers, it is common to invoke an evolutionary sequence in which the merger produces a powerful, dust obscured starburst, followed by a period of powerful obscured AGN activity and finally by an unobscured quasar (e.g., Sanders et al., 1988; Hopkins et al., 2008). In this scenario, obscured quasars represent an important phase in the life of massive galaxies. With sensitive mid-IR observations from Spitzer and WISE, we have now identified large numbers of luminous obscured quasars with little or no rest-frame optical emission from the nucleus (e.g., Hickox et al., 2007; Stern et al., 2012; Assef et al., 2013, 2015). X-ray observations (particularly with NuSTAR) suggest these obscured quasars are heavily buried or even Compton-thick (e.g., Stern et al., 2014; Lansbury et al., 2014, 2015), and Herschel observations suggest that these sources are associated with enhanced star formation (Chen et al., 2015).

In addition to these heavily buried quasars, it is particularly interesting to study quasars that are emerging from the dust. These show intermediate levels of dust extinction, and so are detectable as luminous broad-line AGN but with significant reddening of their optical and UV emission. Samples of these ”red QSOs” have been identified using near-IR observations in concert with the radio (e.g., Glikman et al., 2007, 2012, 2013), mid-IR (e.g., Banerji et al., 2012, 2013, 2015), and X-rays (e.g., Brusa et al., 2005, 2010). These sources tend to be among the most luminous quasars known (Glikman et al., 2012; Banerji et al., 2015), are characteristically found in ongoing major mergers (e.g., Urrutia et al., 2008; Glikman et al., 2015, Figure 3), and often show powerful outflows (Brusa et al., 2015a, b; Perna et al., 2015a, b). These characteristics are consistent with their identification as a population in transition between a deeply buried, luminous AGN and an unobscured quasar phase.
Because this transitional phase is short-lived and therefore rare, identifying a large sample of reddened QSOs requires the large volumes probed by wide-area surveys. X-ray observations are particularly powerful for detecting these AGN, and an excellent resource is the X-ray data set in the SDSS Stripe 82 region (LaMassa et al., 2013, 2015b). The X-ray surveys in Stripe 82 combine archival data with dedicated XMM-Newton pointings, and contain over 6000 sources over an area of more than 31 deg2. The vast majority of these sources have multiwavelength counterparts, and 30% have spectroscopic redshifts. Using this large data set, samples of candidate red QSOs have been identified based on optical, near-IR, and mid-IR properties (e.g., LaMassa et al., 2015a). Near-IR spectroscopic surveys of these targets are currently underway (LaMassa et al. 2016, in prep), and will provide a valuable data set for studying this interesting phase in the evolution of massive galaxies.
5 AGN clustering and dark matter halos
Another valuable technique for studying the evolution of SMBHs is to connect AGN populations to their parent dark matter halos via measurements of spatial clustering (see Cappelluti et al. 2012 for a comprehensive review of X-ray AGN clustering). The growth of DM halos is well understood from simulations and analytic theory (e.g., Sheth et al., 2001; Tinker et al., 2008), so knowledge of how AGN populate DM halos provides a powerful constraint on models of galaxy formation (e.g., Fanidakis et al., 2013). Measurements of the linear clustering amplitude of optical quasars have shown that they are found in halos of constant mass – at all redshifts (e.g., Croom et al., 2005; Myers et al., 2007, Figure 4). Halos of this mass have the highest ratios of stellar mass to dark matter mass (e.g., Moster et al., 2010) and are also the sites of powerful, dust-obscured high-redshift starbursts (submillimeter galaxies; Hickox et al. 2012). This suggests that the maximum BH growth occurs in the same systems in which SF is the most efficient. In contrast, slowly-growing, mechanically-dominated AGN are found in halos of mass (e.g., Hickox et al., 2009; Mendez et al., 2015, Figure 4), for which virial temperatures of the intergalactic gas are higher, star formation rates are lower, and mechanical energy input is required to offset cooling in the centers of the halos that would produce further star formation (e.g., Bower et al., 2006; Croton et al., 2006).
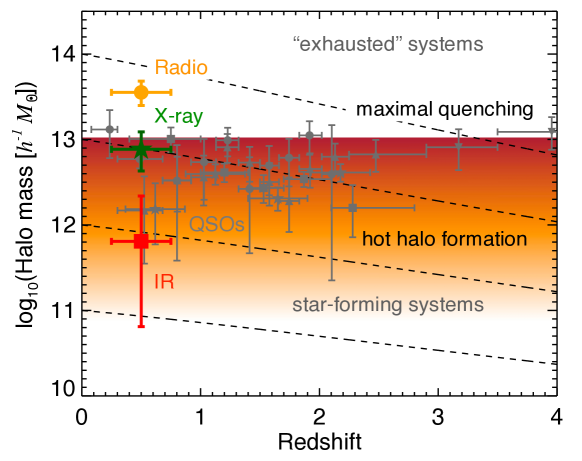
Spatial clustering also provides an independent test of quasar evolutionary models by comparing the halo masses of obscured and unobscured sources. In the simplest ”unified scenario” in which AGN obscuration is due only to orientation (e.g., Netzer, 2015), one would expect no difference in halo mass. However in evolutionary scenarios in which obscured quasars evolve into unobscured sources, the halo masses of the two types of quasars can differ. The clustering of obscured quasars identified with Spitzer and WISE suggests that they reside in higher mass halos than similar unobscured quasars (e.g., Hickox et al., 2011; Donoso et al., 2014; DiPompeo et al., 2014, 2015a). However, measurements of X-ray selected AGN indicate higher clustering for unobscured sources (Allevato et al., 2014), and other studies of lower-luminosity IR-selected AGN show no such dependence (Mendez et al., 2015). A new, independent tool for studying quasar clustering comes from the cross-correlation of quasar positions with lensing maps derived from the cosmic microwave background (e.g., Sherwin et al., 2012; Geach et al., 2013); these analyses appear to confirm higher host halo masses for obscured quasars (DiPompeo et al., 2015b, a). However, these lensing and clustering results still have relatively large uncertainties, motivating higher-precision measurements in the future. The relationship between clustering and obscuration thus remains an interesting open question.
Recent studies have begun to explore not only the mass of the DM halos that host AGN, but how AGN are distributed within those halos. This work uses the halo occupation distribution (HOD) formalism, which has proven successful for studying the clustering of galaxies (e.g., Berlind & Weinberg, 2002; Zehavi et al., 2011). Pioneering studies of the AGN HOD confirm that AGN are found in halos with average masses – , but suggest that the host halos can span a wide range in mass (e.g., Miyaji et al., 2011; Krumpe et al., 2012; Richardson et al., 2013; Shen et al., 2013). HOD analyses of clustering (Starikova et al., 2011; Richardson et al., 2012, 2013; Shen et al., 2013) and direct measurements of AGN occupation in groups (Allevato et al., 2012; Silverman et al., 2014) also indicate that central galaxies are more likely to host an AGN, although some clustering studies are consistent with a large number of satellites (e.g., Miyaji et al., 2011; Krumpe et al., 2015). There are further some hints that the number of AGN in satellites rises slowly or even decreases at large halo mass (e.g., Khabiboulline et al., 2014; Krumpe et al., 2015), in contrast with the behavior of inactive galaxies, which may provide an important clue to the process of AGN fueling. While AGN HOD studies are currently challenging due to small size of AGN samples and thus limited statistical power, they represent the first step in understanding the complete connection between AGN activity and host DM structures, and provide strong motivation for future generations of large extragalactic surveys that can identify and characterize large numbers of AGN.
6 The future of large AGN surveys
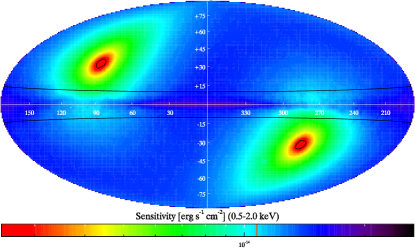
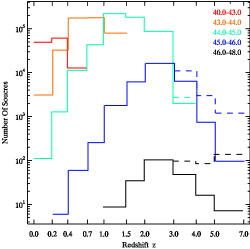
In the coming years, a number of large-scale surveys over a wide area will dramatically expand the samples of AGN. Wide-area X-ray surveys can efficiently and unambiguously identify AGN with limited contamination from host galaxies, and even relatively short exposures with current observatories can produce large AGN samples comprising thousands of sources, as evidenced by the the wide-area Chandra XBoötes (Murray et al., 2005; Kenter et al., 2005), and XMM–XXL (Pierre & XXL Consortium, 2014), and XMM Stripe 82X (LaMassa et al., 2015b) surveys. The next generation wide-area X-ray survey will be the eRosita All Sky Survey (eRASS), to be carried out by the eROSITA instrument on the Spectrum-Roentgen-Gamma spacecraft (Predehl et al. 2007; Merloni et al. 2012; Figure 5). eRASS is expected to detect AGN over 34,000 deg2 with a median redshift and AGN at , increasing the known samples of X-ray AGN by more than an order of magnitude (Kolodzig et al., 2013b). This sample will enable precision studies of the AGN luminosity function and clustering, using photometric redshifts from wide-field imaging surveys and spectroscopic redshifts from the SPIDERS project (part of SDSS-III Eisenstein et al. 2011, covering 50,000 eRASS AGN) and subsequently from the 4 metre Multi-Object Spectroscopic Telescope (4MOST; de Jong et al. 2014, covering 700,000 eRASS AGN). These samples are large enough to enable high-precision (signal-to-noise ratio 10) measurements of AGN clustering amplitude in small bins of redshift or luminosity. With sufficiently large numbers of accurate redshifts, eRASS will also enable the first measurement with X-ray AGN of baryon acoustic oscillations (Kolodzig et al., 2013a; Hütsi et al., 2014).
Beyond eROSITA, SDSS-III, and 4MOST, future wide-field survey instruments include the Athena X-ray mission (Barcons et al., 2015), the Euclid (Laureijs et al., 2012) and WFIRST (Content et al., 2013) optical and near-IR satellite missions, as well as the Subaru Prime Focus Spectrograph, which will carry out a wide, deep near-IR spectroscopic survey of galaxies and will target 50,000 quasars at high redshifts up to Takada et al. 2014. Together, these observatories will dramatically expand the known samples of AGN over a wide range in redshift and luminosity, and will enable statistical studies of AGN, their host galaxies, and their large scale structures that will further enhance our understanding of the growth of supermassive black holes over cosmic time.
Acknowledgements.
R.C.H. acknowledges support from an Alfred P. Sloan Research Fellowship, a Dartmouth Class of 1962 Faculty Fellowship, the National Science Foundation via grant numbers 1211096 and 1515364, and NASA through ADAP award NNX12AE38G. We are grateful to the organizers for an enjoyable and stimulating Focus Meeting and the IAU for organizing an excellent General Assembly.References
- Aird et al. (2012) Aird, J., et al. 2012, ApJ, 746, 90
- Alexander & Hickox (2012) Alexander, D. M. & Hickox, R. C. 2012, New A Rev., 56, 93
- Allevato et al. (2014) Allevato, V., et al. 2014, ApJ, 796, 4
- Allevato et al. (2012) Allevato, V., et al. 2012, ApJ, 758, 47
- Assef et al. (2015) Assef, R. J., et al. 2015, ApJ, 804, 27
- Assef et al. (2013) Assef, R. J., et al. 2013, ApJ, 772, 26
- Bahcall et al. (1997) Bahcall, J. N., et al. 1997, ApJ, 479, 642
- Banerji et al. (2015) Banerji, M., et al. 2015, MNRAS, 447, 3368
- Banerji et al. (2012) Banerji, M., et al. 2012, MNRAS, 427, 2275
- Banerji et al. (2013) Banerji, M., et al. 2013, MNRAS, 429, L55
- Barcons et al. (2015) Barcons, X., et al. 2015, Journal of Physics Conference Series, 610, 012008
- Berlind & Weinberg (2002) Berlind, A. A. & Weinberg, D. H. 2002, ApJ, 575, 587
- Blanton (2006) Blanton, M. R. 2006, ApJ, 648, 268
- Booth & Schaye (2011) Booth, C. M. & Schaye, J. 2011, MNRAS, 413, 1158
- Bower et al. (2006) Bower, R. G., et al. 2006, MNRAS, 370, 645
- Brusa et al. (2015a) Brusa, M., et al. 2015a, MNRAS, 446, 2394
- Brusa et al. (2010) Brusa, M., et al. 2010, ApJ, 716, 348
- Brusa et al. (2005) Brusa, M., et al. 2005, A&A, 432, 69
- Brusa et al. (2015b) Brusa, M., et al. 2015b, A&A, 578, A11
- Cappelluti et al. (2012) Cappelluti, N., Allevato, V., & Finoguenov, A. 2012, Advances in Astronomy, 2012
- Cardamone et al. (2010) Cardamone, C. N., et al. 2010, ApJ, 721, L38
- Chen et al. (2013) Chen, C.-T. J., et al. 2013, ApJ, 773, 3
- Chen et al. (2015) Chen, C.-T. J., et al. 2015, ApJ, 802, 50
- Cisternas et al. (2011) Cisternas, M., et al. 2011, ApJ, 726, 57
- Coil et al. (2006) Coil, A. L., et al. 2006, ApJ, 644, 671
- Content et al. (2013) Content, D., et al. 2013, in SPIE Conference Series, Vol. 8860
- Croom et al. (2005) Croom, S. M., et al. 2005, MNRAS, 356, 415
- Croton et al. (2006) Croton, D. J., et al. 2006, MNRAS, 365, 11
- de Jong et al. (2014) de Jong, R. S., et al. 2014, in SPIE Conference Series, Vol. 9147
- Di Matteo et al. (2005) Di Matteo, T., Springel, V., & Hernquist, L. 2005, Nature, 433, 604
- Diamond-Stanic et al. (2012) Diamond-Stanic, A. M., et al. 2012, ApJ, 755, L26
- DiPompeo et al. (2015a) DiPompeo, M. A., et al. 2015a, MNRAS
- DiPompeo et al. (2014) DiPompeo, M. A., et al. 2014, MNRAS, 442, 3443
- DiPompeo et al. (2015b) DiPompeo, M. A., et al. 2015b, MNRAS, 446, 3492
- Donoso et al. (2014) Donoso, E., et al. 2014, ApJ, 789, 44
- Eisenstein et al. (2011) Eisenstein, D. J., et al. 2011, AJ, 142, 72
- Ellison et al. (2015) Ellison, S. L., Patton, D. R., & Hickox, R. C. 2015, MNRAS, 451, L35
- Ellison et al. (2008) Ellison, S. L., et al. 2008, AJ, 135, 1877
- Fabian (2012) Fabian, A. C. 2012, ARA&A, 50, 455
- Fanidakis et al. (2013) Fanidakis, N., et al. 2013, MNRAS, 435, 679
- Feruglio et al. (2015) Feruglio, C., et al. 2015, A&A, 583, A99
- Gabor & Bournaud (2013) Gabor, J. M. & Bournaud, F. 2013, MNRAS, 434, 606
- Gabor & Bournaud (2014) —. 2014, MNRAS, 441, 1615
- Gabor et al. (2009) Gabor, J. M., et al. 2009, ApJ, 691, 705
- Geach et al. (2013) Geach, J. E., et al. 2013, ApJ, 776, L41
- Geach et al. (2014) Geach, J. E., et al. 2014, Nature, 516, 68
- Glikman et al. (2007) Glikman, E., et al. 2007, ApJ, 667, 673
- Glikman et al. (2015) Glikman, E., et al. 2015, ApJ, 806, 218
- Glikman et al. (2012) Glikman, E., et al. 2012, ApJ, 757, 51
- Glikman et al. (2013) Glikman, E., et al. 2013, ApJ, 778, 127
- Goulding et al. (2014) Goulding, A. D., et al. 2014, ApJ, 783, 40
- Grogin et al. (2005) Grogin, N. A., et al. 2005, ApJ, 627, L97
- Hainline et al. (2013) Hainline, K. N., et al. 2013, ApJ, 774, 145
- Hainline et al. (2014) Hainline, K. N., et al. 2014, ApJ, 787, 65
- Harrison et al. (2014) Harrison, C. M., et al. 2014, MNRAS, 441, 3306
- Harrison et al. (2013) Harrison, F. A., et al. 2013, ApJ, 770, 103
- Hickox et al. (2007) Hickox, R. C., et al. 2007, ApJ, 671, 1365
- Hickox et al. (2009) Hickox, R. C., et al. 2009, ApJ, 696, 891
- Hickox et al. (2014) Hickox, R. C., et al. 2014, ApJ, 782, 9
- Hickox et al. (2011) Hickox, R. C., et al. 2011, ApJ, 731, 117
- Hickox et al. (2012) Hickox, R. C., et al. 2012, MNRAS, 421, 284
- Hopkins et al. (2008) Hopkins, P. F., et al. 2008, ApJS, 175, 356
- Hütsi et al. (2014) Hütsi, G., et al. 2014, A&A, 572, A28
- Jansen et al. (2001) Jansen, F., et al. 2001, A&A, 365, L1
- Kampczyk et al. (2013) Kampczyk, P., et al. 2013, ApJ, 762, 43
- Kartaltepe et al. (2012) Kartaltepe, J. S., et al. 2012, ApJ, 757, 23
- Keel et al. (2015) Keel, W. C., et al. 2015, AJ, 149, 155
- Kenter et al. (2005) Kenter, A., et al. 2005, ApJS, 161, 9
- Khabiboulline et al. (2014) Khabiboulline, E. T., et al. 2014, ApJ, 795, 62
- Kocevski et al. (2012) Kocevski, D. D., et al. 2012, ApJ, 744, 148
- Kolodzig et al. (2013a) Kolodzig, A., et al. 2013a, A&A, 558, A90
- Kolodzig et al. (2013b) Kolodzig, A., et al. 2013b, A&A, 558, A89
- Kormendy & Ho (2013) Kormendy, J. & Ho, L. C. 2013, ARA&A, 51, 511
- Koss et al. (2010) Koss, M., et al. 2010, ApJ, 716, L125
- Krumpe et al. (2012) Krumpe, M., et al. 2012, ApJ, 746, 1
- Krumpe et al. (2015) Krumpe, M., et al. 2015, ApJ, 815, 21
- Lackner et al. (2014) Lackner, C. N., et al. 2014, AJ, 148, 137
- LaMassa et al. (2015a) LaMassa, S. M., et al. 2015a, ApJ submitted (arXiv:1511.02883)
- LaMassa et al. (2015b) LaMassa, S. M., et al. 2015b, ApJ submitted (arXiv:1510.00852)
- LaMassa et al. (2013) LaMassa, S. M., et al. 2013, MNRAS, 436, 3581
- Lansbury et al. (2014) Lansbury, G. B., et al. 2014, ApJ, 785, 17
- Lansbury et al. (2015) Lansbury, G. B., et al. 2015, ApJ, 809, 115
- Laureijs et al. (2012) Laureijs, R., et al. 2012, in SPIE Conference Series, Vol. 8442
- McConnell & Ma (2013) McConnell, N. J. & Ma, C.-P. 2013, ApJ, 764, 184
- Mechtley et al. (2015) Mechtley, M., et al. 2015, ArXiv e-prints
- Mendez et al. (2015) Mendez, A. J., et al. 2015, ApJ submitted (arXiv:1504.06284)
- Merloni & Heinz (2013) Merloni, A. & Heinz, et al. 2013, Evolution of Active Galactic Nuclei, ed. T. D. Oswalt & W. C. Keel, 503
- Merloni et al. (2012) Merloni, A., et al. 2012, eROSITA Science Book: Mapping the Structure of the Energetic Universe (arXiv:1209.3114)
- Miyaji et al. (2011) Miyaji, T., et al. 2011, ApJ, 726, 83
- Moster et al. (2010) Moster, B. P., et al. 2010, ApJ, 710, 903
- Mullaney et al. (2011a) Mullaney, J. R., et al. 2011a, MNRAS, 414, 1082
- Mullaney et al. (2012) Mullaney, J. R., et al. 2012, ApJ, 753, L30
- Mullaney et al. (2011b) Mullaney, J. R., et al. 2011b, MNRAS, 1756
- Murray et al. (2005) Murray, S. S., et al. 2005, ApJS, 161, 1
- Myers et al. (2007) Myers, A. D., et al. 2007, ApJ, 658, 85
- Nandra et al. (2007) Nandra, K., et al. 2007, ApJ, 660, L11
- Nayakshin (2013) Nayakshin, S. 2013, MNRAS
- Netzer (2015) Netzer, H. 2015, ARA&A, 53, 365
- Novak et al. (2011) Novak, G. S., Ostriker, J. P., & Ciotti, L. 2011, ApJ, 737, 26
- Perna et al. (2015a) Perna, M., et al. 2015a, A&A, 574, A82
- Perna et al. (2015b) Perna, M., et al. 2015b, A&A, 583, A72
- Pierre & XXL Consortium (2014) Pierre, M. & XXL Consortium. 2014, in The X-ray Universe 2014, 17
- Pilbratt et al. (2010) Pilbratt, G. L., et al. 2010, A&A, 518, L1
- Predehl et al. (2007) Predehl, P., et al. 2007, in Proceedings of the SPIE, Volume 6686, pp. 668617-9
- Richardson et al. (2013) Richardson, J., et al. 2013, ApJ, 774, 143
- Richardson et al. (2012) Richardson, J., et al. 2012, ApJ, 755, 30
- Rosario et al. (2012) Rosario, D. J., et al. 2012, A&A, 545, A45
- Sanders et al. (1988) Sanders, D. B., et al. 1988, ApJ, 325, 74
- Satyapal et al. (2014) Satyapal, S., et al. 2014, MNRAS, 441, 1297
- Schawinski et al. (2010a) Schawinski, K., et al. 2010a, ApJ, 724, L30
- Schawinski et al. (2010b) Schawinski, K., et al. 2010b, ApJ, 711, 284
- Schawinski et al. (2009) Schawinski, K., et al. 2009, ApJ, 692, L19
- Shao et al. (2010) Shao, L., et al. 2010, A&A, 518, L26+
- Shen et al. (2013) Shen, Y., et al. 2013, ApJ, 778, 98
- Sherwin et al. (2012) Sherwin, B. D., et al. 2012, Phys. Rev. D, 86, 083006
- Sheth et al. (2001) Sheth, R. K., Mo, H. J., & Tormen, G. 2001, MNRAS, 323, 1
- Silverman et al. (2011) Silverman, J. D., et al. 2011, ApJ, 743, 2
- Silverman et al. (2014) Silverman, J. D., et al. 2014, ApJ, 780, 67
- Smolčić (2009) Smolčić, V. 2009, ApJ, 699, L43
- Stanley et al. (2015) Stanley, F., et al. 2015, MNRAS, 453, 591
- Starikova et al. (2011) Starikova, S., et al. 2011, ApJ, 741, 15
- Stern et al. (2012) Stern, D., et al. 2012, ApJ, 753, 30
- Stern et al. (2014) Stern, D., et al. 2014, ApJ, 794, 102
- Strateva et al. (2001) Strateva, I., et al. 2001, AJ, 122, 1861
- Takada et al. (2014) Takada, M., et al. 2014, PASJ, 66, 1
- Tananbaum et al. (2014) Tananbaum, H., et al. 2014, Reports on Progress in Physics, 77, 066902
- Thacker et al. (2014) Thacker, R. J., et al. 2014, MNRAS, 443, 1125
- Tinker et al. (2008) Tinker, J., et al. 2008, ApJ, 688, 709
- Treister et al. (2012) Treister, E., et al. 2012, ApJ, 758, L39
- Trump et al. (2015) Trump, J. R., et al. 2015, ApJ, 811, 26
- Urrutia et al. (2008) Urrutia, T., Lacy, M., & Becker, R. H. 2008, ApJ, 674, 80
- Volonteri et al. (2015) Volonteri, M., et al. 2015, MNRAS, 452, L6
- Werner et al. (2004) Werner, M. W., et al. 2004, ApJS, 154, 1
- Woods et al. (2010) Woods, D. F., et al. 2010, AJ, 139, 1857
- Wright et al. (2010) Wright, E. L., et al. 2010, AJ, 140, 1868
- Xue et al. (2010) Xue, Y. Q., et al. 2010, ApJ, 720, 368
- Zehavi et al. (2011) Zehavi, I., et al. 2011, ApJ, 736, 59
- Zehavi et al. (2005) Zehavi, I., et al. 2005, ApJ, 630, 1
- Zubovas et al. (2013) Zubovas, K., et al. 2013, MNRAS, 433, 3079