Observations of Ly and O VI: Signatures of Cooling and Star Formation in a Massive Central Cluster Galaxy
Abstract
We report new HST COS and STIS spectroscopy of a star-forming region ( yr-1) in the center of the X-ray cluster RXJ1532.9+3021 (), to follow-up the CLASH team discovery of luminous UV filaments and knots in the central massive galaxy. We detect broad ( km s-1) Ly emission lines with extraordinarily high equivalent width (EQWÅ) and somewhat less broadened H ( km s-1). Emission lines of N V and O VI are not detected, which constrains the rate at which gas cools through temperatures of K to be M⊙ yr-1. The COS spectra also show a flat rest-frame UV continuum with weak stellar photospheric features, consistent with the presence of recently-formed hot stars forming at a rate of M⊙ yr-1, uncorrected for dust extinction. The slope and absorption lines in these UV spectra are similar to those of Lyman Break Galaxies at , albeit those with the highest Ly equivalent widths and star-formation rates. This high-EQW Ly source is a high-metallicity galaxy rapidly forming stars in structures that look nothing like disks. This mode of star formation could significantly contribute to the spheroidal population of galaxies. The constraint on the luminosity of any O VI line emission is stringent enough to rule out steady and simultaneous gas cooling and star formation, unlike similar systems in the Phoenix Cluster and Abell 1795. The fact that the current star formation rate differs from the local mass cooling rate is consistent with recent simulations of episodic AGN feedback and star formation in a cluster atmosphere.
Subject headings:
galaxies: clusters: intracluster medium, galaxies:ultraviolet1. Introduction
A Brightest Cluster Galaxy (BCG) is typically extremely massive ( M⊙) with a stellar population dominated by old red stars, and lives in a cluster of galaxies permeated with hot ( K), X-ray emitting intergalactic gas. Given their red-and-dead reputations, it might be rather surprising to learn that such galaxies can have powerful emission-line regions and radio sources (Hu et al., 1985; Crawford et al., 1999; Heckman, 1981), cold dusty molecular gas (Donahue et al., 2000; Edge, 2001), and UV emission from recent star formation (). Nature provides a strong clue as to why some of these galaxies are active and some are not: these phenomena, associated with active galactic nuclei (AGN) or star formation activity, only occur in clusters of galaxies in which the hot, X-ray emitting gas within about 100 kpc of the center of the cluster has a cooling time short compared to Gyr, or equivalently, a central gas entropy of keV cm2 (Heckman et al., 1989; Cavagnolo et al., 2008; Rafferty et al., 2008a; Cavagnolo et al., 2009; Sun, 2009). There is mounting evidence that the condensation of hot gas fuels AGN and star-formation activity, a cycle maintained by the considerable influence of the AGN on the intracluster medium (ICM).
Recent rest-frame UV images obtained with the Hubble Space Telescope (HST) (Donahue et al., 2015; Tremblay et al., 2015) show that the ultraviolet emission in these active BCGs has a lumpy and occasionally filamentary morphology, usually extending to around 10 kpc, but occasionally up to 100 kpc away from the center of the BCG. The emission-line morphologies of these galaxies in H, visible for nearby () BCGs in ground-based images, is similar (Hu et al., 1985).
The exact nature of these phenomena remains unclear. At least some of the gas is being photoionized by recent star formation, which has been detected using diagnostics from the far-infrared through the UV. However, the full range of emission-line ratios and linewidths cannot be easily explained by simple stellar photoionization (Voit & Donahue, 1997). Astronomers have speculated about shocks in the molecular gas and particle heating associated with either the X-ray gas or relativistic particles associated with the radio sources (e.g., Fabian et al., 2011). We and others have posited that the AGN lifts low-entropy but hot cluster gas out of the center of the galaxy, which then cools and rains back down towards center (Voit et al., 2015; Brighenti et al., 2015; McNamara et al., 2016).
UV spectroscopy of moderately redshifted () sources affords the possibility of detecting 100,000 K gas in UV emission lines such as O VI 1032Å,1038Å, and C IV 1548Å,1551Å simultaneously with Ly. Large-aperture () spectroscopy from the International Ultraviolet Explorer showed strong Ly in a dozen low-redshift () BCGs (Hu, 1992). Later, Far Ultraviolet Spectroscopic Explorer (FUSE) observations by Oegerle et al. (2001) and Bregman et al. (2006) detected O VI in A2597 and A1795 respectively. The FUSE apertures in these studies would have included any contributions from an AGN, so the O VI may be associated with AGN. A very limited set of HST Cosmic Origins Spectrograph (COS) observations of non-AGN clumps in other galaxies have yielded detections of C IV and He II in M87 (Sparks et al., 2009, 2012) and of O VI in a filament in Abell 1795 (McDonald et al., 2014). O VI was detected from the center of the Phoenix cluster (McDonald et al., 2015). In the M87 clump, no UV continuum sources were detected. M87 is close enough that individual O-stars would have been detected if they were present (Sparks et al., 2009). In A1795, the O VI luminositiy corresponds to a mass of gas cooling radiatively at a rate times faster than the corresponding star-formation rate implied by the UV continuum. In the Phoenix cluster BCG, McDonald et al. (2015) report that while some of the emission could come from shocks, gas could be cooling at rates of over from a region where the star formation rate is M⊙ yr-1.
To make simultaneous measurements of O VI and C IV in a similar BCG with optical emission-line filaments and a relatively high rate of star formation, we chose the BCG in the cluster RXJ1532.9+3021 at a redshift of , which shifted the wavelengths of both of these emission lines to a range that could be observed by COS. We obtained COS FUV and NUV spectrosocpy, along with high-resolution UV imaging and long-slit spectroscopy with the Space Telescope Imaging Spectrograph (STIS). We present these spectroscopic observations targeting the central region of the BCG. We also present a brief STIS long-slit observation centered on the same region, covering the wavelength of H at this redshift.
Throughout the paper, we assume cosmological parameters of , , and km s-1 Mpc-1. At a redshift of 0.362, the scale is 5.0 kpc arcsec-1 and the luminosity distance is 1920 Mpc (Wright, 2006).
2. The cluster RXCJ1532.9+3021
The central galaxy (RA(J2000), Dec(J2000) = 15:32:53.78, +30:20:59.4) of the X-ray cluster RXCJ1532.9+3021 was first noted as a radio source (MGJ153246+3021) in the MIT-Green Bank II 5 GHz survey (Langston et al., 1990). A significantly more accurate radio location and flux density were measured by Becker et al. (1995). The radio-loud active galaxy was associated with a ROSAT X-ray source by Laurent-Muehleisen et al. (1997). The cluster itself was identified as a ROSAT X-ray source by Ebeling et al. (1998) in the ROSAT Brightest Cluster Sample, and its spectroscopic redshift was first published by Crawford et al. (1999). It was the target of Chandra observations (Hlavacek-Larrondo et al., 2012, 2013).
The cluster was chosen to be a part of the Cluster Lensing And Supernovae survey with HST (CLASH) Multi-Cycle Treasury project as one of the 20 X-ray selected clusters. The CLASH project (Postman et al., 2012) collected HST Wide Field Camera 3 (WFC3) and Advanced Camera for Surveys (ACS) images in 16 bandpasses from the UV to the NIR for a sample of 25 massive clusters of galaxies with redshifts from 0.2-0.9. (The additional 5 clusters were included because they are strong gravitational lenses of the high redshift univervse.) The broad wavelength coverage insured sufficiently accurate photometric redshift estimates for lensed galaxies. As a result, the clusters themselves were imaged at UV wavelengths, observations usually denied to targets presumed to be red and dead. All of the CLASH BCGs were detected in the UV, some of them with UV colors indicating high star formation rates. The UV analysis and images of the CLASH BCGs were published by Donahue et al. (2015).
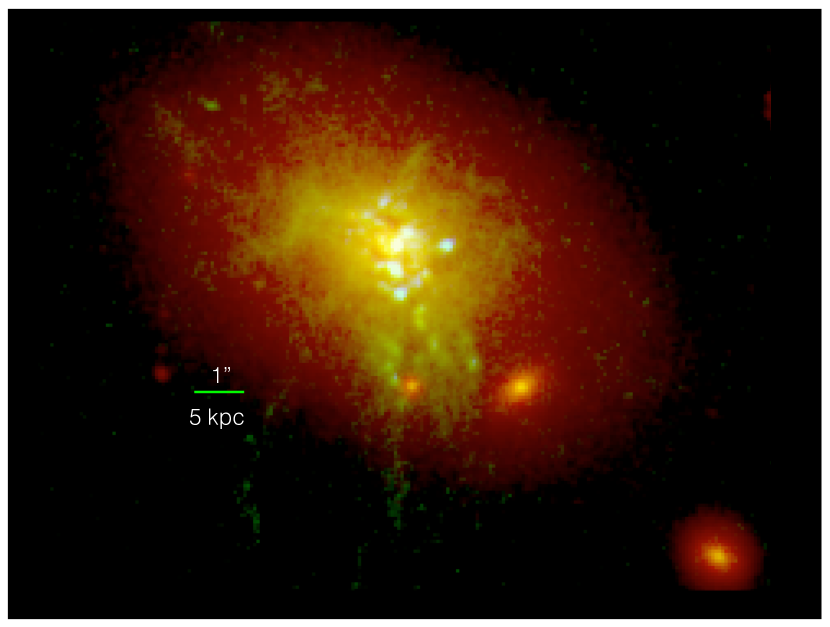
The BCG in RXJ1532.9+3021 (Shown in Figure 1) bears a strong resemblance to other BCGs in strong cool cores with high star formation rates such as that in the Phoenix Cluster (McDonald et al., 2012) or extended, filamentary optical nebular emission such as in NGC1275 (Lynds, 1970). It is located in the center of a luminous X-ray cluster with a highly peaked X-ray profile and relatively low central gas entropy. It has a significant amount of molecular gas. Hoffer et al. (2012) reports a detection with Spitzer FIR corresponding to a SFR similar to that of a vigorous starburst ( solar masses per year), with an unobscured UV SFR that is nearly as high (Donahue et al., 2015). A detailed analysis of 2-d CLASH imaging and ground-based spectroscopy from Fogarty et al. (2015) estimates a total star formation rate of . The H filaments extend beyond 50 kpc from the center of the BCG, and the UV appearance shows both knots and filaments. It has been postulated that the star formation in these systems is fueled by gas condensing out of the ICM and is regulated by the kinetic energy deposited by jets from the radio AGN (e.g., McNamara & Nulsen, 2007). However, local measurements of both cooling and star formation in BCGs have been rare.
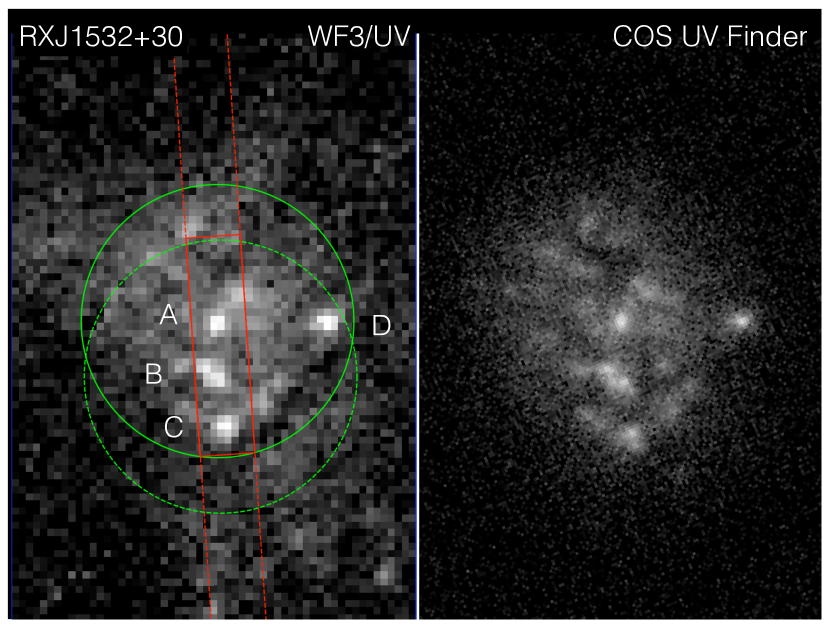
The CLASH UV images of the BCG in RXCJ1532.9+3021 showed distinct knots of emission. These knots are bright enough to be acquired and studied with COS, which is optimized for the study of point-source spectra. Figure 2 identifies each of these knots and the actual locations of the COS and STIS apertures. The HST proposal ID was 13367. The complete program included two STIS visits and three COS visits. The dates, exposure times, observation strategies, and data reductions for each HST instrument are described in each sub-section of §3. We conclude that section with a presentation of the extraordinarily high-resolution COS rest-frame UV acquisition images and a comparison to the CLASH photometry. For the central region of this BCG, we measure the rest-frame UV luminosity, Ly emission, Ly absorption, together with strong upper limits to O VI and weaker limits on C IV owing to its location on the vignetted end of the COS NUV spectral coverage. We estimate the unattenuated and total star formation rates based on the UV continuum measurements and extinction estimates and H emission line luminosities from STIS and the Sloan Digital Sky Survey (SDSS). We also estimate the rate at gas is cooling through a temperature of K from our limits on O VI and conclude that the rate at which gas is cooling in the central region is less than the star formation rate in the same region. We discuss these results in §LABEL:DISCUSSION, and summarize the paper in §LABEL:CONCLUSIONS.
3. Data Acquisition and Analysis
In this section, we describe the observations, the preparation of the science products, and the spectroscopic measurements. To allow readers to skip the technical details, we have separated the measurements and the data preparation into separate but sequential subsections.
3.1. STIS 2D Spectroscopy Observations and Data Reduction
In order to obtain an H to Ly ratio, we used STIS CCD/long slit observations. We observed the central region through the slit. The G750M grating was set to a central wavelength of 8825 Å. The first CCD STIS observation (ocap01), taken 18 March 2014, failed to acquire the target. The exposure time for the acquisition was too short, since, as a mildly resolved object, the target is extended. The initial HST pointing was quite accurate, but the acquisition routine moved the peak of the emission well off the STIS slit. The second observation (ocap05), taken a little over one year later on 23 March 2015 successfully acquired the target. Two image sets were combined. The total exposure was 2,054 seconds. The position angle of the aperture was -176.22 degrees east of north (as shown in Figure 2). A fringe frame was obtained and used in calibration. The standard cosmic-ray rejection in the pipeline did a poor job of identifying and removing cosmic rays, which seriously affect STIS observations. Adjusting the rejection parameters to make multiple passes through the data with the STSDAS task stis.ocrreject only made marginal improvements in cosmic-ray rejection. Therefore, to clean the image, we used pixel replacement with the median of a box of pixels. This procedure left behind a clearly detected but extended H emission line and a very weakly detected [N II] emission line (Compare the two sides of Figure 3).
For flux calibration, the median-filtered data were processed through the remaining the pipeline steps for flux and dispersion calibration, using CALSTIS code version 2.40 (23-May-2012) and IRAF/Ureka version 1.4.4.3. The data were corrected for a (small) heliocentric radial velocity (-12.5 km s-1).
3.2. STIS 2D Spectroscopy Meausurements
The peak intensity of the extended H emission was erg s-1 cm-2 arcsec-2. The central wavelength of the emission line is consistent with H at redshift . The line emission is velocity-broadened (500-600 km s-1 FWHM). It is clearly spatially resolved along the slit, but distinguishing individual clumps was not possible. There is weak suggestion of a blue-side asymmetry in the emission line, which would suggest possible outflow if it were real.
We employed two methods to measure the width and extent of the H from the STIS data. Our first method used IRAF/splot to sum the spectra 40 pixels (2.0) along the slit, similar to the box height in the right hand side of Figure 3, and fit a single Gaussian line to the main emission line. This procedure yielded an estimated flux of erg s-1 cm-2, with a linewidth of 15-19 Angstroms FWHM. In our second method, we wrote an IDL program, utilizing the mpfit2dfun.pro code of Craig Markwardt111http://cow.physics.wisc.edu/~craigm/idl/idl.html to fit 2-D Gaussians to a subset of the 2-D flux-calibrated data centered around the redshifted H +[N II] complex. We fit the source in the spectral direction with a redshifted H +[N II] complex modeled by 3 Gaussian lines. We required the best-fit redshift and the Gaussian widths of the individual lines to be identical and the flux of [N II]6548 line to be 1/3 that of [N II]6583. We used vacuum rest-wavelengths for H (6564.614 Å) and [N II] (6585.27Å and 6549.86Å respectively.) We found that we recovered similar results whether median-filtering was included in the models or not. To confirm the uncertainties for our measurements, we generated 1000 random datasets from the original pipeline data together with the variance maps, median-filtered those images, and fit the random datasets in the same way as the original data. The best-fit H flux was erg s-1 cm-2, with a Gaussian width (sigma) of , corresponding to kpc at . The linewidth FWHM is Å( km s-1, or km s-1). These values are similar to what we obtained from the simple splot estimates. The best-fit [N II] flux is consistent with a flux of 1/3 H. The implied H luminosity inside a kpc2 projected region is erg s-1, which makes this BCG one of the most luminous BCGs in H . This luminosity corresponds to a star formation rate of 20 M⊙ yr-1 inside this limited region, using the conversion in (Kennicutt, 1998).
The extent and the separations between Knots A and B in the CLASH data indicate that emission from Knots A and B are blended together in the STIS data. There is a hint of a shoulder of a source approximately 20% fainter than the bulk of the emission along the slit axis. But the 2-D data are adequately fit by a single extended source, which includes both Knots A and B in its extent, so we conclude that Knots A and B are indistinct in H emission.
3.3. Sloan Digital Sky Survey Spectrum Comparison to STIS
A Sloan Digital Sky Survey (SDSS) fiber spectrum, taken in 2003, is available for the larger region in the RXJ1532.9+3021 BCG, in SDSS-Data Release 13 (SDSS-DR 13; SDSS Collaboration et al. (2016)). (For reference, the ID is SDSS J153253.78+302059.4.) The H flux in the fiber is , and the [N II]6584/H ratio is (Thomas et al., 2013). Therefore, our extraction from the full STIS long-slit spectrum represents about 1/4 of the optical emission-line light detected by SDSS within of the center of the galaxy. (We note the SDSS fiber flux is uncertain since a previous extraction, using the MPA-JHU pipeline, used in DR8 (Aihara et al., 2011), estimates a flux in the H line for this target that is about two times lower than that cited above. The [N II]/H ratios are consistent, however.) Both SDSS analyses found linewidths via joint fits of many emission lines of km s-1, while the linewidth for H from the knots is km s-1 (corresponding to a FWHM of km s-1.) The higher [N II]/H ratio in the fiber spectrum suggests that the extended light may have a higher [N II]/H ratio () than the knots. In summary, the SDDSS analysis of the existing fiber () spectrum for RXJ1532.9+3021 and our analyses of the central spectrum from STIS find similar redshift and line widths, but the SDSS spectrum shows somewhat larger [N II]/H ratios ().
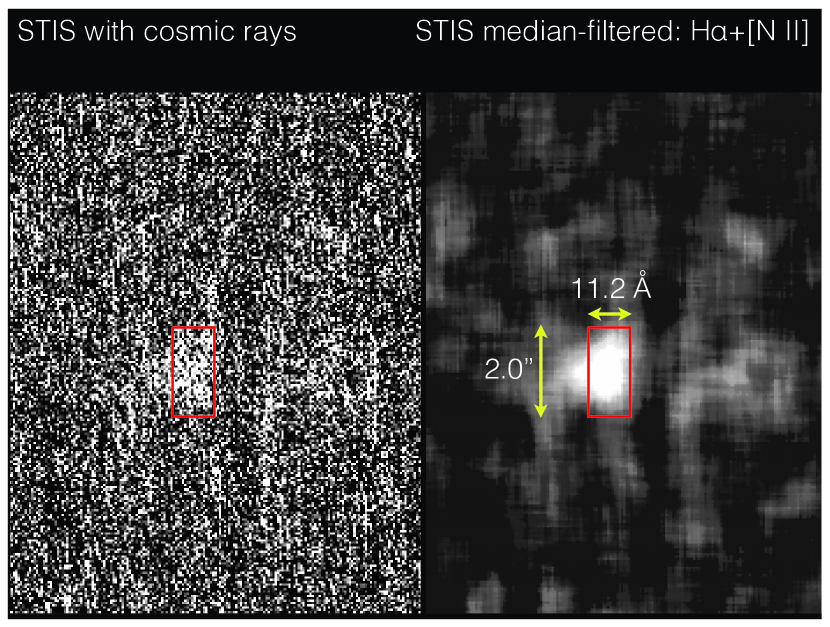
are identified on both images, corresponding to an approximate central wavelength of Angstroms and a width of 20 pixels () and a height of 40 STIS CCD pixels ().
3.4. COS Spectroscopic Observations and Data Reduction
To assess the presence and fluxes of FUV and NUV emission lines from ionized and hot gas in the BCG of RXJ1532.9+3021, we targeted Knot A (Figure 2) with the HST COS spectrograph. The acquisition and observation of a compact but extended source with a faint UV continuum and prominent emission lines is difficult with COS. The COS spectrograph has a diameter aperture, but it is optimized for a compact source located in the center of the aperture. Prior to proposing for COS observations, we had acquired HST UV images from ACS with very precise knot locations (Donahue et al. 2015). But the pointing of HST is limited by the accuracy of whatever guide stars happen to be used for a given observation and roll angle.
The first two acquisitions, in June of 2014, successfully centered on Knot A. We chose conservative exposure times of 800-1000 seconds for the acquisitions and a slight offset to the north and east of Knot A to ensure that the usual peak identification would choose Knot A over the other, less UV-bright knots. However, in December of 2014, the roll-angle was reversed, and the acquisition routine, although identical to the previous acquisitions (1000 s, same offset strategy), chose Knot B over Knot A. The same dominant Guide Star was used for all 3 acquisitions, but the December observation used a different Guide Star to control for its roll angle. We verified this difference by inspecting the header of the .jif files. We report results for all spectra. Because knots A and B are separated by only , all COS spectra for this program include UV flux from both knots A and B and the surrounding region based on comparisons of the detected flux to CCD photometry from the ACS. The transmission through the COS aperture drops with offset from the center, but the transmission is higher than 90% for the central , and is still above 80% for the central . We show in § 3.6 by comparison to WFC3 UV photometry that the fluxes in the COS spectra are consistent with coming from the central diameter region in the core of the galaxy and are not dominated by flux from any individual knot, at least in the NUV where a direct comparison can be made.
A standard spectral extraction for the COS data was sufficient for the scientific needs of the project. An optimized FUV extraction using the IDL COS coaddition routine from the University of Colorado222https://cos.colorado.edu/COS_idt.html resulted in a very similar spectrum. The calibration of COS spectra is accurate to , with relative flux accuracies of about (COS Data Handbook Cycle 24.)
3.5. COS Spectroscopic Measurements
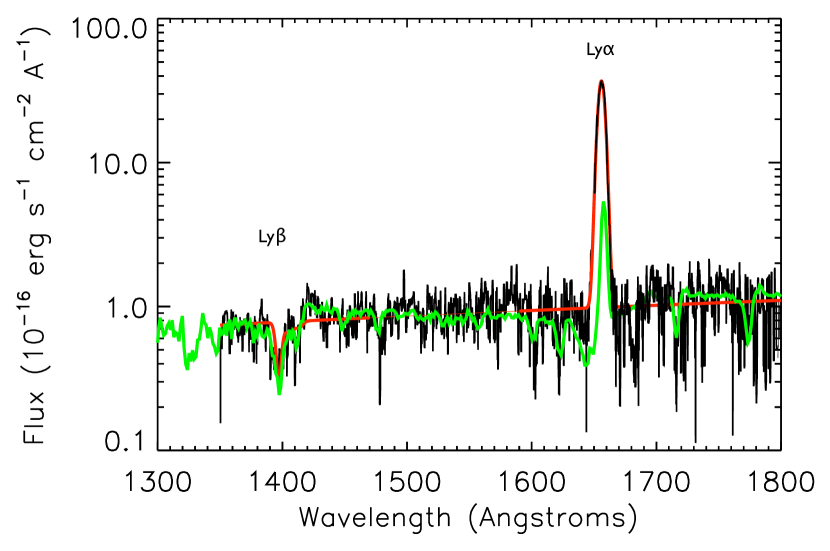
All of the COS observations detected faint UV continuum. The flux at observed 1500Å is erg s-1 cm-2 s-1. This UV rate corresponds to a SFR of 3-10 solar masses per year, uncorrected for dust (the range presented here emerges from a range assumptions of the initial mass function of stars and the timescales, see Calzetti 2013.) Only the FUV observation revealed any line emission, and only Ly was detected. Neither O VI or C IV were detected in emission (although the redshift of C IV line put it very close to the edge of the vignetted, noisier limit of the NUV wavelength coverage.)
Ly was detected at a redshift of (central observed wavelength of with a flux of erg s-1 cm-2, corresponding to an rest-frame equivalent width of 210Å (Figure 4). The line is broadened, Å observed wavelength, corresponding to km s-1 . Ly was detected in absorption at a nearly level. When constrained to have the same redshift and line width as Ly , the amplitude of the absorption line was erg s-1 cm-2 Å-1. This amplitude corresponds to an equivalent width of . The corresponding column density of neutral hydrogen is cm-2, or 120 solar masses of neutral hydrogen per square kpc.
The ratio of Ly from the COS observation to H measured with STIS is , significantly less than what one would expect from recombination without correcting for intrinsic extinction. However, the extinction inferred from this ratio is moderate, corresponding to an for a wide range of expectations for the intrinsic Ly H ratio.333Assuming here. The intrinsic ratio of Ly to H of 8.3 predicted from Case B recombination implies the least extinction; alternative intrinsic ratios of up to 25 yield the upper limit to extinction estimates. This extinction is consistent with the total reddening to the source estimated from the SDSS spectrum ( mag) and is somewhat lower than that obtained through the analysis of CLASH photometry of a much larger region by Fogarty et al. (2015) (, depending on exact assumptions). The Galactic contribution to extinction towards this high Galactic latitude source is , based on maps and computations in Schlafly & Finkbeiner (2011), so all of these estimates demonstrate that a significant fraction of the total extinction in these spectra is intrinsic to the BCG.
The Ly line (1215.67Å) is well-fit by a simple Gaussian profile, and so there is no statistically significant evidence for asymmetry (). The line width implies a broader velocity profile than that represented by the optical lines measured with STIS and SDSS. It is possible that extended emission in the aperture broadens the effective line. However, the most likely explanation of the broader line width is that the width of the Ly line is enhanced by scattering from fast-moving neutral H atoms. Scattering affects Ly much more than H. The nominal H best-fit redshift, from the STIS observations (), is marginally closer to that of the stars as measured from the SDSS spectrum (), than that of the Ly line (). The difference in mean redshift and the larger difference in linewidths may arise if the Ly light is scattered by a medium that is transparent to H photons.
The O VI emission line doublet (vacuum rest wavelengths 1031.97Å, 1037.63Å) was not detected in the COS/FUV spectrum, and the quality of the data allowed us to place a stringent upper limit on it. The three-sigma upper limits for O VI1033/Ly correspond to a limit on gas cooling and condensation from a hot phase of solar masses per year (Voit et al., 1994).
There is a depression with a marginal statistical significance () near C IV (1548.20Å,1550.77Å) on the short wavelength edge of the NUV spectrum of the region. If the continuum from the region is primarily from recently-formed hot stars, some absorption is expected, although probably not at the level that could be detected in our observations. A upper limit to emission at redshifted C IV is erg s-1 cm-2, over 20 times fainter than the erg s-1 cm-2 that would be expected if Knot B had line ratios relative to H similar to the off-nuclear emission-line knot studied in M87 (Sparks et al., 2012).
N V (1238.8Å, 1242.8Å) was not detected, with a 3-sigma limit of erg s-1 cm-2. Since the ratio of O VI/N V is about 10 in condensing gas, our N V limit on condensing gas is 10 times weaker than our limit from O VI. The lack of N V, O VI, and C IV in emission is also consistent with the lack of an optically luminous AGN.
3.6. WFC3 and COS Finder Photometry
The broadband UV photometry we present here shows that the continuum levels in the COS aperture exceed the light emitted by the individual knots. We also discuss here the source structures revealed by the co-addition of the individual COS acquisition images. The COS acquisition camera has the best sampling of the HST UV PSF, so its broad-band UV imaging represent some of the highest resolution UV images ever taken. (However, its photometric usefulness is limited, for reasons we also discuss.).
We identified four knots in CLASH WFC3/UVIS images (Figure 2). We label them Knots A, B, and C starting from the center of the BCG and moving south; Knot D is located to the west. All 16 CLASH images are measured using the IRAF task aphot. Additionally, we measured the fluxes for two large apertures that included all four knots, centered on Knots A and B. The coordinates of the four knots, as well as the center of the larger regions, the radii of the apertures used for photometry, and the sizes of the background annuli used for local background subtraction are given in Table 3.6.
To measure the photometry of each knot, we used IRAF/apphot. The flux inside an aperture was found via
| (1) |
where is the total counts measured inside of the aperture, is the area of that aperture in pixels, is the measured background in counts per pixel, and is the exposure time. For a background region of pixels, the error in the flux measurement in units of net counts per second is:
| (2) |
where is the measured variance in units of counts2 per area inside the background region. We corrected the measured fluxes and error in the fluxes for Galactic extinction, and converted our measurements to AB magnitudes. We report our measured photometry for each filter and knot combination, as well as the corresponding filter zeropoint, linear flux correction applied for Galactic extinction, and exposure time for each filter, in Table 2.
A & 15:32:53.772 +30:20:59.43 0.3
B 15:32:53.775 +30:20:58.94 0.3
C 15:32:53.765 +30:20:58.49 0.3
D 15:32:53.695 +30:20:59.40 0.3
All-A 15:32:53.772 +30:20:59.43 1.0
All-B 15:32:53.775 +30:20:58.94 1.0
| Filter | Knot A | Knot B | Knot C | Knot D | Large A | Large B | Zeropoint | ||
|---|---|---|---|---|---|---|---|---|---|
| (mag) | (mag) | (mag) | (mag) | (mag) | (mag) | (mag) | (s) | ||
| F225W | 24.097 | 1.225 | 7262.00 | ||||||
| F275W | 24.174 | 1.182 | 7428.00 | ||||||
| F336W | 24.645 | 1.148 | 4764.00 | ||||||
| F390W | 25.371 | 1.131 | 4840.00 | ||||||
| F435W | 25.666 | 1.118 | 4100.00 | ||||||
| F475W | 26.059 | 1.107 | 4128.00 | ||||||
| F606W | 26.491 | 1.083 | 4060.00 | ||||||
| F625W | 25.907 | 1.075 | 4128.00 | ||||||
| F775W | 25.665 | 1.056 | 4090.00 | ||||||
| F814W | 25.943 | 1.051 | 8036.00 | ||||||
| F850LP | 24.842 | 1.041 | 8134.00 | ||||||
| F105W | 26.269 | 1.028 | 2814.67 | ||||||
| F110W | 26.825 | 1.024 | 2514.67 | ||||||
| F125W | 26.247 | 1.021 | 2514.67 | ||||||
| F140W | 26.452 | 1.017 | 2311.74 | ||||||
| F160W | 25.956 | 1.013 | 5029.34 |
Note. — Total AB magnitudes based on HST imaging inside apertures defined in Table 3.6. A constant global background was subtracted, but local BCG light is included. The corresponding zeropoint assumed for each filter, linear flux correction for Galactic attenuation (, as defined in Equation 1), and total exposure time () are reported for completeness.
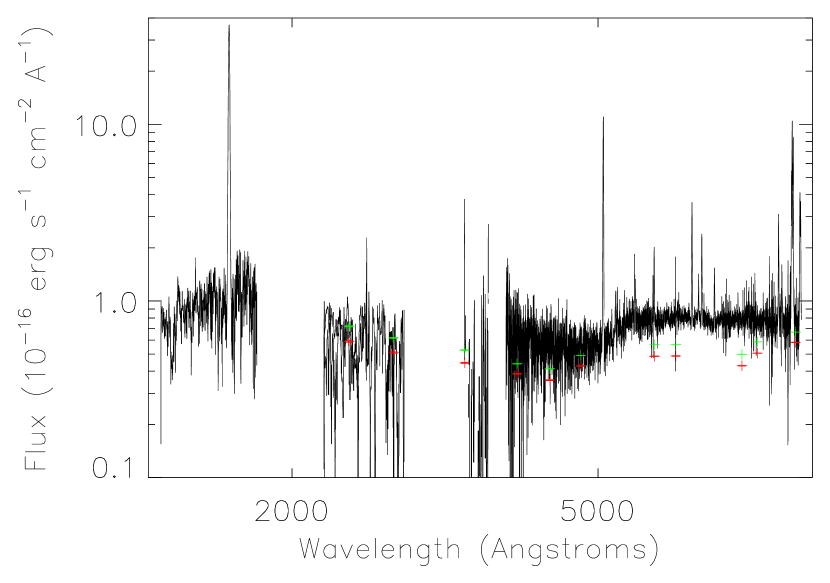
Note that small-aperture photometry of the individual knots yields NUV magnitudes 2 magnitudes fainter than that measured for the large aperture, so most of the light in the large aperture is coming from extended light, not any individual knot. The 16-band CLASH photometry for the two large apertures, centered on Knot A or Knot B, differs only at the 10% level. This similarity shows that the small offset in aiming the final COS NUV observation makes very little difference. The net flux from the large-A aperture was converted from AB magnitudes to Fλ units using the reported pivot wavelengths for each HST filter, and is plotted in Figure 5 as individual points. This figure also includes the COS FUV and NUV spectra and the SDSS fiber spectrum, which represents a diameter aperture, somewhat larger than the aperture used for the HST photometry or spectra. The correspondence with the HST broadband photometry for a similar region is quite good.
While investigating the cause of the aperture position difference between the June and December observations, we discovered that the raw fluxes based on photometry for the COS acquisition images varied from one observation to the next. This variability led us to suspect intrinsic source variability (which would have been quite interesting if true), but subsequent investigation showed that vignetting by the COS acquisition camera is more likely to be the dominant culprit for the flux variations in the acquisition image. The vignetting correction is significant and too crude for our photometry on the finder image to improve over the WFC photometry. But because of the vignetting uncertainty and the guide star difference we discussed earlier in this section, the last COS NUV observation was centered on a position slightly offset () from the other COS pointings. The offset did not affect the fluxes in COS noticeably, because both clumps A and B are included in the high-throughput center of the COS aperture and in the resulting spectra for both pointings. So while the COS aperture shifted slightly in location () from the FUV to the last NUV observation, we can treat it as an observation of nearly the same region because the same light sources are included in the COS aperture,
Despite the photometric issues with the COS acquisition camera, its sampling of the HST Point Spread Function is exquisite, at per pixel. We aligned and summed three acquisition images and show the result on the right-hand side of Figure 2, for comparison with the CLASH F275W image. Knot D is unresolved, with a FWHM of . Knot A is resolved, a single clump of about (3.5 kpc) FWHM. Knot B, however, is clearly resolved into a complex blend of sources, elongated approximately (2.5 kpc) from the NE to the SW. Knot C remains compact with irregular structure at the edge of the acquisition field. The diffuse UV emission is lumpy, with some evidence of tails or filaments. Dark regions, which appear as dark grey or black in Figure 2 in both the COS acquisition image and the UV/CLASH data, lie just north of Knot A and to the SW of Knot B may correspond to dust features.
4. Discussion
The UV spectra of the central region of RXJ1532.9+3021 are consistent with a continuous star formation rate of about 3-10 solar masses per year within a region with a diameter of kpc, uncorrected for intrinsic attenuation. Correcting for extinction implied by an (consistent with the SDSS spectrum and with the Spectral Energy Distribution (SED) analysis by Fogarty et al. (2015) and comparison to the rates inferred from H detected from a smaller region by our STIS observations and from a somewhat larger region by SDSS would lead to star formation rates of up to 40-80 solar masses per year from the central 10 kpc. Individual UV star-forming knots are easily resolved by the COS acquisition image to be or about kpc across. Emission from at least the brightest two most central knots and extended emission contribute to the COS spectra. The estimated star formation rate from the central 10 kpc is consistent with broadband CLASH photometry estimates of 100-150 solar masses per year over a larger, kpc2 sky area (Fogarty et al., 2015). The star formation is concentrated in, but not limited to, the central 10 kpc.
The spectra from this region are similar to rest-frame UV spectra of Lyman Break Galaxies. We note that the rest-frame Ly EQW seen here () would be among the highest Ly EQWs seen in the spectra of Lyman Break Galaxies (Shapley et al., 2003). A couple of distinct stellar photospheric features from hot main-sequence stars are also visible in the UV continuum, C III 1174 Å in particular. Ly is detected in absorption with a similar linewidth and redshift as the Ly emission line. These hydrogen lines are consistent with a wind km s-1, very similar to winds seen around distant starburst galaxies (e.g., Grimes et al., 2009; Heckman et al., 2011).
High Ly EQW is often associated with star-forming galaxies with systemically lower metallicities (Finkelstein et al., 2011). This Ly system and other such systems residing in relatively high-metallicity BCGs might be counter-examples to this pattern. This galaxy is also clearly not forming stars in a disk, given the morphology of the UV filaments and knots.
We know that the presence of cold gas (as well as star formation and powerful radio sources) in BCGs is strongly correlated with the thermodynamic state of the hot gas in the cluster core (e.g., Cavagnolo et al., 2008; Rafferty et al., 2008b). Some of the star-forming gas may therefore originate from low-entropy ICM gas dredged up from very center of the cluster, which then precipitates, cools, and forms stars. The current specific star formation for these systems is quite low since the stellar masses are already quite large; in fact, these galaxies have the most mass in stars or matter over any other galaxies in the universe. However, stars produced by this mode of star formation – which does not require a gas-rich merger or secular disk instabilities – interestingly, would join the spheroidal stellar population of a galaxy. Therefore, BCGs such as this one are providing a relatively nearby example of spheroidal star formation possibly being regulated by AGN feedback.
Cold gas may also be stripped from donor galaxies, but we regard this possibility as unlikely. Studies of BCGs with similar H emission-line properties and star formation rates of order 100 M⊙ yr-1 also have considerable amounts of molecular hydrogen, 10 billion M⊙ or more (e.g., Edge, 2001; Voit & Donahue, 2011), an amount also consistent with the masses in other galaxies with similar star formation rates (Voit & Donahue, 2011). This amount exceeds the amount of molecular gas in the Milky Way (from Heyer & Dame 2015) by an order of magnitude. Given the lack of a massive donor suspect near the BCG and the similarity of this BCG compared to other BCG galaxies with direct molecular gas detections, we are dubious that the cold gas fueling the star formation rates could have been stripped from a donor.
Our limit on O VI emission constrains the amount of cooling gas concurrently fueling star formation in this system. Detections of O VI from knots in other similar systems such as the Phoenix Cluster at (McDonald et al., 2015) and Abell 1795 at (McDonald et al., 2014) have shown the radiative cooling rates based on O VI emission-line detections can exceed the local star formation rate. In those works it was suggested that the star formation is therefore inefficient. In an off-center knot in M87, the detection of 100,000K gas via C IV emission lines, along with the lack of recent star formation, led to the conclusion that conduction may be an important process in sustaining an intermediate-temperature interface between the X-ray gas and the cooler gas, since neither recently-formed stars nor AGN were present (Sparks et al., 2009, 2012).
But the observations we report here of a very similar system have rather different implications. We see strong signatures of star formation and relatively little evidence for 100,000 K gas. Hotter K gas is certainly present, along with significant cavities lying a little farther from the center, outside the emission line filaments, as indicated by Chandra X-ray observations (Hlavacek-Larrondo et al., 2013). This brighest cluster galaxy and its molecular, ionized, and X-ray gas content and distributions are basically identical to other brightest cluster galaxies with radio sources, excess UV and FIR light, and extended, filamenatary optical emission line gas. Consequently, we conclude that RXJ1532.9+3021 is in a different phase of an episodic feedback process.
In recent simulations of idealized AGN feedback by Li et al. (2015), the rate of gas cooling in the simulation does indeed drop below the star formation rate in the latter part of the bursts. It is too soon to conclude that we are witnessing the closing phase of an episode of AGN outburst and the star formation associated with that event, but it is interesting to think about how to use an ensemble of similar measurements for other clusters to test such simulations, as well as how to use simulations to interpret individual galaxy measurements.
We suggest that the most plausible interpretation is that the star formation rate in a given BCG region does not track the current radiative cooling rate in lockstep, even in a system in which the ICM fuels the star formation. This interpretation is not completely speculative, since simulations of AGN feedback triggered by condensation suggest that the condensation events are episodic (Gaspari et al., 2012; Prasad et al., 2015; Li et al., 2015; Meece et al., 2016; Yang & Reynolds, 2016). Such an interpretation would suggest that RXJ1532.9+3021 is perhaps a system at the end of a major outburst, while other O VI-detections may be revealing systems in the earlier phases. The details from any given simulation undoubtedly depend on exactly how the simulators implement star formation, AGN feedback, and cooling in their codes, but one would expect scatter in the ratios of O VI to SFRs for systems where the source of kinetic energy varies in power and direction. Simulators do not yet have statistical predictions for time-averaged scatter in those observables since simulations with resolution sufficient to follow the cold gas are typically of only single systems. Future UV observations of emission-line regions in BCGs would provide very useful constraints for probing the timescales of AGN activity, star formation, and mass condensation. Ideally, these observations should include regions without optical AGN, since disentangling the effects of an optically-visible AGN from that of cooling gas would be challenging.
5. Conclusions
The COS FUV spectrum of the core of the central galaxy in RXJ1532.9+3021 shows a strong Ly line (rest EQW Å), stellar UV continuum, and no other emission lines (such as O VI, N V, or C IV). The stellar continuum of the FUV spectrum shows Ly absorption (with a cm-2), likely due to stellar winds, and stellar absorption features characteristic of the photospheres of hot stars. The Ly emission line is likely to have additional broadening because it is being scattered by hydrogen atoms in a wind. A comparison of the FUV spectrum with a composite spectrum of Lyman break galaxies corroborates the identification of these features with recently formed stars. We present a long-slit STIS spectrum showing H and relatively weakly-detected [N II], which is also consistent with gas photoionized by hot stars. The width of the H feature is km s-1, less broad than the Ly feature ( km s-1) seen from a similar region of the galaxy. The most likely explanation is that the Ly photons are far more strongly scattered by the winds in the region. The ratio of H to Ly is consistent with a moderate level of dust extinction. The EQW of Ly is extraordinary, especially since this BCG is neither low-metallicity nor high-redshift.
All of these properties are consistent with active star formation. The inferred UV star formation rate, uncorrected for any obscuration, is solar masses per year in the central kiloparsec, while the rate much less affected by extinction from H is 20-80 solar masses per year, depending on the aperture. The overall rate for the entire galaxy, as estimated from previous Spitzer MIR photometry, is solar masses per year, a value consistent with that inferred from an analysis of the 16 bandpass CLASH photometry SED (Fogarty et al., 2015).
Our analysis of the COS spectra places a stringent upper limit on the amount of concurrently cooling gas in the system, based on the absence of O VI emission lines (and to some degree, the absence of a C IV emission line). In the RXJ1532.9+3021 system, the gas mass cooling rate inferred from O VI upper limits is significantly less than the star formation rate (extinction-corrected UV, H , FIR, and SED). This result was unexpected, since previous rest-UV spectrocopic observations of similar emission-line BCGs in X-ray cool core clusters displayed much more luminous O VI and C IV emission lines than expected if the gas cooling rates were equal to the star formation rates. Our interpretation is that this BCG is indeed a similar system to the Phoenix Cluster, M87, or Abell 1795, with similar mechanisms regulating AGN feedback, radiative cooling, and star formation, but in a phase in which the star formation rate exceeds the gas cooling rate. All of those systems are forming stars without the assistance of a gas-rich merger or the presence of a detectable gaseous disk. Such systems may be examples of how some stars can enter a galaxy’s spheroidal population without ever belonging to a disk. Similar UV spectroscopic observations of a larger sample of emission-line BCGs may reveal an ensemble of states, in which accretion (or radiative cooling) does not precisely track the star formation rates. The proportions of galaxies in each state for a well-chosen sample will give us better observational constraints on the timescales of feedback, cooling, and heating in these systems, which in turn will lead to better understanding of the mechanisms underlying AGN feedback.
References
- Aihara et al. (2011) Aihara, H., Allende Prieto, C., An, D., et al. 2011, ApJS, 193, 29
- Becker et al. (1995) Becker, R. H., White, R. L., & Helfand, D. J. 1995, ApJ, 450, 559
- Bregman et al. (2006) Bregman, J. N., Fabian, A. C., Miller, E. D., & Irwin, J. A. 2006, ApJ, 642, 746
- Brighenti et al. (2015) Brighenti, F., Mathews, W. G., & Temi, P. 2015, ApJ, 802, 118
- Calzetti (2013) Calzetti, D. 2013, Star Formation Rate Indicators, ed. J. Falcón-Barroso & J. H. Knapen (Cambridge, UK: Cambridge University Press), 419
- Cavagnolo et al. (2008) Cavagnolo, K. W., Donahue, M., Voit, G. M., & Sun, M. 2008, ApJ, 683, L107
- Cavagnolo et al. (2009) —. 2009, ApJS, 182, 12
- Crawford et al. (1999) Crawford, C. S., Allen, S. W., Ebeling, H., Edge, A. C., & Fabian, A. C. 1999, MNRAS, 306, 857
- Donahue et al. (2000) Donahue, M., Mack, J., Voit, G. M., et al. 2000, ApJ, 545, 670
- Donahue et al. (2015) Donahue, M., Connor, T., Fogarty, K., et al. 2015, ApJ, 805, 177
- Ebeling et al. (1998) Ebeling, H., Edge, A. C., Bohringer, H., et al. 1998, MNRAS, 301, 881
- Edge (2001) Edge, A. C. 2001, MNRAS, 328, 762
- Fabian et al. (2011) Fabian, A. C., Sanders, J. S., Williams, R. J. R., et al. 2011, MNRAS, 417, 172
- Finkelstein et al. (2011) Finkelstein, S. L., Cohen, S. H., Moustakas, J., et al. 2011, ApJ, 733, 117
- Fogarty et al. (2015) Fogarty, K., Postman, M., Connor, T., Donahue, M., & Moustakas, J. 2015, ApJ, 813, 117
- Gaspari et al. (2012) Gaspari, M., Ruszkowski, M., & Sharma, P. 2012, ApJ, 746, 94
- Grimes et al. (2009) Grimes, J. P., Heckman, T., Aloisi, A., et al. 2009, ApJS, 181, 272
- Heckman (1981) Heckman, T. M. 1981, ApJ, 250, L59
- Heckman et al. (1989) Heckman, T. M., Baum, S. A., van Breugel, W. J. M., & McCarthy, P. 1989, ApJ, 338, 48
- Heckman et al. (2011) Heckman, T. M., Borthakur, S., Overzier, R., et al. 2011, ApJ, 730, 5
- Heyer & Dame (2015) Heyer, M., & Dame, T. M. 2015, ARA&A, 53, 583
- Hlavacek-Larrondo et al. (2012) Hlavacek-Larrondo, J., Fabian, A. C., Edge, A. C., et al. 2012, MNRAS, 421, 1360
- Hlavacek-Larrondo et al. (2013) Hlavacek-Larrondo, J., Allen, S. W., Taylor, G. B., et al. 2013, ApJ, 777, 163
- Hoffer et al. (2012) Hoffer, A. S., Donahue, M., Hicks, A., & Barthelemy, R. S. 2012, ApJS, 199, 23
- Hu (1992) Hu, E. M. 1992, ApJ, 391, 608
- Hu et al. (1985) Hu, E. M., Cowie, L. L., & Wang, Z. 1985, ApJS, 59, 447
- Kennicutt (1998) Kennicutt, Jr., R. C. 1998, ARA&A, 36, 189
- Langston et al. (1990) Langston, G. I., Heflin, M. B., Conner, S. R., et al. 1990, ApJS, 72, 621
- Laurent-Muehleisen et al. (1997) Laurent-Muehleisen, S. A., Kollgaard, R. I., Ryan, P. J., et al. 1997, A&AS, 122, 235
- Li et al. (2015) Li, Y., Bryan, G. L., Ruszkowski, M., et al. 2015, ApJ, 811, 73
- Lynds (1970) Lynds, R. 1970, ApJ, 159
- McDonald et al. (2014) McDonald, M., Roediger, J., Veilleux, S., & Ehlert, S. 2014, ApJ, 791, L30
- McDonald et al. (2012) McDonald, M., Bayliss, M., Benson, B. A., et al. 2012, Nature, 488, 349
- McDonald et al. (2015) McDonald, M., McNamara, B. R., van Weeren, R. J., et al. 2015, ApJ, 811, 111
- McNamara & Nulsen (2007) McNamara, B. R., & Nulsen, P. E. J. 2007, ARA&A, 45, 117
- McNamara et al. (2016) McNamara, B. R., Russell, H. R., Nulsen, P. E. J., et al. 2016, ApJ, 830, 79
- Meece et al. (2016) Meece, G. R., Voit, G. M., & O’Shea, B. W. 2016, ArXiv e-prints, arXiv:1603.03674
- Oegerle et al. (2001) Oegerle, W. R., Cowie, L., Davidsen, A., et al. 2001, ApJ, 560, 187
- Postman et al. (2012) Postman, M., Coe, D., Benítez, N., et al. 2012, ApJS, 199, 25
- Prasad et al. (2015) Prasad, D., Sharma, P., & Babul, A. 2015, ApJ, 811, 108
- Rafferty et al. (2008a) Rafferty, D. A., McNamara, B. R., & Nulsen, P. E. J. 2008a, ApJ, 687, 899
- Rafferty et al. (2008b) —. 2008b, ApJ, 687, 899
- Schlafly & Finkbeiner (2011) Schlafly, E. F., & Finkbeiner, D. P. 2011, ApJ, 737, 103
- SDSS Collaboration et al. (2016) SDSS Collaboration, Albareti, F. D., Allende Prieto, C., et al. 2016, ArXiv e-prints, arXiv:1608.02013
- Shapley et al. (2003) Shapley, A. E., Steidel, C. C., Pettini, M., & Adelberger, K. L. 2003, ApJ, 588, 65
- Sparks et al. (2009) Sparks, W. B., Pringle, J. E., Donahue, M., et al. 2009, ApJ, 704, L20
- Sparks et al. (2012) Sparks, W. B., Pringle, J. E., Carswell, R. F., et al. 2012, ApJ, 750, L5
- Sun (2009) Sun, M. 2009, ApJ, 704, 1586
- Thomas et al. (2013) Thomas, D., Steele, O., Maraston, C., et al. 2013, MNRAS, 431, 1383
- Tremblay et al. (2015) Tremblay, G. R., O’Dea, C. P., Baum, S. A., et al. 2015, MNRAS, 451, 3768
- Voit & Donahue (1997) Voit, G. M., & Donahue, M. 1997, ApJ, 486, 242
- Voit & Donahue (2011) —. 2011, ApJ, 738, L24
- Voit et al. (2015) Voit, G. M., Donahue, M., Bryan, G. L., & McDonald, M. 2015, Nature, 519, 203
- Voit et al. (1994) Voit, G. M., Donahue, M., & Slavin, J. D. 1994, ApJS, 95, 87
- Wright (2006) Wright, E. L. 2006, PASP, 118, 1711
- Yang & Reynolds (2016) Yang, H.-Y. K., & Reynolds, C. S. 2016, ApJ, 829, 90