Frequency and amplitude dependent population dynamics during cycles of feast and famine
Abstract
In nature microbial populations are subject to fluctuating nutrient levels. Nutrient fluctuations are important for evolutionary and ecological dynamics in microbial communities since they impact growth rates, population sizes and biofilm formation. Here we use automated continuous-culture devices and high-throughput imaging to show that when populations of Escherichia coli are subjected to cycles of nutrient excess (feasts) and scarcity (famine) their abundance dynamics during famines depend on the frequency and amplitude of feasts. We show that frequency and amplitude dependent dynamics in planktonic populations arise from nutrient and history dependent rates of aggregation and dispersal. A phenomenological model recapitulates our experimental observations. Our results show that the statistical properties of environmental fluctuations have substantial impacts on spatial structure in bacterial populations driving large changes in abundance dynamics.
pacs:
87.23.Cc, 87.10.Vg, 87.18.-h, 87.18.Vf, 87.18.Fx, 87.18.EdIn nature, microbial populations are subjected to temporally and spatially variable environments. In ecosystems including oceans, lakes, and soils, limiting nutrients are present as patches or particles Simon et al. (2002); Datta et al. (2016) and at low concentrations Kellerman et al. (2014). As a result, nutrient conditions are believed to be dynamic with microbes experiencing periods of nutrient excess and starvation on multiple timescales Seymour et al. (2017); Savageau (1983).
In many contexts bacterial populations also transition between free-floating aggregates Schleheck et al. (2009) or surface-attached biofilms McDougald et al. (2011) and dispersed planktonic populations Laganenka et al. (2016). Nutrient conditions affect the development of this spatial structure. For example, increases in nutrient availability drive biofilm dispersal in some species Sauer et al. (2004); Schleheck et al. (2009), and bacterial populations resident in biofilms enter stationary phase Ito et al. (2008) while becoming more resistant to antibiotics Ito et al. (2009). However, our understanding of how the statistics of environmental fluctuations interact with the formation and dispersal of spatial structure in microbial populations is limited.
In this Letter we present quantitative measurements of the population dynamics of Escherichia coli cycling between conditions of nutrient excess (feasts) and starvation (famine). We vary the frequency and amplitude of nutrient fluctuations and observe a strong dependence of the abundance dynamics on both variables. We find that nutrient fluctuations with higher frequency and amplitude drive faster abundance dynamics in planktonic populations. Further, populations subjected to nutrient fluctuations on timescales shorter than days exhibit memory on a timescale that exceeds a generation time. Our data, in combination with a simple model of community dynamics, show that these phenomena arise from a history and substrate dependence in the dispersal of aggregated or adherent bacterial populations. Finally, we document a concomitant frequency and amplitude dependence in the lag-phase duration of bacterial populations.
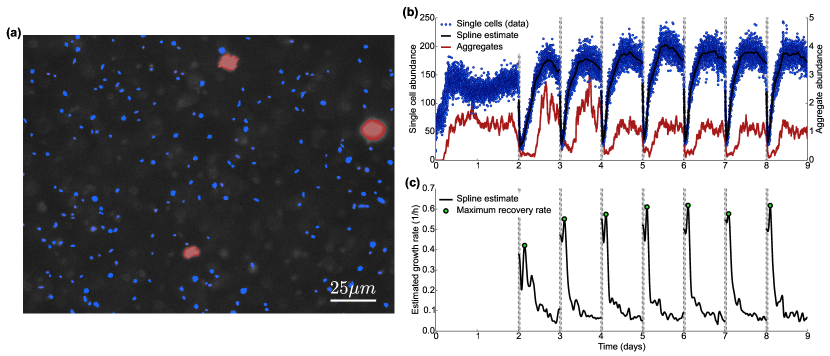
We use custom continuous-culture devices coupled to epi-fluorescence microscopes which image fluorescently labeled E. coli at the single-cell level [Fig. 1(a)]. Our continuous-culture devices permit long-term automated imaging to measure population dynamics on timescales of minutes for periods of weeks Merritt and Kuehn (2016). We maintain a culture of bacteria in chemostat conditions while a pump draws samples from the culture once per minute and passes them through a micron-scale glass capillary where imaging occurs. We use a strain of E. coli expressing dTomato constitutively from the chromosome. Populations are grown in M minimal medium at with low levels of carbon ( w/v, mM glucose). Prior to an experiment, populations are initiated from single colonies and grown in a batch culture and then transferred to the continuous-culture devices operating at a basal dilution rate of (doubling time ) for hours to acclimate to the conditions of slow but continuous growth. We operate six chemostats in parallel.
Following the acclimation period, the continuous-culture devices alternate between long, fixed periods of chemostat operation at the basal dilution rate (famine) and short “washout events” where - of the population is replaced with fresh medium over the course of one to two hours (feasts) [Fig. 1(b)]. Washout events simultaneously reduce the population by a factor of , depending on the amplitude, and increase the substrate (glucose) concentration from a few micromolar Wick et al. (2002) to approximately mM, resulting in periods of rapid growth as the population recovers to its steady state abundance [Fig. 1(b)].
During cycles of feast and famine we perform automated imaging once per minute on samples drawn from the growing bacterial population. During periods of famine we observe both planktonic (single-cell) populations and aggregated cells [Fig. 1]. From the size of the aggregates (Supplemental Material Fig. S11 111See Supplemental Material in ancillary files, which includes Refs. Merritt and Kuehn (2016); Levin-Reisman et al. (2010); Scott et al. (2010); Senn et al. (1994); Ito et al. (2008), for details on experimental protocol, model parameters, image segmentation, growth rate, cell size, and cell aggregation.) we estimate that, at steady state, the numbers of planktonic and aggregated cells are of the same order ( mL-1). During washout events the planktonic population declines by - to -fold and the number of aggregates falls to nearly undetectable levels. Subsequently, with the chemostat operating at the basal dilution rate, the planktonic population rapidly returns to its steady state value. During this recovery we measure the instantaneous growth rate of the planktonic population. We find this time dependent growth rate exhibits a peak early in the recovery [Fig. 1(c)]. We report this maximum recovery growth rate [green points in Fig. 1(c)]. The population of aggregates remains low ( per image) until the planktonic population growth rate declines below and then begins to recover Merritt and Kuehn (2016).
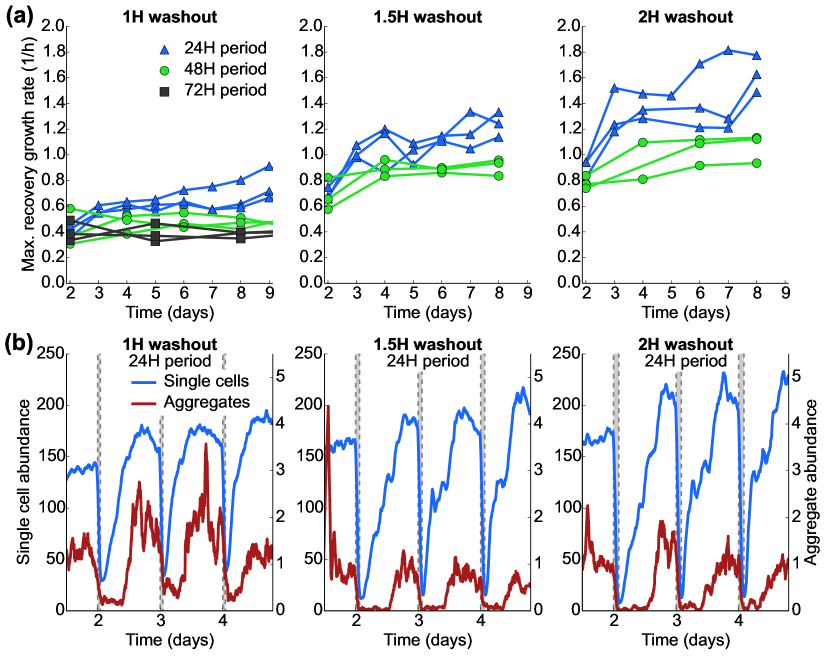
To study the frequency dependence of the observed abundance dynamics we performed hour washout events which reduced the population by -fold with periods ranging from every to every from the start of one washout event to the next. We find that the rate of recovery of the planktonic population following a washout event increases the more frequently washout events occur [Fig. 2(a)]. The change in recovery rate occurs rapidly (by the second washout event), so we conclude that the change in population dynamics is the result of phenotypic processes rather than genetic mutations sweeping through the population Merritt and Kuehn (2016).
We next performed a series of experiments where the amplitude of the washout event was varied. Washout events of larger amplitude occur over a longer period of time, resulting in a larger fraction of the population being washed out and a modestly higher final substrate concentration (mM rather than mM). We performed washout events with durations of and and periods of and . We find that larger amplitude washout events result in substantially faster growth during the recovery [Fig. 2(a)], with maximum recovery rates as high as . This rate exceeds previously measured biomass growth rates for E. coli in glucose minimal media by at least a factor of four Scott et al. (2010), suggesting that our measured planktonic population growth rate cannot be the result of cell division alone. Both the frequency and amplitude dependent dynamics observed via imaging were corroborated by concurrent optical density measurements Note (1). Fig. 2(a) is the central finding of this Letter.
One possible explanation for slow growth rates in low frequency perturbation conditions is the presence of phenotypic heterogeneity in the population such as dormant or persistent cells increasing their relative abundance with increasing famine duration Patra and Klumpp (2013). To test this hypothesis we sampled chemostat populations every hours over a hour period of famine and used a previously developed assay to detect persistent cells by measuring the time for colonies to appear on agar plates Levin-Reisman et al. (2010). We found no evidence of persisters in our experiment at relative abundances greater than approximately regardless of the famine duration. Instead, the time for colonies to form on agar plates was approximately normally distributed regardless of when we sampled the population from the chemostat. However, we did observe a monotonic dependence of the average time to colony formation (lag time) with the duration of the famine, as well as a decrease in the time to colony formation with increasing washout amplitude (Supplemental Material Figs. S2 and S7 Note (1)). These results show that the average time for cells to resume growth after a famine decreases with both the frequency and amplitude of environmental perturbations.
We next considered the role cell aggregation plays in the dynamics shown in Fig. 2. We performed an experiment where the basal dilution rate between washout events was set to zero. In this condition populations do not continually grow between washout events but enter stationary phase as they would in batch culture. Previous measurements showed that in batch culture lag phase duration also increases with starvation duration Levin-Reisman et al. (2010). However, the maximum rate of recovery from washout events for planktonic populations in this condition is uniformly slow (maximum recovery rates ), with no frequency or amplitude dependence (Supplemental Material Fig. S15 Note (1)). Critically, we observe little or no aggregation in batch culture conditions, with the entire population being planktonic Note (1); Merritt and Kuehn (2016). This result strongly suggests that the presence of aggregated cells is necessary for the high maximum recovery rates shown in Fig. 2. Under this premise, fast recovery rates exhibited by planktonic populations would be driven by the dispersal of aggregated or potentially adherent cells in the community.
In light of these results, we sought a model to describe the frequency and amplitude dependent abundance dynamics we observe in bacterial populations growing in fluctuating nutrient conditions which captured the formation and dispersal of aggregated populations. Our model considers populations of planktonic cells and cells in free floating aggregates or adhered to the vessel . We assume planktonic cells grow at a rate determined by the instantaneous substrate concentration . Aggregates have a characteristic size of approximately cells which we determined from imaging Note (1). Given the large difference in apparent growth rates for planktonic populations between hour and hour washout events we reasoned that the dispersal rate of should increase with higher levels of available substrate , an assumption which is supported by the literature Sauer et al. (2004) and our observation that the size of aggregates decreases after washout events (Supplemental Material Fig. S12 Note (1)). To capture the history dependent recovery rates we assume that the rate of dispersal also depends on the duration of the famine, with longer famines resulting in lower dispersal rates, possibly due to maturation Reisner et al. (2003). Finally, we assume that the population consumes no substrate since bacteria in biofilms have been shown to be in stationary phase Ito et al. (2008). From these assumptions we construct the following dynamical model:
| (1) |
| (2) |
| (3) |
Here , is the dilution rate of the chemostat, and is the rate of formation from planktonic cells, modulated by substrate levels via . is the rate of dispersal and is modulated by substrate levels and , a variable that describes maturation of by reducing dispersal as the duration of starvation increases. increases when nutrients are replete ( for ) and decreases when nutrients are scarce ( for ) in an autocatalytic fashion. We chose autocatalytic dynamics for this variable because it is likely driven by a synthesized molecular species Laganenka et al. (2016) or gene products Ito et al. (2008) but the exact nature of the dynamics is not critical for the model. captures the increase in aggregate dispersal rate with substrate levels and is a monotonic increasing function of (, ) which we take to be linear above some threshold Note (1). is the characteristic size of the aggregates ( cells) and is the growth yield for E. coli on glucose. , with , provides a proxy for populations adhered to the vessel and therefore not removed by dilution.
Our data permits us to constrain many of the model parameters, including the rate of aggregation (), and the rates of accumulation and degradation of ( and ), , , and have been measured previously Senn et al. (1994). We make analytical arguments to estimate the dispersal rate Note (1). The substrate concentrations and are not known, but our conclusions are not contingent on the specific values of these parameters, and all other parameters are under experimental control. A full description of the model and detailed reasoning for the parameters used in our simulation is given in the Supplemental Material Note (1).
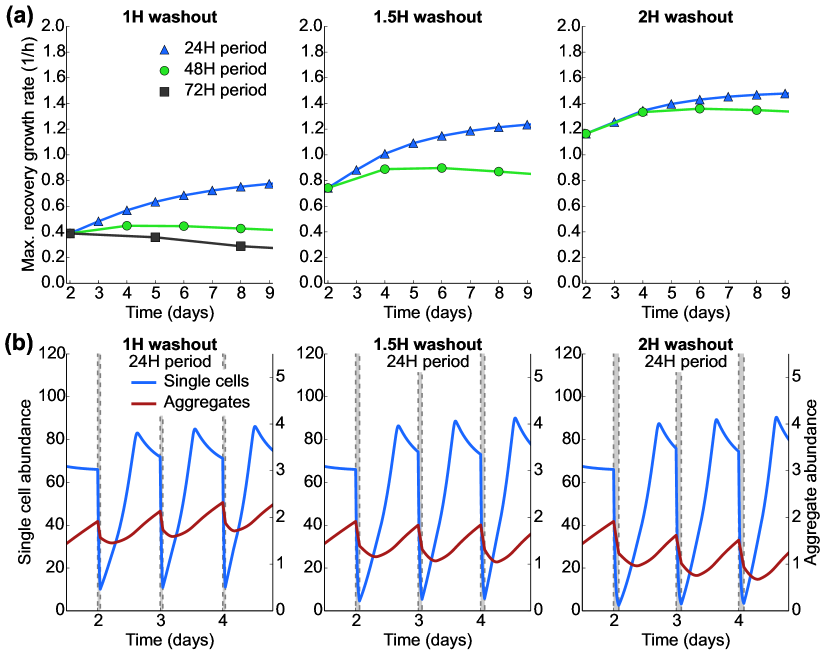
We numerically integrated Equations (1), (2) and (3) and computed the maximum recovery rate as a function of the frequency and amplitude of nutrient fluctuations. We find that the model recapitulates the core features of our experimental observations, namely the frequency and amplitude dependence of the planktonic population abundance dynamics (Fig. 3). The model shows that the dispersal of aggregated or adherent populations can drive the very high planktonic population growth rates we observe experimentally.
We have shown that aggregation or adherent populations respond to increases in nutrient concentrations in a frequency and amplitude dependent fashion. In contrast to recent studies of chemotaxis driven aggregation Laganenka et al. (2016), the dynamics we observe occur despite the fact that our strain lacks the flu gene which encodes an adhesion factor (Ag43) known to drive aggregation at . We suspect that the adhesion dynamics are driven by curli-mediated cell-cell adhesion, which is known to occur at the lower temperature used in this study () Olsén et al. (1989); Laganenka et al. (2016).
It is increasingly clear that non-planktonic bacterial populations are central to metabolic Ito et al. (2009), evolutionary Shapiro et al. (2012) and ecological processes Datta et al. (2016) in a range of habitats. Our study demonstrates that the statistical properties of environmental fluctuations have strong impacts on the lifestyle of bacterial populations which in turn drive rapid changes in abundance dynamics. In the future, it will be important to investigate the eco-evolutionary origins of the frequency and amplitude dependent dynamics observed here.
Acknowledgements.
This work was supported in part by the National Science Foundation Physics Frontiers Center Program (PHY 0822613 and PHY 1430124).References
- Simon et al. (2002) M. Simon, H. P. Grossart, B. Schweitzer, and H. Ploug, Aquat. Microb. Ecol. 28, 175 (2002).
- Datta et al. (2016) M. S. Datta, E. Sliwerska, J. Gore, M. F. Polz, and O. X. Cordero, Nat. Commun. 7, 11965 (2016).
- Kellerman et al. (2014) A. M. Kellerman, T. Dittmar, D. N. Kothawala, and L. J. Tranvik, Nat. Commun. 5, 3804 (2014).
- Seymour et al. (2017) J. R. Seymour, S. A. Amin, J.-B. Raina, and R. Stocker, Nat. Microbiol. 2, 17065 (2017).
- Savageau (1983) M. Savageau, Am. Nat. 122, 732 (1983).
- Schleheck et al. (2009) D. Schleheck, N. Barraud, J. Klebensberger, J. S. Webb, D. McDougald, S. A. Rice, and S. Kjelleberg, PLoS ONE 4, e5513 (2009).
- McDougald et al. (2011) D. McDougald, S. A. Rice, N. Barraud, P. D. Steinberg, and S. Kjelleberg, Nat. Rev. Microbiol. 10, 39 (2011).
- Laganenka et al. (2016) L. Laganenka, R. Colin, and V. Sourjik, Nat. Commun. 7, 12984 (2016).
- Sauer et al. (2004) K. Sauer, M. C. Cullen, A. H. Rickard, L. A. H. Zeef, D. G. Davies, and P. Gilbert, J. Bacteriol. 186, 7312 (2004).
- Ito et al. (2008) A. Ito, T. May, K. Kawata, and S. Okabe, Biotechnol. Bioeng. 99, 1462 (2008).
- Ito et al. (2009) A. Ito, A. Taniuchi, T. May, K. Kawata, and S. Okabe, Appl. Environ. Microbiol. 75, 4093 (2009).
- Merritt and Kuehn (2016) J. Merritt and S. Kuehn, Sci. Rep. 6, 33173 (2016).
- Wick et al. (2002) L. M. Wick, H. Weilenmann, and T. Egli, Microbiol. 148, 2889 (2002).
- Note (1) See Supplemental Material in ancillary files, which includes Refs. Merritt and Kuehn (2016); Levin-Reisman et al. (2010); Scott et al. (2010); Senn et al. (1994); Ito et al. (2008), for details on experimental protocol, model parameters, image segmentation, growth rate, cell size, and cell aggregation.
- Scott et al. (2010) M. Scott, C. W. Gunderson, E. M. Mateescu, Z. Zhang, and T. Hwa, Science 330, 1099 (2010).
- Patra and Klumpp (2013) P. Patra and S. Klumpp, PLoS ONE 8, e62814 (2013).
- Levin-Reisman et al. (2010) I. Levin-Reisman, O. Gefen, O. Fridman, I. Ronin, D. Shwa, H. Sheftel, and N. Q. Balaban, Nat. Methods 7, 737 (2010).
- Reisner et al. (2003) A. Reisner, J. Haagensen, M. A. Schembri, E. L. Zechner, and S. Molin, Mol. Microbiol. 48, 933 (2003).
- Senn et al. (1994) H. Senn, U. Lendenmann, M. Snozzi, G. Hamer, and T. Egli, Biochim. Biophys. Acta 1201, 424 (1994).
- Olsén et al. (1989) A. Olsén, A. Jonsson, and S. Normark, Nature 338, 652 (1989).
- Shapiro et al. (2012) J. J. Shapiro, J. Friedman, O. X. Cordero, S. P. Preheim, S. C. Timberlake, G. Szabo, M. F. Polz, and E. J. Alm, Science 336, 48 (2012).