SCUSS u Band Emission as a Star-Formation-Rate Indicator
Abstract
We present and analyze the possibility of using optical u-band luminosities to estimate star-formation rates (SFRs) of galaxies based on the data from the South Galactic Cap u band Sky Survey (SCUSS), which provides a deep u-band photometric survey covering about 5000 of the South Galactic Cap. Based on two samples of normal star-forming galaxies selected by the BPT diagram, we explore the correlations between u-band, H, and IR luminosities by combing SCUSS data with the Sloan Digital Sky Survey (SDSS) and Wide-field Infrared Survey Explorer (WISE). The attenuation-corrected u-band luminosities are tightly correlated with the Balmer decrement-corrected H luminosities with an rms scatter of 0.17 dex. The IR-corrected u luminosities are derived based on the correlations between the attenuation of u-band luminosities and WISE 12 (or 22) m luminosities, and then calibrated with the Balmer-corrected H luminosities. The systematic residuals of these calibrations are tested against the physical properties over the ranges covered by our sample objects. We find that the best-fitting nonlinear relations are better than the linear ones and recommended to be applied in the measurement of SFRs. The systematic deviations mainly come from the pollution of old stellar population and the effect of dust extinction; therefore, a more detailed analysis is needed in the future work.
Subject headings:
dust, extinction — galaxies: star formation — galaxies: ISM — infrared: galaxies1. Introduction
Star formation is crucial in galaxy formation and evolution. Star-formation rate (SFR) is one of the most important diagnostics in understanding the evolution of galaxies across cosmic times. The measurement of SFRs in galaxies can give clues to the physical processes in shaping galaxies. As the improvements of new observations over the past decades, large-scale SFRs can be traced by many indicators at different wavelengths, ranging from the X-ray to the radio, and using both continuum and nebular recombination emission lines (see Kennicutt, 1998; Kennicutt & Evans, 2012, for reviews).
Among many SFR indicators, the ultraviolet (UV) continuum of galaxies is directly tied to the photospheric emission of young stellar population formed over the past 100 Myr, and hence serves as one of the most powerful probes of SFRs in galaxies (e.g., Kennicutt, 1998; Hao et al., 2011; Murphy et al., 2011). However, the main disadvantage of this tracer is its sensitivity to dust attenuation. Nebular recombination lines such as H trace ionized gas surrounding stars with masses of 10 and lifetimes of 3-10Myr, and represent a nearly instantaneous measure of the SFR (e.g., Kewley et al., 2002; Brinchmann et al., 2004; Kennicutt & Evans, 2012). The forbidden lines such as [O ii] can be used as SFR tracers after empirical calibrations (e.g., Kennicutt, 1992; Kewley et al., 2004). However, the optical emission lines are sensitive to dust attenuation and the assumptions of the initial mass function (IMF). They are also affected by active galactic nuclei (AGNs) and metallicity (Moustakas et al., 2006). The starlight absorbed at UV and optical wavebands by the interstellar dust is re-emitted in infrared (IR), so the IR emission can be used as a sensitive tracer of the young stellar population formed over a period of 0100 Myr (Wu et al., 2005; Calzetti et al., 2007; Zhu et al., 2008; Wen et al., 2014; Ellison et al., 2016). The major systematic errors of IR based SFRs come from the missing unattenuated starlight and dust heating from evolved stars. Besides that, composite multiwavelength tracers are applied to construct dust-corrected SFRs, such as the combination of UV and IR observations (e.g., Fisher et al., 2009; Hao et al., 2011) and the combination of observed H and IR luminosities (e.g., Zhu et al., 2008; Kennicutt et al., 2009; Lee et al., 2013; Wen et al., 2014).
Apart from the above tracers, the u-band ( 355 nm) luminosity of a galaxy is dominated by young stars of ages 1 Gyr, and has been proved to be a reasonable star-formation indicator (Cram et al., 1998; Hopkins et al., 2003; Moustakas et al., 2006; Prescott et al., 2009). Although the u-band traces more evolved stars than other tracers, its advantages over other tracers are that (1) high-quality images of u-band are easier to be obtained from ground-based telescopes, (2) large sky surveys can accumulate much more u-band photometric data than others in a short time. The early application of this method was analyzed with broadband luminosities of galaxies in the 1990s (e.g., Cowie et al., 1997; Cram et al., 1998; Kennicutt, 1998). Similar studies have been carried out with the image survey of the Sloan Digital Sky Survey (SDSS; York et al., 2000). For example, Hopkins et al. (2003) constructed the calibration from u-band luminosity to SFR with a complete and volume-limited sample of star-forming galaxies from SDSS. With the SDSS sample, Moustakas et al. (2006) studied the effects of dust reddening and old stellar populations on the U-band luminosity as an SFR tracer, and presented the relation of U to H. Prescott et al. (2009) estimated the evolution of the cosmic star-formation history from u-band luminosity density after removing the contribution of old stellar populations and dust attenuation.
The present calibrations of u-band-based SFRs are mainly constructed based on the SDSS data and in the form of single-band measurements. It is remarkable that the availability of recent and upcoming deep optical surveys, such as the Canada-France-Hawaii Telescope Legacy Survey, the South Galactic Cap u-band Sky Survey (SCUSS; Zhou et al., 2016; Zou et al., 2015), and the Large Synoptic Survey Telescope (Tyson, 2002), provide opportunities to measure SFRs of unprecedented large samples with u-band data. With the advent of these deep and wide-field surveys, it becomes necessary to recalibrate the u-band-based SFR.
This paper investigates the reliability and precision of u-band-based SFR using the observations from SCUSS. SCUSS provides deeper u-band photometric data than SDSS. These data are used to compare with H and IR SFR indicators to derive an accurate uSFR calibration for normal star-forming galaxies and to identify the limits of its applicability. We also derive calibrations of composite SFR indices, which combine u-band and IR luminosities to construct dust-corrected SFRs.
This paper is organized as follows. In Section 2 we briefly introduce the SCUSS survey and supplementary data and describe our samples. Section 3 compares the u band with H and IR luminosities and derives their relations. In Section 4 we analyze the scatter and applicability limits of our SFR calibrations. In Section 5 we summarize our results. Throughout this paper, we assume a flat CDM cosmological model with 0.3, , and .
2. Data and Sample
2.1. SCUSS
SCUSS is a u-band ( 3538Å) survey imaging 5,000 deg2 in the northern part of the Southern Galactic Cap. It started in 2010 and finished in 2013. This survey was carried out using the 90Prime imager, a 1 deg2 wide-field camera on the 2.3m Bok telescope at the Steward Observatory on Kitt Peak. The filter used is similar to that of the SDSS u-band, but a little bluer. The astrometric calibration is derived based on the Fourth US Naval Observatory CCD Astrograph Catalog (UCAC4), and the photometric calibration is carried out with SDSS Data Release 9 (DR9) photometric catalog. The limiting magnitude of SCUSS is 23.2 (with S/N=5 for point-like sources), about one magnitude deeper than SDSS u-band photometry. More detailed introduction of the SCUSS survey can be found in Zhou et al. (2016) and the data reduction in Zou et al. (2015).
The survey area of SCUSS overlaps the photometric and spectroscopic survey of SDSS and the all-sky data of Wide-field Infrared Survey Explorer (WISE; Wright et al., 2010) at 3.4, 4.6, 12, and 22 m. These two surveys therefore provide spectroscopic and photometric data for our samples.
2.2. Supplementary data
SDSS provides multi-color (u, g, r, i, z) images for one-third of the sky and spectra for millions of astronomical objects. The footprint of SDSS covers more than 75% of SCUSS fields. In this paper, we use the SDSS DR9 photometric catalog and the emission-line measurements of galaxy spectra from MPA-JHU spectroscopic analysis (Brinchmann et al., 2004; Tremonti et al., 2004). The model magnitudes of galaxies are accepted (except u-band) in the photometric catalog, and the emission-line fluxes, which are corrected for Galactic extinction, are derived from the MPA-JHU catalogs.
The H emission line is used as a reference SFR tracer to calibrate the u-band-based SFR indicators. To derive the H luminosities and SFRs of galaxies, we need to correct the aperture bias and dust extinction for the H emission line. The aperture correction is performed following the method of Hopkins et al. (2003) (their equation [A2]) by using the r-band fiber and Petrosian magnitudes of SDSS. The main assumption of this method is that the emission and star-formation activity through the fiber is characteristic of the whole galaxy, thus the curves-of-growth of the H emission line and continuum across the galaxy are the same. The line fluxes in the MPA-JHU catalog have been corrected for the foreground Galactic extinction by assuming the Cardelli et al. (1989) extinction curve (). To perform the intrinsic extinction correction, we use the Calzetti et al. (2000) extinction law (, and ) and assume the Balmer decrement of intrinsic H 2.86 for the Case B recombination at and (Osterbrock, 1989). Thus, the intrinsic extinction of H is
| (1) |
The SFRs of galaxies based on H luminosities are derived using the calibration from Kennicutt (1998): , which adopts a Salpeter IMF with stellar masses in the range of 0.1–100 M⊙ and stellar population models with solar abundances.
The Wide Field Infrared Survey Explorer (WISE; Wright et al., 2010) provides a mid-infrared imaging survey of the entire sky at 3.4, 4.6, 12, and 22 m with an angular resolution of 61, 64, 65, and 120, respectively. WISE 12 and 22m luminosities have proved to be useful SFR indicators (Jarrett et al., 2013; Lee et al., 2013; Wen et al., 2014), and WISE 3.4m luminosity can be used to calculate the stellar masses of galaxies (Wen et al., 2013). We use the ALLWISE source catalog which contains positional and photometric information for over 747 million objects detected on the deep, coadded WISE Images. The profile-fit photometry magnitude of each band is accepted in our research.
2.3. Sample
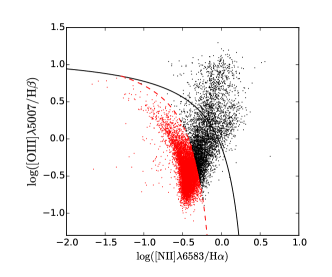
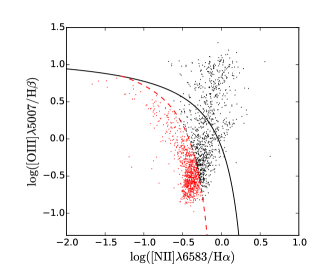
The SCUSS database has been cross-matched and integrated with the SDSS DR9 photometric catalog with a matching radius of 20 (Zou et al., 2016). We match the SCUSS sources with the MPA-JHU catalog to get the spectroscopic information, and then match with the ALLWISE catalog with 30 radius. If multiple optical sources are located within 30 of a WISE source, the nearest optical source is selected. In order to produce the accurate SFR calibration, we select the pure star-forming galaxies with no contamination of AGN based on the BPT diagnostic diagram: [N ii]/H versus [O iii]/H (Baldwin et al., 1981; Veilleux & Osterbrock, 1987). In Figure 1, we select the sources that have all BPT diagnostic lines detected at S/N 3 and lie below the AGN rejection line of Kauffmann et al. (2003):
| (2) |
From the star-forming galaxies, we select galaxies with S/N 10 in the 12 m band as Sample 1, and select galaxies with S/N 10 in the 22 m band as Sample 2. There are 8724 galaxies in Sample 1 and 872 in Sample 2.
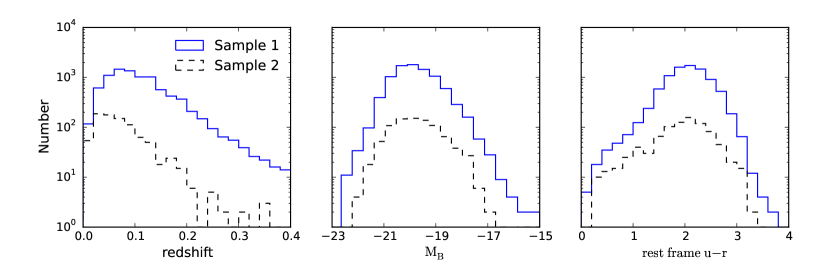
To derive the rest-frame magnitudes and color, we compute the K-correction for each galaxy using the spectral energy distribution (SED) templates and fitting code of Assef et al. (2010). The SED templates are built for AGNs and galaxies in the wavelength range from 0.03 to 30 m. We use the model magnitudes of SCUSS u-band and SDSS griz bands and the profile-fit photometry magnitudes of WISE W1–4 bands for the SED fit during the K-correction.
Figure 2 shows the distributions of redshifts, B-band absolute magnitudes () and rest-frame colors for the two samples. The redshift information is derived from the MPA-JHU catalogs and is calculated from the SDSS g- and r-band magnitudes after K-correction based on the transformation equation of Smith et al. (2002). We find no significant difference in the distributions of the two samples. Most of the galaxies have redshifts less than 0.4 and cover a range of .
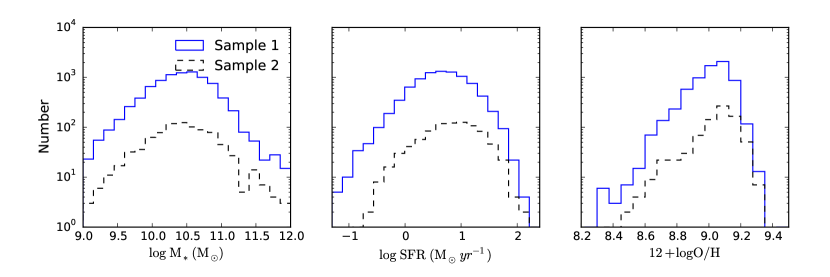
Figure 3 shows the distribution of stellar masses, SFRs, and gas-phase metallicities. The stellar masses of galaxies are estimated with WISE 3.4 m luminosities by using the calibration of Wen et al. (2013) (their coefficients for H ii galaxies), and the metallicities are derived from SDSS MPA-JHU catalog. No obvious difference is found in these distributions for the two samples, which have the stellar masses of – , SFRs of 0.1 – 100 , and 12+log O/H of 8.3 – 9.3.
| y | x | a | b | s | c | r |
|---|---|---|---|---|---|---|
| (1) | (2) | (3) | (4) | (5) | (6) | (7) |
| 10.310.16 | 0.800.01 | 0.17 | 1.810.13 | 0.88 | ||
| L(12 m) | 11.790.17 | 0.740.01 | 0.18 | 0.500.13 | 0.87 | |
| L(12 m) | 19.350.68 | 0.560.02 | 0.27 | 0.350.29 | 0.73 | |
| 9.780.16 | 0.810.01 | 0.16 | 1.810.13 | 0.89 | ||
| 9.260.59 | 0.820.01 | 0.19 | 1.680.16 | 0.83 |
Note. — Cols (1) and (2): the names of wavelength-band and emission-line luminosities, which are in units of erg . (3) and (4): The coefficients a and b of the nonlinear fit: log(y) = a + b log(x). (5): The standard deviation s of the fitting residuals. (6): The coefficient c of the linear fit: log(y) = c + log(x). (7): The Spearman rank-order correlation coefficient r.
3. Analysis
3.1. Dust correction to u-band Luminosities
As addressed in the Introduction, u-band luminosity can be used as an SFR indicator of galaxies, but similar to UV, it also suffers from dust extinction. Therefore, it is necessary to correct the extinction for the u-band flux. The Galactic extinction in the SCUSS u-band follows the value in SDSS extinction_u, which is derived from the Schlegel et al. (1998) dust maps and the assumption of absorbing medium.
The intrinsic dust extinction for u-band luminosities is estimated using the Calzetti et al. (2000) obscuration curve and the color excess of stellar continuum . Since the geometries of the dust distribution are different relative to stars and gas, and the covering factor of the dust is smaller for stars than for gas, the stellar continuum can be subject to a lower degree of reddening than nebular emission lines (Calzetti, 1997; Johansson et al., 2016), and should be smaller than the color excess of ionized gas . Here we use the empirical relation of Calzetti et al. (2000): , where is derived based on the Balmer decrements. This yields the relation of . The attenuation-corrected u-band luminosities is
| (3) |
and the amount of attenuation at the u-band is
| (4) |
3.2. u band versus H
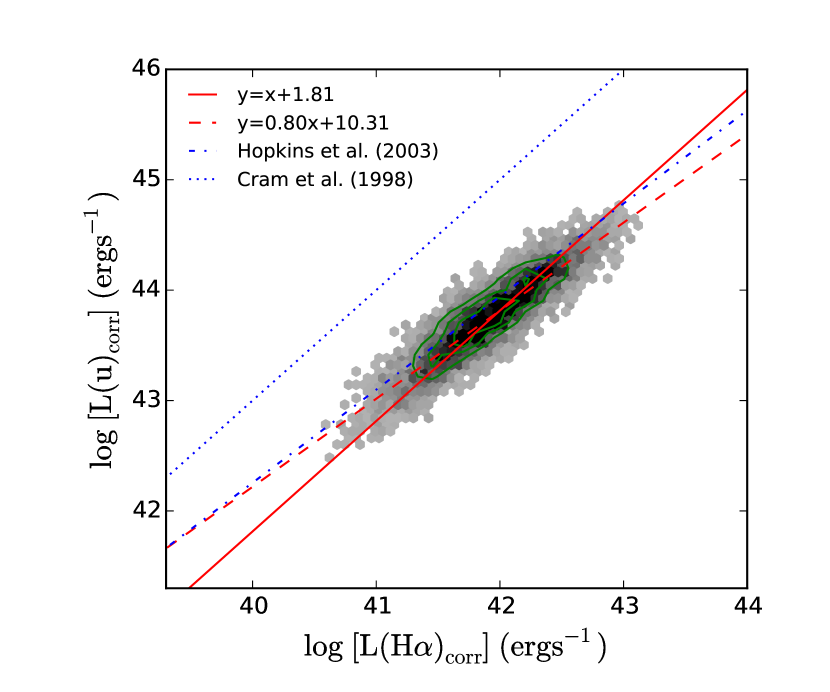
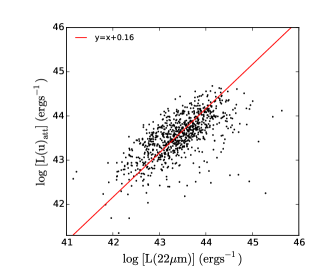
Because nearly all galaxies in Sample 2 are included in Sample 1, we use Sample 1 to compare the luminosities of the u band and the H emission line, as shown in Figure 4. It can be clearly seen that the attenuation-corrected u-band luminosities correlate tightly with the Balmer decrement-corrected H luminosities with the Spearman rank-order correlation coefficient of 0.88. The best linear and nonlinear fits to Sample 1 are shown as:
| (5) |
| (6) |
The scatter of the nonlinear fit is 0.17 dex. For comparison, the relations from Hopkins et al. (2003) and Cram et al. (1998) are also plotted in Figure 4. Our fitting results are similar to that of Hopkins et al. (2003), which used SDSS data and the same dust correction methods. However, the relation of Cram et al. (1998) deviates from our results; the reason is likely that the data of Cram et al. (1998) are the broadband U (not u) luminosities of disk galaxies scaled from far-UV using relevant synthesized spectra.
3.3. u band versus WISE 12 and 22 m
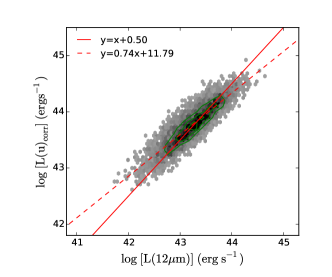
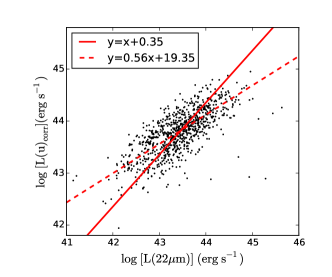
The WISE 12 and 22 m band luminosities are useful IR tracers of SFRs in galaxies (Shi et al., 2012; Lee et al., 2013; Wen et al., 2014). We compare the extinction-corrected u-band luminosities with 12 and 22 m band luminosities in Figure 5. Sample 1 is used to derive the correlation of u and 12 m, whose best linear and nonlinear fits are
| (7) |
| (8) |
Sample 2 is used to derive the correlation of u and 22 m, whose best linear and nonlinear fits are
| (9) |
| (10) |
The scatters of the nonlinear fits are 0.18 for u versus 12 m, and 0.27 for u versus 22 m, larger than that for u versus H. All nonlinear and linear coefficients of the relationships between u-band and H and IR are summarized in Table 1.
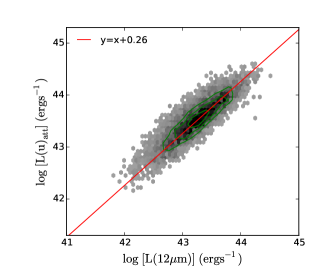
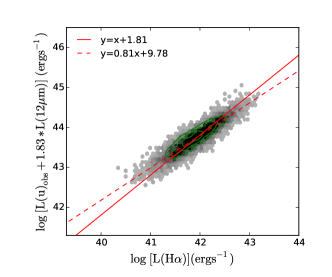
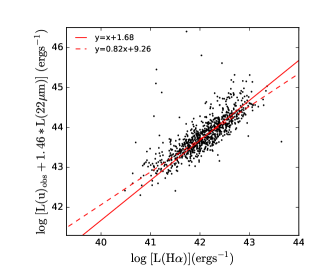
3.4. The Composite SFR Indicators of u Band and IR
Since the starlight absorbed at short wavelengths by interstellar dust is re-radiated in IR, it is possible to use the IR luminosity to trace dust-obscured star formation. Thus, we can use the combination of the IR 12/22 m luminosity and observed u luminosity to probe the dust-free u-band luminosity.
4. Discussion

In previous sections, we have derived the u versus H relations, and combined u and WISE IR luminosities to construct the composite dust-corrected SFR indicators. Specifically, u and composite indicators were compared to the aperture- and dust-corrected H luminosity and were calibrated with linear and nonlinear fits. We have demonstrated that the fits of u versus H with the scatter of 0.17 dex are consistent with the relation of Hopkins et al. (2003). For the composite indicators, The combinations adopt the form of , and the calibration scatters are 0.16 and 0.19 dex for u +12 and u +22, respectively.
As we mentioned above, these indicators have been calibrated based on the samples with limited ranges of galaxy properties, it is important to understand their applicability limits and systematic uncertainties and how the uncertainties are affected by galaxy properties.
In Section 2.3, we have described the physical properties of our samples. The present samples are selected using the BPT diagram, they cover the star-forming galaxies in the local universe with the redshift less than 0.4. The ranges of stellar masses, SFRs, and metallicities spanned by our sample galaxies are – , 0.1 – 100 , and 12+logO/H = 8.3–9.3, respectively. Therefore, more caution is needed when our calibrations are used to objects outside the above ranges.
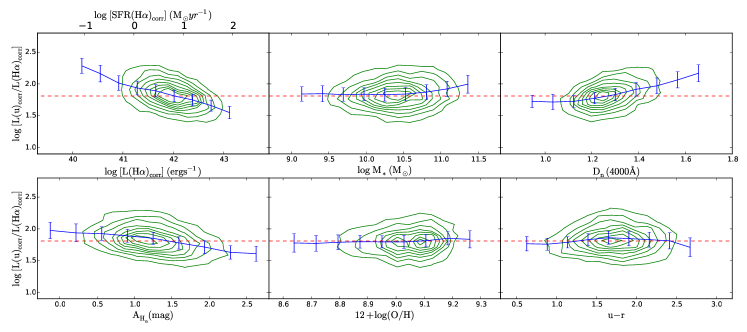
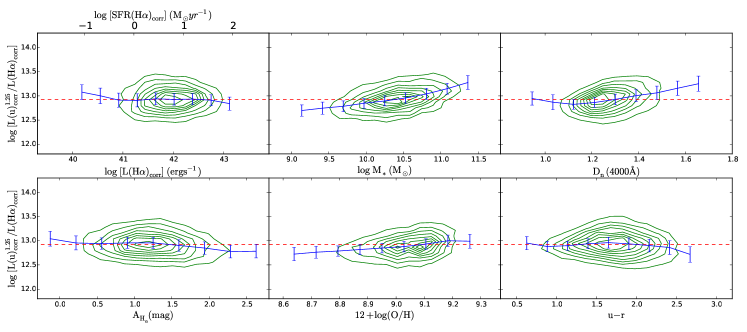
In order to establish whether the residuals from these calibrations vary systematically with galaxy properties, we derived systematic residuals against six parameters, i.e., SFRs, stellar masses, , dust attenuation, metallicities, and colors of galaxies. The dependences on these parameters are plotted in Figure 8–11 for the calibrations of each indicators.
In Figure 8 and 9, we present the residuals from the linear and nonlinear calibrations of attenuation-corrected u-band luminosities (i.e., Eq. 5 and Eq. 6). Given that H traces SFRs and provides a rough measure of the relative age of stellar population in galaxies, we find a dependence of the residuals from the linear fit on SFRs, stellar population, and dust attenuation, such that the residuals decrease with increasing SFRs and attenuations, and increase with the ages of stellar population, while the dependence is very weak for the residuals from the nonlinear fit. These suggest that it is difficult to assign a simple scaling factor to derive an SFR relation for the u band (Hopkins et al., 2003), and the nonlinear fits are better than the linear ones. Thus, the nonlinear calibrations are recommended to be used in the measurement of SFRs in galaxies and are mainly focused on in the next analysis.
The ratios of the u-band nonlinear fit to H luminosities in Figure 9 show no or at most marginal trends with nearly all of the physical parameters except weak trends for stellar masses and , which are mainly due to the contamination of old stars to the actual u-band luminosity (Cram et al., 1998). Galactic color is a rough index of stellar population, which should be used to correct the contribution from old stars in the u-band (e.g., Kennicutt, 1998; Davies et al., 2016). However, we cannot find any clear trend between the ratio and rest-frame color in the right bottom panel of Figure 9, so it is difficult to find an appropriate form to correct the pollution of old stellar population to the u-band luminosity using the color .
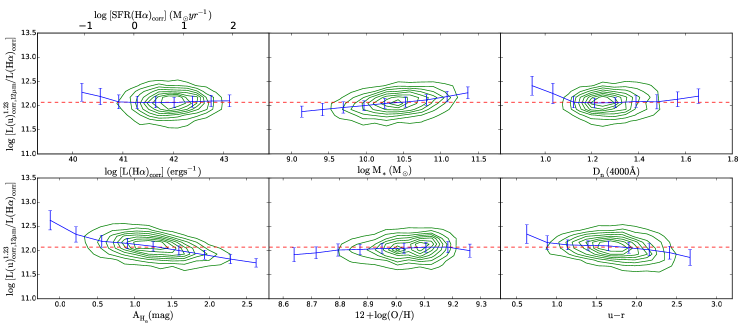
In Figures 10 and 11, the residuals from the nonlinear fits of combinations u +12 and u +22 are explored. Similar to the behaviors of the nonlinear fitting result of u-band luminosity, the ratios of u +12 to H show little trends with the physical parameters at least for most of the samples, while there are weak dependences on stellar masses and dust attenuation. The residuals of u +12 show negative correlation with the dust attenuation along with a deviation of 0.10.3 dex in the range of A0.5 mag and A2.0 mag. The possible reasons for the correlation are the change in the effective extinction curves, which are affected by star-formation intensity (Hao et al., 2011) and the contribution from dust heating by the old stellar population (Bell, 2003; Zhu et al., 2008). The behaviors of u +22 in Figures 11 are similar to those of u +12 but with larger dispersion, which is probably due to the far fewer galaxies in the sample and the different dust grain species of 12 and 22 in star-forming galaxies (Zhu & Wu, 2015).
5. Summary
We have presented and analyzed the possibility of using the optical u-band luminosities to estimate SFRs of galaxies, and build u–H relations. The correlations between u, H and IR luminosities were explored based on two samples of BPT-selected star-forming galaxies. The u-band and the combination of u and IR fluxes were empirically calibrated to derive attenuation-corrected SFR indicators. The coefficients in these calibrations are summarized in Table 1, which can be used as the empirical formulae to derive SFRs in normal star-forming galaxies. Our main results and conclusions are summarized as follows.
-
1.
The u-band luminosities are dust corrected based on Balmer decrements after K-correction. The attenuation-corrected u-band luminosities correlate tightly with the Balmer decrement-corrected H luminosities with the Spearman rank-order correlation coefficient of 0.88. Its nonlinear fit to H is better than the linear one with an rms scatter of 0.17 dex, consistent with the results of Hopkins et al. (2003).
-
2.
u-band is compared with WISE 12 and 22 m bands, which are useful SFR tracers of galaxies. The rms scatters of their correlations are 0.18 dex for u versus 12 m, 0.27 dex for u versus 22 m, larger than that for u versus H.
-
3.
We compared the correlations between the attenuation of u-band and WISE 12/22 m luminosities, and derived IR-corrected u luminosities. Then the linear combinations of 12/22 m with u-band luminosities are calibrated with the Balmer-corrected H luminosities. The correlation of u +12m with H is better than that of u +22m with H.
-
4.
The systematic residuals of our calibrations are tested against the physical properties of normal star-forming galaxies. The nonlinear fitting results are found to be better than the linear ones, and recommended to be applied in the measurement of SFRs. There are weak dependences on stellar masses, due to the contamination of old stars, and the residuals of u +12/22m show slightly negative correlation with the dust attenuation due to the extinction curves and old stellar population.
In brief, this paper provides an attempt of using optical u-band emission to measure SFRs of galaxies and offers the empirical formulae, while lots of open questions still remain in the calibration of u band to galactic SFRs. Therefore, a more detailed analysis of the stellar populations and dust extinction is needed, and the galactic classifications and galaxies at higher redshift will be employed in the future work.
References
- Assef et al. (2010) Assef, R. J., Kochanek, C. S., Brodwin, M., et al. 2010, ApJ, 713, 970
- Baldwin et al. (1981) Baldwin J. A., Phillips M. M., & Terlevich R., 1981, PASP, 93, 5
- Brinchmann et al. (2004) Brinchmann, J., Charlot, S., White, S. D. M., Tremonti, C., Kauffmann, G., et al. 2004, MNRAS, 351, 1151
- Bell (2003) Bell, E. F. 2003, ApJ, 586, 794
- Calzetti (1997) Calzetti, D. 1997, American Institute of Physics Conference Series, 408, 403
- Calzetti et al. (2000) Calzetti, D., Armus, L., Bohlin, R. C., et al. 2000, ApJ, 533, 682
- Calzetti et al. (2007) Calzetti, D., Kennicutt, R. C., Engelbracht, C. W., et al. 2007, ApJ, 666, 870
- Cardelli et al. (1989) Cardelli, J. A., Clayton, G. C., & Mathis, J. S. 1989, ApJ, 345, 245
- Cowie et al. (1997) Cowie, L. L., Hu, E. M., Songaila, A., & Egami, E. 1997, ApJ, 481, L9
- Cram et al. (1998) Cram, L., Hopkins, A., Mobasher, B., & Rowan-Robinson, M. 1998, ApJ, 507, 155
- Davies et al. (2016) Davies, L. J. M., Driver, S. P., Robotham, A. S. G., et al. 2016, MNRAS, 461, 458
- Ellison et al. (2016) Ellison, S. L., Teimoorinia, H., Rosario, D. J., & Trevor Mendel, J. 2016, MNRAS, 455, 370
- Fisher et al. (2009) Fisher, D. B., Drory, N., & Fabricius, M. H. 2009, ApJ, 697, 630
- Hao et al. (2011) Hao, C.-N., Kennicutt, R. C., Johnson, B. D., Calzetti, D., Dale, D. A., & Moustakas, J. 2011, ApJ, 741, 124
- Hopkins et al. (2003) Hopkins, A. M., Miller, C. J., Nichol, R. C., et al. 2003, ApJ, 599, 971
- Jarrett et al. (2013) Jarrett, T. H., Masci, F., Tsai, C. W., et al. 2013, AJ, 145, 6
- Johansson et al. (2016) Johansson, J., Woods, T. E., Gilfanov, M., et al. 2016, MNRAS, 461, 4505
- Kauffmann et al. (2003) Kauffmann, G., Heckman, T. M., Tremonti, C., et al. 2003, MNRAS, 346, 1055
- Kennicutt (1992) Kennicutt, R. C. 1992, ApJ, 388, 310
- Kennicutt (1998) Kennicutt, R. C. 1998, ARA&A, 36, 189
- Kennicutt et al. (2009) Kennicutt, R. C., Hao, C.-N., Calzetti, D., Moustakas, J., Dale, D. A., et al. 2009, ApJ, 703, 1672
- Kennicutt & Evans (2012) Kennicutt, R. C., & Evans, N. J. 2012, ARA&A, 50, 531
- Kewley et al. (2001) Kewley, L. J., Heisler, C. A., Dopita, M. A., & Lumsden, S. 2001, ApJS, 132, 37
- Kewley et al. (2002) Kewley, L. J., Geller, M. J., Jansen, R. A., & Dopita, M. A. 2002, AJ, 124, 3135
- Kewley et al. (2004) Kewley, L. J., Geller, M. J., & Jansen, R. A. 2004, AJ, 127, 2002
- Lee et al. (2013) Lee J. C., Hwang H. S., Ko J., 2013, ApJ, 774, 62
- Moustakas et al. (2006) Moustakas, J., Kennicutt, R. C., Jr., & Tremonti, C. A. 2006, ApJ, 642, 775
- Murphy et al. (2011) Murphy, E. J., Condon, J. J., Schinnerer, E., Kennicutt, R. C., Calzetti, D., et al. 2011, ApJ, 737, 67
- Osterbrock (1989) Osterbrock, D. E. 1989, Astrophysics of Gaseous Nebulae and Active Galactic Nuclei (Mill Valley: University Science Books)
- Prescott et al. (2009) Prescott, M., Baldry, I. K., & James, P. A. 2009, MNRAS, 397, 90
- Schlegel et al. (1998) Schlegel, D. J., Finkbeiner, D. P., & Davis, M. 1998, ApJ, 500, 525
- Shi et al. (2012) Shi, F., Kong, X., Wicker, J., et al. 2012, Journal of Astrophysics and Astronomy, 33, 213
- Smith et al. (2002) Smith, J. A., Tucker, D. L., Kent, S., et al. 2002, AJ, 123, 2121
- Tremonti et al. (2004) Tremonti, C. A., Heckman, T. M., Kauffmann, G., et al. 2004, ApJ, 613, 898
- Tyson (2002) Tyson, J. A. 2002, Proc. SPIE, 4836, 10
- Veilleux & Osterbrock (1987) Veilleux S., & Osterbrock D. E., 1987, ApJS, 63, 295
- Wen et al. (2013) Wen X.-Q., Wu H., Zhu Y.-N., Lam M. I., Wu C.-J., Wicker J., Zhao Y.-H.,2013, MNRAS, 433, 2946
- Wen et al. (2014) Wen, X.-Q., Wu, H., Zhu, Y.-N., et al. 2014, MNRAS, 438, 97
- Wright et al. (2010) Wright, E. L., Eisenhardt, P. R. M., Mainzer, A. K., et al. 2010, AJ, 140, 1868-1881
- Wu et al. (2005) Wu, H., Cao, C., Hao, C.-N., Liu, F. S., Wang, J. L., Xia, X. Y., Deng, Z. G., & Young, C. K. S., 2005, ApJ, 632, L79
- York et al. (2000) York, D. G., Adelman, J., Anderson, J. E., Jr., et al. 2000, AJ, 120, 1579
- Zhou et al. (2016) Zhou, X., Fan, X.-H., Fan, Z., et al. 2016, Research in Astronomy and Astrophysics, 16, 69
- Zhu et al. (2008) Zhu, Y.-N., Wu, H., Cao, C., & Li, H.-N., 2008, ApJ, 686, 155
- Zhu & Wu (2015) Zhu, Y.-N., & Wu, H. 2015, MNRAS, 446, 254
- Zou et al. (2015) Zou, H., Jiang, Z., Zhou, X., et al. 2015, AJ, 150, 104
- Zou et al. (2016) Zou, H., Zhou, X., Jiang, Z., et al. 2016, AJ, 151, 37