Lattice animals in diffusion limited binary colloidal system
Abstract
In soft matter system controlling the structure of the amorphous materials have been a key challenge. In this work we have modeled irreversible diffusion limited cluster aggregation of binary colloids, which serves as a model for chemical gels. Irreversible aggregation of binary colloidal particles lead to the formation of percolating cluster of one species or both species also called bigels. Before the formation of the percolating cluster the system form self similar structure defined by a fractal dimension. For a one component system when the volume fraction is very small the clusters are far apart from each other and the system has a fractal dimension of . Contrary to this we will show that for the binary system we observe the presence of lattice animals which has a fractal dimension of irrespective of the volume fraction. When the clusters start inter penetrating we observe a fractal dimension of same as in the case of one component system. We were also able to predict the formation of bigels using a simple inequality relation. We have also shown that the growth of clusters follows the kinetic equations introduced by Smoluchowski for diffusion limited cluster aggregation. Further more we are also proposing a universal parameter for irreversible binary colloidal system, which follows the scaling laws proposed by percolation theory.
pacs:
Valid PACS appear hereI Introduction
Irreversible aggregation of colloidal particles like proteinsMezzenga and Fischer (2013); Zaccarelli (2007), DNA grafted nano-materials Hecht and Bausch (2016); Blumlein and McManus (2015); Varrato et al. (2012) etc leads to the formation of percolating clusters or gels. These amorphous materials are very important from a fundamental point as well as find a range of application in industryBoles et al. (2016); Duguet et al. (2011). The scaling laws associated with structure and kinetics of amorphous materials are very well explained by the percolation theoryStauffer (1979). Two limiting cases for irreversible aggregation are diffusion limited cluster aggregation (DLCA) and reaction limited cluster aggregation (RLCA) model both of which have been extensively studied Meakin (1983); Botet et al. (1984); Klein and Meakin (1989); Orrite et al. (2005); Lu and Weitz (2013). The aggregation number of the self similar clusters formed from irreversible aggregation of particle is related to the radius of gyration by where is the fractal dimension of the clustersWeitz et al. (1985). Also the number density of the cluster scale with the aggregation number as Stauffer (1979). In DLCA if the cluster are far apart from each other we have the flocculation regime characterized by and , while when the clusters start to interpenetrate we have the percolation regime where and . In reversible aggregation it has already been shown that the system undergoes a transition from continuous to directed percolation depending on strength of attraction Kohl et al. (2016).
Recently there have been many experimental and theoretical work on the aggregation of binary colloids using patchy particlesde Las Heras et al. (2012), DNA grafted on to the colloidal particles Hecht and Bausch (2016); Blumlein and McManus (2015); Varrato et al. (2012) or using two different types of micellesKlymenko et al. (2014), at finite temperatures. In the present work we have studied a model of irreversible DLCA for binary colloidal particles both having the same diameter and differ only in the way particles interact. The particles of the same species form irreversible bonds on collision, while particle of different species have hard core repulsive interaction. Depending on the fraction of species in the system we observe the appearance of percolated cluster of one or both species also called bigels.
Here we report on the simulation study of DLCA binary colloidal system with short range interaction, where we have observed the appearance of bigels or one component gel depending on the fraction of each species for a particular volume fraction. We have proposed an inequality relation where by we were able to predict the appearance of bigel for a particular volume fraction. We have also shown that the aggregation kinetics of the system are very well described by the Smoluchowski rate equation. In the flocculation region instead of the fractal dimension of we observe the appearance of lattice animals which has a , which we have also confirmed using the scaling between and . We have proposed a universal parameter for the species whose knetics is aressted and can not form percolating cluster. We have also shown that the universal parameter follows the scaling laws proposed by the percolation theory.
II Simulation
The simulation method used in the present work is called the Brownian cluster dynamics (BCD). BCD was introduced primarily to study the kinetics and dynamics of monomeric system. It has already been shown that this simulation techniques agree with the well known event driven molecular dynamics simulationBabu et al. (2008a). In the present study we have modified BCD to accommodate binary spherical particles. We start our simulation with randomly distributed spheres of unit size in a cubic box of length . The volume fraction of the system is given by . We randomly pick a fraction where is the number of particles and is the fraction of particles present in the system. In the present study we will be working with different ratios of and particle, and we have always kept . Inter species particles interact only via hard core repulsion, while intra species particles interact via a very short range square well potential with an interaction range of typical of a colloid. All the particles are displaced in a random direction using a step size , and the time is incremented by where is the number of simulation steps. It has already been demonstrated that if the step size is sufficiently small BCD is equivalent to Brownian dynamic simulationRottereau et al. (2005). Thus is defined as the time taken by a monomer to travel its own diameter, where the diffusion coefficient of monomer is given by . During random diffusion as soon as same kind of particles are within the range of the square well an irreversible bond is formed between them. All such connected spheres together are called a cluster, where a monomer is considered as a cluster of aggregation number . After the diffusion of individual monomers within the cluster the center of mass of the cluster would have displaced in a random direction, on in other words we have followed Rouse dynamicsRouse Jr (1953). During the movement step if it leads to overlap with other sphere or leads to breaking of the bond we reject those movement steps. In addition to the Rouse dynamics the center of mass of the cluster is displaced in the same direction of the center of mass calculated from the Rouse dynamics. The displacement is now inversely proportional to its radius of the cluster Babu et al. (2008a) and if it leads to overlap with other cluster we reject the movement step mimicking Zimm dynamics Zimm (1956). The box size was varied from and the results in the present study is not influenced by finite size effects.
III Results
III.1 Phase diagram
Irreversible aggregation of component colloidal system always leads to the formation of percolating clusters or gels Meakin (1983), which in the present work we have defined as a cluster which extends between the opposite end of the simulation box. In the binary colloidal system as we change the fraction of particles , we always observe a percolating cluster of the particles irrespective of the volume fraction, while the particles forms percolating cluster depending on the fraction of . In Fig.1 we have plotted as a function of , where we have identified regions as the one component gel when only particles percolate and component gel or bigel Hecht and Bausch (2016); Blumlein and McManus (2015); Varrato et al. (2012) when both the particles percolate. For identifying the component gel we have performed simulations for different configurations in a box size of at a particular combination of and . If in more than of the trials only the particles formed a percolating network and also the kinetics of particles is arrested we have defined it as a component gel. Likewise in trials if in more than of the trials the configuration resulted in a percolating cluster for both and particles we have defined it as a bigel. From Fig.1, we can observe that when we have a percolating cluster only for the particles irrespective of the . The aggregating clusters will not able to form a percolating cluster. The reason being the growth of the cluster is hindered by the presence of the percolating cluster. As we go to higher for , we have less particles in as well as more particles, which eventually results in the appearance of percolating cluster as there is less hindrance from the particles. As we go to lower , the critical value of increases where we observe the formation of percolating network.
The transition from a component gel to bigel happens for different at different values as is obvious from Fig.1. From the results of simulations for all the , we were able to deduce an upper bound when the bigel will appear in the system,
| (1) |
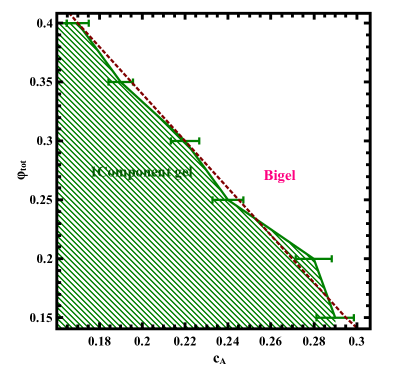
which also happens to be the maximum packing fraction for spheres. is the free space available in a randomly distributed spheres arrangement at a particular for the particles. When the free volume available for the particles is approximately equal to half the volume of a sphere , we observe that bigel start to appear in our system, as shown by the dashed line in Fig.1. When this fraction is less than one, the particles do not have enough space to diffuse and aggregate inside the pores of percolated cluster resulting in the formation of component gel. For very low this relation may not be exactly followed and we may observe the appearance of bigel for . This is because the clusters can diffuse through the system as well as aggregate much more freely than for the higher , thereby equation 1 only giving us an upper bound for the appearance of bigel.
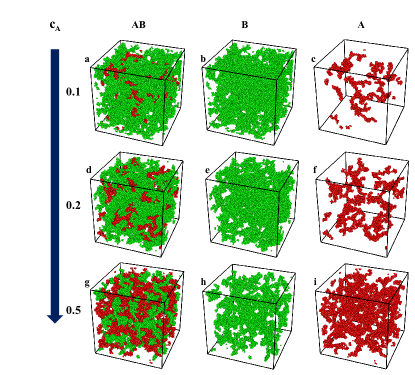
In Fig.2 we have shown snapshots of binary system for different as indicated on the left side of the figure for . The red colored spheres represent particle and green colored spheres represent particles. All the snapshot have been taken at a time when the aggregation kinetics of the system have stopped evolving. In Fig.2a we have shown both and particle as it appear in the system for , evident from the fewer red particles seen in the system. In Fig.2b we have kept only the particle , where we observe the presence of a single system spanning cluster, with thick tenuous branch. In Fig.2c we have shown only the particle for the same system which are forming fractal like clusters distributed over the entire box. These small clusters are not able to aggregate further as they are stuck in the pores of percolating cluster. In Fig.2d we are showing both the particle for , where we are closer to the critical point of particles, when it starts to percolate. In Fig.2e we have shown only the particle, where we observe that the gel of the looks much more open than in the case of Fig.2b. As the number of particles is smaller than the previous system, the percolating cluster formed is at a lower volume fraction of particles. In the case of particles for the same we observe the presence of one very large cluster as well as smaller clusters distributed over the entire box. As we are close to the critical point we are able to observe clusters with thin tenuous branches for the case of particles. The smaller clusters will never be able to form part of the percolating cluster as they are stuck inside the cluster. For the case of we are having the same number of and particle and both are forming independent system spanning clusters which are inter penetrating among each other see Fig.2g. In Fig.2h the percolating cluster are much more open than the previous cases as the percolating cluster is for a smaller number of particles compared to the earlier cases. The particles for are able to form percolating cluster with thicker strands and all the particles are now part of one single percolating cluster see Fig.2i.
III.2 Kinetics of the particles
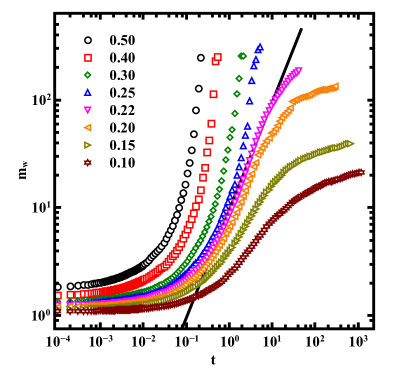
For studying the kinetics of aggregation we have calculated the mass average aggregation number of the particles as a function of time for a range of at see Fig.3. For we observe that diverges, indicating the formation of percolating cluster. For higher fraction diverges faster as there are more particles of species present in the system as well as cluster becomes much more open, thereby species will percolate faster. When we observe that grows for some time and then it stagnates, the reason being that the clusters are getting stuck inside the percolating cluster. We know that in the flocculation limit the kinetics of DLCA type aggregation is very well explained by the Smoluchowski’s rate equation where for the monomeric system Von Smoluchowski (1917); Chandrasekhar (1943). The solid line in Fig.3 has a slope of , which is followed by all the fraction of in the flocculation limit. For we observe that the diverges from the slope of , a signature of the formation of percolating cluster for the particles. For we observe that deviates to a smaller slope and at a later time approaches a stationary value indicating that particles are aggregating inside the cages of the clusters. As decreases the stationary value of also decreases as there is less space available for the particles to aggregate because of the increased fraction of particles. Although Smoluchowski approach is not valid in the percolation regime, as the clusters interpenetrate in this limitGimel et al. (1995), we observe that for the present work it is valid up to the critical point. As clusters are caged inside the percolating cluster, the inter penetration of clusters will be at a minimum which could be one possible reason why the clusters follow the Smoluchowski equation even close to the percolation limit.
III.3 Kinetics of monomeric and binary system
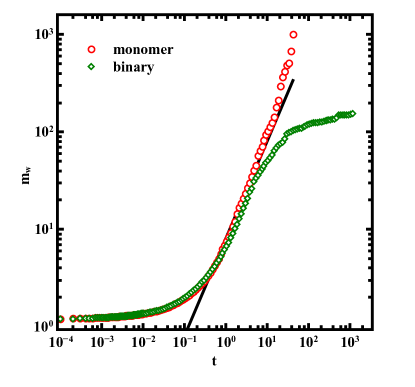
It has already been shown that for monomeric system we will always form percolating cluster irrespective of the volume fractionGimel et al. (1995). In Fig.4 we have shown the evolution of for only particles when at and for the monomeric system the volume fraction is the same as that for only particles in the system. For the initial time we observe the aggregation kinetics is following each other closely for the monomeric and binary case, as the monomers involved have displaced only approximately its own diameter. For we observe that the kinetics of aggregation for the binary system falls below a slope of . While for the volume fraction the aggregation goes on with the slope , which is expected from Smoluchowski approach. For the monomeric case deviate from a slope of unity for indicating the system have started to interpenetrate and later percolates at . For the binary case approaches a stationary value see Fig.4. For all the volume fraction the monomeric case will form a percolating network while for the binary case the particles will form a percolating network only above a critical fraction for a particular .
III.4 Fractal dimension of binary system
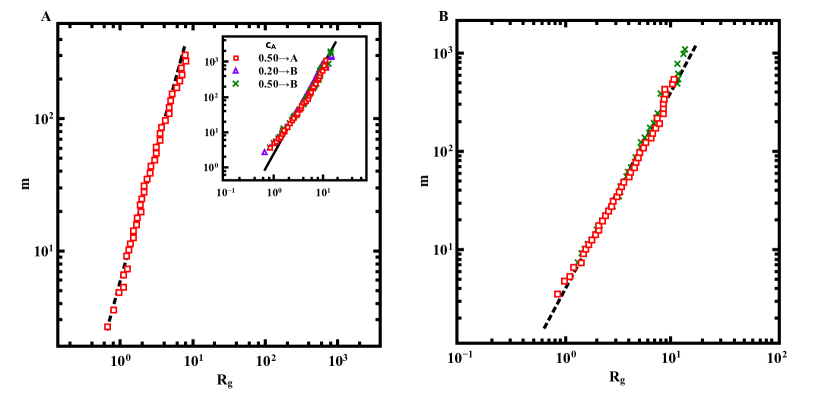
For monomeric DLCA type aggregation we know that there is a transition from flocculation regime to percolation regime, characterized by the change in fractal dimension from to Gimel et al. (1995). In Fig.5a we plot the aggregation number with the radius of gyration () of the clusters when attains a stationary value. The dotted line in Fig.5a has a slope of , showing that the aggregation of cluster inside the cage of percolating cluster are self similar in nature with a . In the inset of Fig.5a we have shown and of both and particles for (triangle) and (square for particles and cross for particles) before the system percolates. At particles are forming clusters and for both and species are forming self similar structure and have crossed over to the percolation regimes as shown in the inset of Fig.5a by the solid line which has a slope of . Usually is reported in reversible aggregation of colloids as well as during the formation of lattice animals Aubert and Cannell (1986); Schaefer et al. (1984). According to the percolation theory lattice animals appear far away from the percolation transition. Due to the presence of the species of particles there are many collisions between and particles, which do not lead to bond formation as they interact only through hard core repulsion. The clusters so formed are able to densify before a collision between same species happens leading to bond formation. This also leads to the conclusion that if species are undergoing irreversible aggregation, it leads to self similar clusters where all the configuration for a given aggregation number is equi-probable for both species of particles Wessel and Ball (1993)in the flocculation regime. If the structure of the particles are influenced by the hindrance caused by the particles, we should be able to observe the same effect for the particles. This effect will be most evident when we have , as we have same number of and particles. In Fig.5b we have plotted and for the case of for the and in the initial stages of aggregation, where our system will still be in the flocculation regime. The solid line has a slope of , which confirms the fact that for both and particles in flocculation regime have a . In the present case we were able to show that in the flocculation regime we have a , which will cross over to , as predicted by the percolation theory irrespective of type of particle. While in the case of particles when reaches a stationary value, it will always remain as lattice animals irrespective of
III.5 Scaling relation for binary system
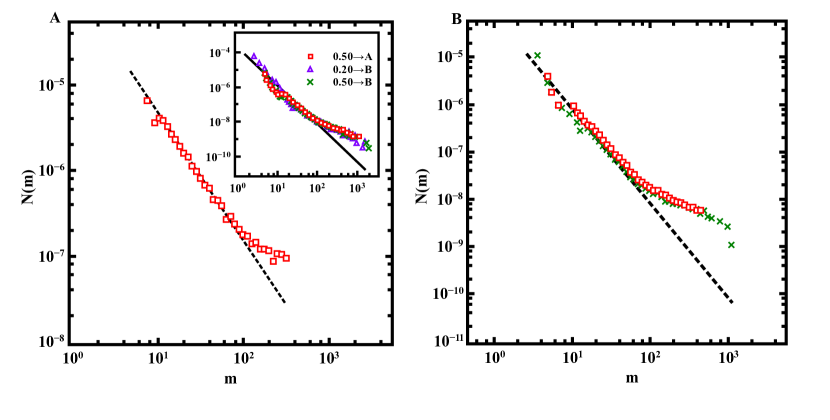
Conventional DLCA is characterized by for in the flocculation regime, for lattice animals we have and , while in the percolation limit for as where the exponent are supposed to be exact Stauffer and Aharony (1994). In Fig.6a, we have plotted as a function for at for the clusters, where attains a stationary value or in other words particles cannot percolate. The dotted line is given by a slope of , as predicted for lattice animals by the percolation theory. While in the inset we have plotted with for particles when , also for both and particles at also see inset Fig.5a. The solid line which has a slope of , which agrees with the fact that this system is already in the percolation regime. Also it shows that we have a cross over for the binary system from lattice animals to percolation regime. In Fig.6b we have plotted with for at both for and particles during the initial stages of aggregation process. The dotted line has a slope of confirming the fact that both and have a fractal dimension of , contrary to the fact that in the flocculation regime for DLCA we have . This we believe is a direct evidence that we are observing lattice animals in our system in the case when clusters are in the flocculation regime.
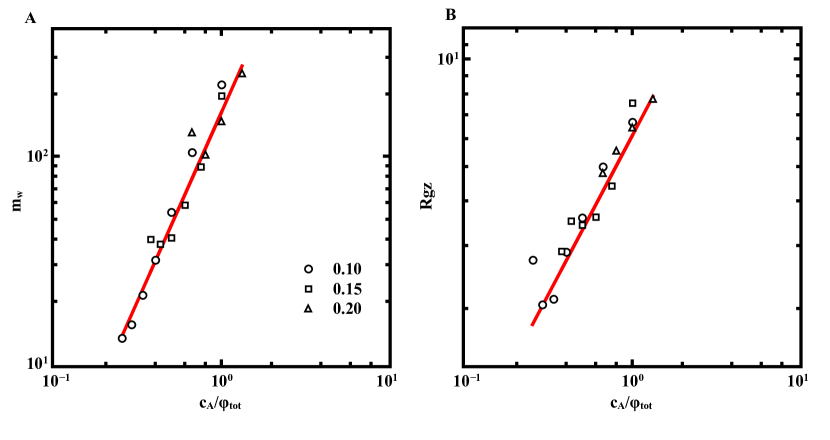
In Fig.7 we have plotted the stationary value of for the particles as a function of for a range of for three different as indicated in the figure. It seems that is the parameter that determines the variation of stationary value of once particles are stuck inside the pores of particles. In the Fig.3 we observe that as we go towards the percolation transition the stationary value of or the compressibility of the system keeps on increasing till we have an infinite spanning network or in other words diverges. We also observe that scales with with a slope of see solid line in Fig.7a. It is a well established fact that below the critical value according to percolation theory. This gives us a clear indication that if we consider , may be is the critical parameter for irreversible aggregation of binary system. We know that percolation theory predicts that the correlation length scale with were below the percolation threshold. It has already been shown that , where Stauffer (1979). In Fig.7b we have plotted with and the solid line is given by the slope of , which is in agreement with the percolation theory. In Fig.7 compressibility and correlation length are showing universal behavior when plotted as function of with the scaling law predicted by percolation theory, where by we can confirm that irreversible binary system comes under the universality class of percolation.
IV Discussion
Hecht et. al have analyzed the fractal dimension of binary aggregating colloidal particle, where they have reported a , which is predicted for component DLCA Hecht and Bausch (2016). With the experimental data of and , they have reported it is very difficult to differentiate a slope of and . Unfortunately they have not calculated as a function of , which we believe will give much more precise value of , as shown in the present study. In the present work both the particles start aggregating simultaneously, while in the experimental case the aggregation of and particle starts at different times. It has already been shown that compared to a random distribution an aggregated system have more free space Babu et al. (2008b). Thus we believe that the diffusion and the kinetics of the system may be different, but there should not be much difference in the final structure of these systems.
The appearance of bigel have also been reported by Varrato et. al, in reversible aggregation of binary colloidal system. They have reported distinct region, where both and percolated, only percolated and region where neither or percolated. In our case we only have regions bigel or component gel, as expected from irreversible aggregation. For our results are similar with the results of Varrato et. al, but for they have reported much higher than what we have observed in our system. In the case of reversible aggregation it was shown that for low volume fraction only high attraction strength could mimic irreversible aggregation Babu et al. (2006). For smaller attraction the system undergoes spinodal decomposition for the particles, while the fraction of densifies which will require a higher fraction in order to percolate.
In the present work we have shown that by controlling and we are able to produce self similar clusters of particular size for the particles there by controlling the pore size of . This result can help in creation of new functional materials of a particular size simply by controlling the pores size created by the particles Liu and Lu (2006). It will be interesting to further extend this study to include asymmetric particles, and study how the porosity of the corresponding gel varies.
Acknowledgements.
References
- Mezzenga and Fischer (2013) R. Mezzenga and P. Fischer, Reports on Progress in Physics 76, 046601 (2013).
- Zaccarelli (2007) E. Zaccarelli, Journal of Physics: Condensed Matter 19, 323101 (2007).
- Hecht and Bausch (2016) F. M. Hecht and A. R. Bausch, Proceedings of the National Academy of Sciences , 201605114 (2016).
- Blumlein and McManus (2015) A. Blumlein and J. J. McManus, Journal of Materials Chemistry B 3, 3429 (2015).
- Varrato et al. (2012) F. Varrato, L. Di Michele, M. Belushkin, N. Dorsaz, S. H. Nathan, E. Eiser, and G. Foffi, 109, 19155 (2012).
- Boles et al. (2016) M. A. Boles, M. Engel, and D. V. Talapin, Chemical Reviews (2016).
- Duguet et al. (2011) E. Duguet, A. Désert, A. Perro, and S. Ravaine, Chemical Society Reviews 40, 941 (2011).
- Stauffer (1979) D. Stauffer, Physics reports 54, 1 (1979).
- Meakin (1983) P. Meakin, Physical Review Letters 51, 1119 (1983).
- Botet et al. (1984) R. Botet, R. Jullien, and M. Kolb, Journal of Physics A: Mathematical and General 17, L75 (1984).
- Klein and Meakin (1989) R. Klein and P. Meakin, Nature 339 (1989).
- Orrite et al. (2005) S. D. Orrite, S. Stoll, and P. Schurtenberger, Soft Matter 1, 364 (2005).
- Lu and Weitz (2013) P. J. Lu and D. A. Weitz, Annu. Rev. Condens. Matter Phys. 4, 217 (2013).
- Weitz et al. (1985) D. Weitz, J. Huang, M. Lin, and J. Sung, Physical review letters 54, 1416 (1985).
- Kohl et al. (2016) M. Kohl, R. Capellmann, M. Laurati, S. Egelhaaf, and M. Schmiedeberg, Nature Communications 7 (2016).
- de Las Heras et al. (2012) D. de Las Heras, J. M. Tavares, and M. M. T. da Gama, Soft Matter 8, 1785 (2012).
- Klymenko et al. (2014) A. Klymenko, T. Nicolai, L. Benyahia, C. Chassenieux, O. Colombani, and E. Nicol, Macromolecules 47, 8386 (2014).
- Babu et al. (2008a) S. Babu, J.-C. Gimel, T. Nicolai, and C. De Michele, The Journal of chemical physics 128, 204504 (2008a).
- Rottereau et al. (2005) M. Rottereau, J. C. Gimel, T. Nicolai, and D. Durand, The European Physical Journal E 18, 15 (2005).
- Rouse Jr (1953) P. E. Rouse Jr, The Journal of Chemical Physics 21, 1272 (1953).
- Zimm (1956) B. H. Zimm, The journal of chemical physics 24, 269 (1956).
- Von Smoluchowski (1917) M. Von Smoluchowski, Z. Physik. Chem 92, 129 (1917).
- Chandrasekhar (1943) S. Chandrasekhar, Reviews of modern physics 15, 1 (1943).
- Gimel et al. (1995) J. C. Gimel, D. Durand, and T. Nicolai, Physical Review B 51, 11348 (1995).
- Aubert and Cannell (1986) C. Aubert and D. S. Cannell, Physical review letters 56, 738 (1986).
- Schaefer et al. (1984) D. W. Schaefer, J. E. Martin, P. Wiltzius, and D. S. Cannell, Physical Review Letters 52, 2371 (1984).
- Wessel and Ball (1993) R. Wessel and R. Ball, Journal of Physics A: Mathematical and General 26, L159 (1993).
- Stauffer and Aharony (1994) D. Stauffer and A. Aharony, Introduction to percolation theory (CRC press, 1994).
- Babu et al. (2008b) S. Babu, J. C. Gimel, and T. Nicolai, The Journal of Physical Chemistry B 112, 743 (2008b).
- Babu et al. (2006) S. Babu, J. C. Gimel, and T. Nicolai, The Journal of chemical physics 125, 184512 (2006).
- Liu and Lu (2006) J. Liu and Y. Lu, Advanced Materials 18, 1667 (2006).