Measurement of the spin temperature of optically cooled nuclei and GaAs hyperfine constants in GaAs/AlGaAs quantum dots
Deep cooling of electron and nuclear spins is equivalent to achieving polarization degrees close to 100% and is a key requirement in solid state quantum information technologies 1, 2, 3, 4, 5, 6. While polarization of individual nuclear spins in diamond 2 and SiC 3 reaches 99% and beyond, it has been limited to 60-65% for the nuclei in quantum dots 7, 12. Theoretical models have attributed this limit to formation of coherent ”dark” nuclear spin states 9, 10, 11 but experimental verification is lacking, especially due to the poor accuracy of polarization degree measurements. Here we measure the nuclear polarization in GaAs/AlGaAs quantum dots with high accuracy using a new approach enabled by manipulation of the nuclear spin states with radiofrequency pulses. Polarizations up to 80% are observed – the highest reported so far for optical cooling in quantum dots. This value is still not limited by nuclear coherence effects. Instead we find that optically cooled nuclei are well described within a classical spin temperature framework 12. Our findings unlock a route for further progress towards quantum dot electron spin qubits where deep cooling of the mesoscopic nuclear spin ensemble is used to achieve long qubit coherence 6, 5. Moreover, GaAs hyperfine material constants are measured here experimentally for the first time.
Optically active III-V semiconductors quantum dots are considered for applications in quantum information technologies and have major advantages, such as versatile device fabrication techniques and strong interaction between charge spin and light 13. However, magnetic coupling with the randomly polarized nuclei of the quantum dot, makes the spin state of the electron vulnerable to dephasing and decoherence 14, 15. Improvement of the electron spin coherence by preparing the nuclear spin ensemble in a ”narrowed” state 6, 5, 16 has been demonstrated experimentally 11, 18, 19. However, the actual microscopic nature of the nuclear spin bath state remains unknown. Moreover, the ultimately ”narrowed”, fully polarized nuclear spin state not only has not been achieved, but it has been difficult to identify the obstacles to such 100% polarization. The complexity of the problem arises from the mesoscopic nature of the nuclear spin bath of a quantum dot: the typical number of spins is too large to access each individual nucleus, yet too small to ignore quantum correlations, coherence and fluctuations 9, 10, 11, 5. The problem is complicated further by inhomogeneity of the electron-nuclear interaction within the quantum dot volume.
In quantum wells and dots the degree of nuclear spin polarization was previously estimated 20, 7 by measuring the resulting hyperfine shift , which is the change in the energy splitting of the 1/2 electron spin levels. The shift produced by each nuclear isotope is:
| (1) |
where is the nuclear spin, is the hyperfine constant characterizing the isotope and material only, and is a factor () describing the spatial non-uniformities of the nuclear polarization, electron envelope wavefunction, and chemical composition in a specific quantum dot structure. While can be measured very accurately, the uncertainty in and , leads to uncertainty in . Here we demonstrate measurement of not relying on assumptions about and , but based on direct mapping of the spin-3/2 eigenstate populations. We then estimate from the first-principles calculations and measurements on quantum dots of different size which allows Eq. 1 to be factorised and the hyperfine constants to be derived accurately. Notably, despite GaAs being one of the most important semiconductors, its hyperfine material constants have not yet been measured experimentally, but only estimated 21 using the hyperfine constants of InSb obtained more than five decades ago 22.
We achieve % corresponding to spin temperature mK at a bath temperature of K. The observed exceeds the predicted values for the quantum limit for nuclear spin cooling 10, 11. Furthermore, we have implemented the proposed protocols where electron-nuclear coupling is ”modulated” during optical cooling 9, 10 but observed no increase in , ruling out coherent ”dark” nuclear spin states as a single fundamental obstacle. Instead we expect the currently achieved to be limited by competing contributions of nuclear spin pumping and depolarization mechanisms – with a further effort in designing the nuclear spin cooling protocol these obstacles can be overcome, potentially opening the way for achieving nuclear polarizations close to 100%.
We study GaAs/AlGaAs quantum dots (QDs) grown by in-situ nanohole etching and filling 1. A schematic cross-section of such a QD is shown in Fig. 1a. An individual electron with spin =1/2 (blue) can be trapped in a QD typically consisting of atoms (green), each possessing a nuclear spin =3/2 for gallium and arsenic, or =5/2 for aluminium. The electron-nuclear magnetic interaction (known as the hyperfine interaction) has a dual effect. Firstly, spin polarized electrons injected repeatedly into a QD via optical excitation can exchange spin with the nuclei (flip-flop process) resulting in nuclear spin cooling (also referred to as dynamic nuclear polarization, or DNP) 7, 12. Secondly, the net nuclear polarization produces a hyperfine shift in the electron spin state energy splitting. Such shifts are detected optically in the luminescence spectrum of a QD and are used to probe the nuclear polarization 7, 12. (Further details on samples and experimental techniques can be found in Methods and Supplementary Notes 1 and 2.)
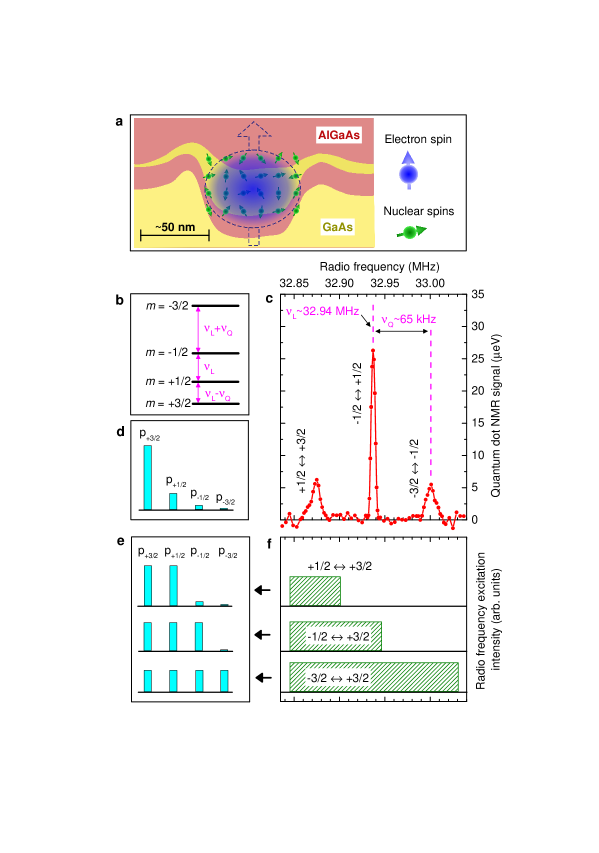
All experiments are performed at =4.2 K and magnetic field T along the sample growth axis (). Under such conditions the nuclear spin states have well-defined projections along the -axis. The structure of the nuclear spin energy levels is sketched in Fig. 1b: magnetic field induces Zeeman shifts ( is Planck’s constant), so that the frequencies of all dipole-allowed transitions equal the Larmor frequency , where is the nuclear gyromagnetic ratio. Strain induced quadrupolar effects give rise to small additional shifts leading to a triplet of dipole-allowed transitions with splitting . The frequencies of the dipole-allowed transitions are probed by measuring the NMR spectrum as shown in Fig. 1c: for a typical individual dot B1 we find MHz and kHz for 75As nuclei at T. Two features of the nuclear spin spectrum are important for this work: (i) in a wide range of magnetic fields, so that the nuclear spin levels are nearly equidistant allowing straightforward use of the nuclear spin temperature concept 12, (ii) the NMR triplet is well resolved, providing access to individual spin transitions and eventually allowing the spin temperature to be measured.
The collective state of the nuclear spin bath induced via optical cooling can be characterized by the population probabilities of the levels with nuclear spin projections . In thermal equilibrium the system is described by the canonical Boltzmann distribution:
| (2) |
where dimensionless inverse temperature is introduced and is the Boltzmann constant. For spin =1/2 any statistical distribution is described by Eq. 2 with some . However, for 1/2 the nuclear spin temperature hypothesis of Eq. 2 is a non-trivial statement implying existence of equilibration mechanisms which in turn require sufficiently ”complex” interactions that can couple all states of the system leaving the total energy as the only constant of motion 12. The polarization degree
| (3) |
is uniquely related to and when are given by Eq. 2. An example of a Boltzmann distribution corresponding to % is sketched in Fig. 1d for =3/2: most nuclei are in a state with less than 2% occupying the state.
Probing is achieved by their manipulation with radio-frequency (rf) pulses as demonstrated in Figs. 1e,f. This is possible since the optically-detected hyperfine shift depends on and hence on (Eqs. 1, 3). When, for example, a long rf pulse with a rectangular spectrum exciting selectively the NMR transition [Fig. 1f top] is applied, the and populations are equalized [Fig. 1e top] becoming . The resulting change in hyperfine shift is . Similarly, by saturating any NMR transition it is possible to find the corresponding difference (see Methods). Simultaneous saturation of two transitions [Figs. 1e,f middle] reveals the differences, while saturation of all three transitions [Figs. 1e,f bottom] yields the hyperfine shift variation proportional to the polarization degree . Thus the statistical distribution can be reconstructed from the optically detected hyperfine shifts induced by selective manipulation of with rf pulses.
Experimental probing of the nuclear spin populations is demonstrated in Fig. 2a for 75As nuclei in quantum dot B1. After optical cooling with light of a variable circular polarization degree, nuclear spin transitions are saturated selectively with rf. The resulting changes in hyperfine shifts are shown by the symbols as a function of the total 75As hyperfine shift variation. At large positive or negative , the signal is distinctly larger than . Such difference is even more pronounced in the shifts (Fig. 2b) and implies , which is a clear evidence that large, comparable to unity is induced via optical cooling: indeed, in the high temperature limit of Boltzmann distribution (large in Eq. 2 and small ), the probabilities depend linearly on and all the differences must be equal.
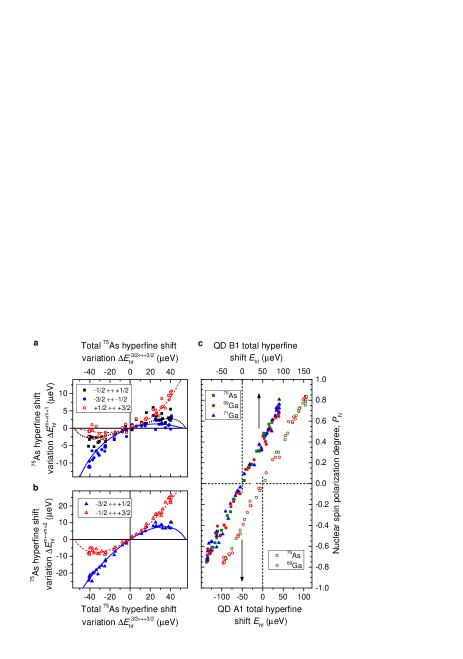
For quantitative analysis we assume the spin temperature hypothesis (Eq. 2) so that any rf induced hyperfine shift variation is expressed in terms of and (see Methods). By varying from to we obtain parametric plots of all as a function of with the product used as the sole fitting parameter. For quantum dot B1 all five model curves (shown by the lines in Figs. 2a,b) are in good agreement with experiment for eV. This confirms that the nuclear spin state produced by optical cooling is described by a nuclear spin temperature , the smallest achieved absolute temperature is found to be mK.
The measurements of Fig. 2b were repeated on different isotopes in several quantum dots each time in good agreement with the spin temperature hypothesis. With derived from fitting, the nuclear spin polarization degree can be obtained as for each experimental point. Fig. 2c (top scale) shows of 75As, 69Ga and 71Ga as a function of the total hyperfine shift produced by all isotopes in dot B1. Similar results for another quantum dot (A1) are shown as well (bottom scale). up to 80% is achieved and to our knowledge is the largest reported for III-V quantum dots. Two factors are at play here. (i) The efficiency of nuclear spin cooling in the studied GaAs/AlGaAs nanohole dots is somewhat higher than in the previous studies: for example, the total Overhauser shifts eV observed here and corresponding to 80% can be directly compared to eV observed in GaAs/AlGaAs fluctuation dots 7. (ii) What is more important, our measurement of does not depend on the uncertainties in hyperfine constants and dot structural parameter – it is likely that was underestimated in all earlier studies.
From Fig. 2(c) we find that optical cooling produces the same for all isotopes. Since the Larmor frequencies of the isotopes are significantly different (a factor of 1.78 for 71Ga and 75As) their spin temperatures are different too. In other words, optical cooling leaves the Zeeman reservoir of each isotope in a state of internal thermal equilibrium, but out of equilibrium with other isotopes. Detailed measurements conducted on Ga and As isotopes of several quantum dots in the range T suggest that while varies, the inverse spin temperature is invariant for the given optical pumping conditions (with maximum corresponding to ). This can be understood assuming that optical cooling of the nuclei arises purely from the hyperfine induced flip-flop processes where the change in the electron spin projection by is accompanied by a change in the nuclear spin projection . Furthermore, each nucleus behaves independently interacting only with the electron spin 10, 25, leading to an invariant nuclear determined only by the properties of the spin polarized electrons. From the thermodynamics perspective, the isotopic difference in can be seen to result from the insufficient ”complexity” of the electron-nuclear flip-flop process: in particular it does not provide enough interaction pathways to equilibrate the Zeeman reservoirs of different isotopes.
The above findings are contrary to the theoretical predictions that quantum coherence between different nuclei gives rise to so-called nuclear dark states, limiting the maximum achievable in quantum dots 9, 10, 11. It has been proposed that small perturbations of the electron wavefunction must be sufficient to disrupt the dark states and enable further nuclear spin cooling 9, 10. We have performed experiments where the electron-nuclear spin system is perturbed by periodically interrupting the optical pumping (which empties the dot) for periods up to 120 ms that are much longer than the nuclear spin coherence times ms 5 and are thus sufficient for the nuclei to dephase. However no effect of interruption was found suggesting that nuclear dark states are not a limiting factor for achieving up to 80%. We argue that the optical cooling process already has a natural mechanism disrupting any nuclear spin coherence, for example the fluctuating electron hyperfine Knight field, which prevents dark state formation.
With ”dark” nuclear states ruled out for the studied structures, it is important to understand what limits at 80% and hence find a way to achieve 100%. To this end we examine the dependence of on the power and wavelength of the light used to cool the nuclear spins (see Supplementary Note 3). The largest up to % (such as observed in Fig. 2) is achieved by exciting 55 meV above the exciton ground state. Under such conditions, the limitations to may arise from the loss of electron spin polarization during energy relaxation, and competing effects of heavy and light hole excitation 27. Moreover the maximum is observed under optical excitation powers 1000 times larger than the saturation power of the quantum dot photoluminescence, i.e. spin cooling is related to multiexciton complexes rather than the ground state exciton. Under such conditions optically induced nuclear spin relaxation 28 could be a significant limiting factor. By contrast nuclear spin relaxation in the absence of optical excitation is found to be slow (500 s) 10 and can be ruled out as a limitation to . Further experimental and theoretical studies are needed to disentangle the role of the various effects, in particular explaining why nuclear spin cooling turns out to be most efficient at surprisingly high optical powers and excess photon energies.
We finally turn to derivation of the GaAs hyperfine constants, which are defined as 22, 21
| (4) |
where is the free electron g-factor, is magnetic constant, is Bohr magneton, , and the electron wavefunction density at the nucleus of the corresponding isotope is the only parameter characterizing GaAs as a material. By definition, when nuclei with spin are 100% abundant and fully polarized () the electron hyperfine shift is regardless of the electron envelope wavefunction 21. However, the effective hyperfine constant obtained from experiment is reduced by a factor which is a product of the isotope natural abundance , molar fraction and a further factor describing the non-uniformities of the nuclear polarization and electron envelope wavefunction.
In order to estimate we study dots with different localization energy. We find that of the dots with deeper confining potential (emitting at 1.58 eV) is larger by a factor 1.09 than for the dots with weaker confinement (emitting at 1.63 eV). Such a difference can be explained if we assume that optical cooling produces uniform nuclear polarization within the GaAs quantum dot volume while the nuclei of the AlGaAs barrier remain nearly unpolarized () due to the quadrupolar induced suppression of spin diffusion at the GaAs/AlGaAs interface 10. In such case , where is the portion of the electron density within GaAs. Solving the Schrodinger’s equation we find for dots emitting at 1.58 eV and for dots emitting at 1.63 eV (see Supplementary Note 4). The ratio of the calculated values is 1.07 in agreement with the 1.09 ratio of the measured , confirming the assumption that outside the dot and within the dot. Using these values we correct and for each studied dot and after averaging we finally obtain the 95%-confidence estimates =(9.250.20)1031 m-3 and =(6.570.25)1031 m-3. The corresponding hyperfine constants are =43.50.9 eV (75As), =43.11.6 eV (69Ga), and =54.82.1 eV (71Ga). Our experimental values for generally agree with the original estimates of Paget et al. 21 based on the studies on InSb 22. On the other hand the ratio which has the highest accuracy as it does not depended on assumptions about is somewhat smaller than 1.69, based on the estimates in Ref. 21.
In conclusion, we have demonstrated a direct measurement of the temperature of the nuclear spin Zeeman reservoir in weakly strained quantum dots where individual NMR transitions are well resolved. While NMR transitions can not be fully resolved in self-assembled dots due to the strain inhomogeneity 2, the techniques developed here can be applied to the weakly broadened subensemble providing a way to explore mesoscopic nuclear spin thermodynamics both in high magnetic fields as studied here, and in low fields where the spin temperature concept does not apply to the full spin 3/2 or 9/2 manifolds 30. Nuclear polarizations up to 80% are achieved and are still not limited by the nuclear coherence effects. We expect that techniques for monitoring the state of the nuclear spin bath reported here will stimulate further effort towards initializing the mesoscopic nuclear spin bath in a highly polarized state. Both experimental and theoretical work would be needed to understand the detailed role of various factors limiting the nuclear polarization as well as engineering quantum dot structures and protocols allowing for maximal nuclear spin cooling efficiency.
I Methods
Experimental techniques. We use neutral quantum dots, i.e. without optical excitation the dots are empty. In all measurements we use the Optical cooling - rf depolarization - Optical readout protocol described previously in detail 2, 5. The rf depolarization is performed in the absence of optical excitation. The role of the short optical probe pulse is to excite photoluminescence whose spectrum is then analyzed with a double spectrometer and a CCD camera.
Photoluminescence of a neutral QD results from recombination of an electron with spin up () or down () and a hole with spin up () or down () along the sample growth direction ( axis). We observe emission of both the ”bright” excitons , and ”dark” excitons , that gain oscillator strength from the bright states due to the reduced quantum dot symmetry.
The net nuclear spin polarization shifts the energies of the exciton states. The shifts are dominated by the sign of the electron spin projection, they are for and states, and for and states. In order to determine accurately we measure the energy difference of the and bright and dark states (or of the and dark and bright states). In this way we eliminate any contribution of the hole hyperfine interaction, as well as any simultaneous shifts of all exciton states arising e.g. from charge fluctuations in the dot vicinity.
Relation between the nuclear spin population probabilities and the optically detected hyperfine shifts. In experiments we use long and weak (no Rabi oscillations) radio frequency (rf) excitation. If rf is resonant with the NMR transition between states and its effect is to change and equalize the populations of these states so that , while population probabilities of all other nuclear spin states remain unchanged. One can then use Eqs 1 and 3 to calculated the change in the optically detected hyperfine shift arising from such manipulation of . For example for and we calculate as follows: , i.e. the hyperfine shift depends only on the difference in the initial populations of the states excited with rf.
In a similar way, simultaneous saturation of the NMR transitions and leads to the following redistribution of the populations: . Saturation of all 3 NMR transition of spin =3/2 nuclei leads to , where the last equality is due to normalization . Using Eqs. 1, 3 we evaluate the changes in the hyperfine shift for each case:
| (5) |
The last expression in each of these equations is obtained by substituting the Boltzmann distribution (Eq. 2).
Unlike and , the variation is a monotonic function of with . It is thus possible to express in terms of and then substitute it into expressions for and , eliminating . Since there is no analytical solution we do this by making parametric plots of and as a function of such as shown in Figs. 2a,b by the lines. The product is an overall scaling factor used as a parameter to fit the experimental data. One can see that such fitting can be achieved reliably only because large is reached in experiment: only then there are pronounced asymmetries and nonlinearities in the and dependencies (observed in Figs. 2a,b). By contrast, in the high temperature limit (, ) Eq. 5 yields linear dependencies , independent of , so that experiment can be described with any , making fitting impossible.
Once is obtained from fitting, one can use the last of Eq. 5 to uniquely relate the experimentally measured , and the quantities of interest such as polarization degree , the inverse temperature , and the nuclear spin temperature itself.
ACKNOWLEDGMENTS The authors are grateful to Armando Rastelli (Linz), Yongheng Huo (Hefei) and Andreas Waeber (TU Munich) for fruitful discussions. This work has been supported by the EPSRC Programme Grant EP/J007544/1. E.A.C. was supported by a University of Sheffield Vice-Chancellor’s Fellowship and a Royal Society University Research Fellowship.
References
- 1 Atature, M., Dreiser, J., Badolato, A., Hogele, A., Karrai, K., and Imamoglu, A. Quantum-Dot Spin-State Preparation with Near-Unity Fidelity. Science 312(5773), 551–553 (2006).
- 2 Jacques, V., Neumann, P., Beck, J., Markham, M., Twitchen, D., Meijer, J., Kaiser, F., Balasubramanian, G., Jelezko, F., and Wrachtrup, J. Dynamic polarization of single nuclear spins by optical pumping of nitrogen-vacancy color centers in diamond at room temperature. Phys. Rev. Lett. 102, 057403, (2009).
- 3 Falk, A. L., Klimov, P. V., Ivády, V., Szász, K., Christle, D. J., Koehl, W. F., Gali, A., and Awschalom, D. D. Optical polarization of nuclear spins in silicon carbide. Phys. Rev. Lett. 114, 247603, (2015).
- 4 Pla, J. J., Tan, K. Y., Dehollain, J. P., Lim, W. H., Morton, J. J. L., Zwanenburg, F. A., Jamieson, D. N., Dzurak, A. S., and Morello, A. High-fidelity readout and control of a nuclear spin qubit in silicon. Nature 496, 334–338 (2013).
- 5 Ribeiro, H. and Burkard, G. Nuclear state preparation via Landau-Zener-Stuckelberg transitions in double quantum dots. Phys. Rev. Lett. 102(21), 216802 (2009).
- 6 Schliemann, J., Khaetskii, A. V., and Loss, D. Spin decay and quantum parallelism. Phys. Rev. B 66, 245303, (2002).
- 7 Gammon, D., Efros, A. L., Kennedy, T. A., Rosen, M., Katzer, D. S., Park, D., Brown, S. W., Korenev, V. L., and Merkulov, I. A. Electron and nuclear spin interactions in the optical spectra of single GaAs quantum dots. Phys. Rev. Lett. 86, 5176–5179 (2001).
- 8 Chekhovich, E. A., Makhonin, M. N., Kavokin, K. V., Krysa, A. B., Skolnick, M. S., and Tartakovskii, A. I. Pumping of nuclear spins by optical excitation of spin-forbidden transitions in a quantum dot. Phys. Rev. Lett. 104, 066804 (2010).
- 9 Imamoḡlu, A., Knill, E., Tian, L., and Zoller, P. Optical pumping of quantum-dot nuclear spins. Phys. Rev. Lett. 91, 017402, (2003).
- 10 Christ, H., Cirac, J. I., and Giedke, G. Quantum description of nuclear spin cooling in a quantum dot. Phys. Rev. B 75, 155324, (2007).
- 11 Hildmann, J., Kavousanaki, E., Burkard, G., and Ribeiro, H. Quantum limit for nuclear spin polarization in semiconductor quantum dots. Phys. Rev. B 89, 205302, (2014).
- 12 Goldman, M. Spin temperature and nuclear magnetic resonance in solids. Oxford University Press, Oxford, (1970).
- 13 Ding, X., He, Y., Duan, Z.-C., Gregersen, N., Chen, M.-C., Unsleber, S., Maier, S., Schneider, C., Kamp, M., Höfling, S., Lu, C.-Y., and Pan, J.-W. On-demand single photons with high extraction efficiency and near-unity indistinguishability from a resonantly driven quantum dot in a micropillar. Phys. Rev. Lett. 116, 020401, (2016).
- 14 Bechtold, A., Rauch, D., Li, F., Simmet, T., Ardelt, P.-L., Regler, A., Muller, K., Sinitsyn, N. A., and Finley, J. J. Three-stage decoherence dynamics of an electron spin qubit in an optically active quantum dot. Nature Phys 11, 1005–1008 (2015).
- 15 Press, D., De Greve, K., McMahon, P. L., Ladd, T. D., Friess, B., Schneider, C., Kamp, M., Hofling, S., Forchel, A., and Yamamoto, Y. Ultrafast optical spin echo in a single quantum dot. Nature Photon. 4, 367–370 (2010).
- 16 Barnes, E., Cywiński, L., and Das Sarma, S. Nonperturbative master equation solution of central spin dephasing dynamics. Phys. Rev. Lett. 109, 140403, (2012).
- 17 Latta, C., Högele, A., Zhao, Y., Vamivakas, A. N., Maletinsky, M., Kroner, M., Dreiser, J., Carusotto, I., Badolato, A., Schuh, D., Wegscheider, W., Atatture, M., and Imamoglu, A. Confluence of resonant laser excitation and bidirectional quantum-dot nuclear-spin plarization. Nat Phys 5, 758 – 763 (2009).
- 18 Bluhm, H., Foletti, S., Mahalu, D., Umansky, V., and Yacoby, A. Enhancing the coherence of a spin qubit by operating it as a feedback loop that controls its nuclear spin bath. Phys. Rev. Lett. 105, 216803, (2010).
- 19 Sun, B., Chow, C. M. E., Steel, D. G., Bracker, A. S., Gammon, D., and Sham, L. J. Persistent narrowing of nuclear-spin fluctuations in inas quantum dots using laser excitation. Phys. Rev. Lett. 108, 187401, (2012).
- 20 Dixon, D. C., Wald, K. R., McEuen, P. L., and Melloch, M. R. Dynamic nuclear polarization at the edge of a two-dimensional electron gas. Phys. Rev. B 56, 4743–4750, (1997).
- 21 Paget, D., Lampel, G., Sapoval, B., and Safarov, V. I. Low field electron-nuclear spin coupling in gallium arsenide under optical pumping conditions. Phys. Rev. B 15, 5780–5796, (1977).
- 22 Gueron, M. Density of the conduction electrons at the nuclei in indium antimonide. Phys. Rev. 135, A200–A205, (1964).
- 23 Atkinson, P., Zallo, E., and Schmidt, O. G. Independent wavelength and density control of uniform GaAs/AlGaAs quantum dots grown by infilling self-assembled nanoholes. J. Appl. Phys. 112(5), 054303 (2012).
- 24 Chekhovich, E. A., Kavokin, K. V., Puebla, J., Krysa, A. B., Hopkinson, M., Andreev, A. D., Sanchez, A. M., Beanland, R., Skolnick, M. S., and Tartakovskii, A. I. Structural analysis of strained quantum dots using nuclear magnetic resonance. Nature Nanotech. 7, 646–650 (2012).
- 25 D’Yakonov, M. I. and Perel, V. I. Optical orientation in a system of electrons and lattice nuclei in semiconductors. theory. Sov. Phys. JETP 38, 177 (1974).
- 26 Chekhovich, E. A., Hopkinson, M., Skolnick, M. S., and Tartakovskii, A. I. Suppression of nuclear spin bath fluctuations in self-assembled quantum dots induced by inhomogeneous strain. Nat Commun 6, 6348 (2015).
- 27 Sesti, E. L., Wheeler, D. D., Hayes, S. E., Saha, D., Sanders, G. D., and Stanton, C. J. Assignments of transitions in optically-pumped nmr of GaAs/AlGaAs quantum wells on a bulk GaAs substrate. Phys. Rev. B 90, 125301, (2014).
- 28 Paget, D., Amand, T., and Korb, J.-P. Light-induced nuclear quadrupolar relaxation in semiconductors. Phys. Rev. B 77, 245201,(2008).
- 29 Ulhaq, A., Duan, Q., Zallo, E., Ding, F., Schmidt, O. G., Tartakovskii, A. I., Skolnick, M. S., and Chekhovich, E. A. Vanishing electron factor and long-lived nuclear spin polarization in weakly strained nanohole-filled GaAs/AlGaAs quantum dots. Phys. Rev. B 93, 165306, (2016).
- 30 Maletinsky, P., Kroner, M., and Imamoglu, A. Breakdown of the nuclear-spin-temperature approach in quantum-dot demagnetization experiments. Nat Phys 5, 407 – 411 (2009).
SUPPLEMENTARY INFORMATION
Supplementary Note 1 Sample structure.
The sample growth process has been reported in detail previously1. Here we give a brief description.
The nanohole filled droplet epitaxial quantum dot sample is grown via solid molecular beam epitaxy (MBE). The GaAs buffer layer is first grown and is followed by deposition of 11 monolayers of Ga at C forming Ga droplets. The droplets are then annealed under As flux resulting in crystallization and eventual formation of nanoholes due to As dissolution and Ga diffusion. The holes are then filled by depositing nm of Al0.44Ga0.56As forming the bottom barrier. This is followed by deposition of nm of GaAs. Due to the difference in migration rates of Ga and Al, GaAs redistributes towards the bottom of the nanohole. Such ”in-filling” of the nanoholes results in formation of inverted QDs. Finally the dots are capped by a nm Al0.33Ga0.67As top barrier and nm GaAs layer.
Supplementary Note 2 Optical detection of the hyperfine shifts.
In all nuclear spin cooling experiments we use Optical pump - rf depolarization - Optical probe protocol which has been described in detail previously 2, 3, 4, 5, 6.
Optical pumping is implemented using Ti:Sap laser emission of a variable wavelength and power. The largest nuclear spin polarization % is achieved at excitation power of W and photon energy of 1.63 eV for quantum dots emitting at 1.58 eV and at a photon energy of 1.645 eV for quantum dots emitting at 1.63 eV (see further discussion in Supplementary Note 3). The duration of the optical pump is typically s, sufficiently long to induce a steady state nuclear spin polarization. A combination of a half-wave and a quarter-wave plates is used to control the degree of circular polarization of the pump laser from -1 to +1 (polarization is varied from to through intermediate elliptical polarizations): in this way the nuclear spin polarization degree could be controlled gradually between its maximum negative and positive values as shown in Fig. 2c of the main text.
Selective depolarization of the nuclei is achieved by applying radio frequency oscillating magnetic field with rectangular spectral profile as shown in Fig. 1f of the main text. Such rectangular bands are constructed from frequency combs with comb spacing Hz much smaller than the homogeneous NMR linewidths, so that the combs are equivalent to white noise 6. Typical depolarization time is s.
After rf depolarization, a HeNe (632.8 nm) probe laser pulse is used to excite quantum dot photoluminescence (PL). The duration of the probe is typically ms and is chosen short enough to minimize its effect on the nuclear spin polarization. Exemplary probe PL spectra are shown in Supplementary Fig. 1.
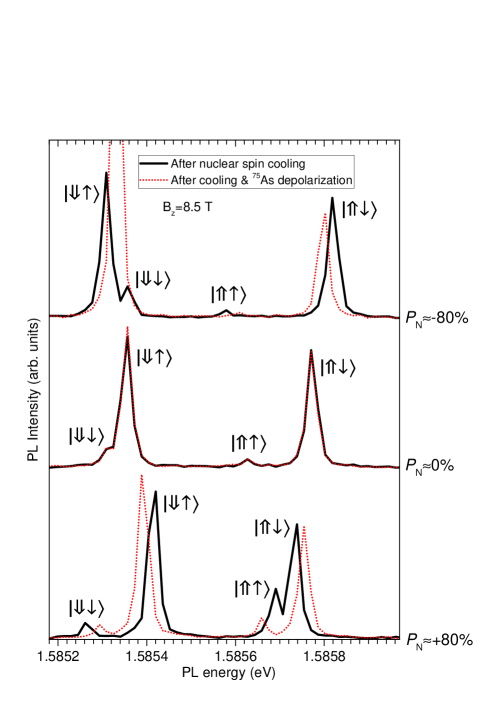
For the neutral dots studied in this work in presence of large magnetic field along the growth axis, the PL spectra exhibit emission of all four excitonic states formed by an electron with spin up or down (, ) and a hole with spin up or down (, ): there are two bright excitons , and two dark excitons , that have finite admixture from bright states making them visible in PL 7. Due to the hyperfine interaction, nuclear spin polarization shifts the energy of each exciton state according to its electron spin and hole spin directions. The contribution of the hole hyperfine interaction is small but not negligible 3. In order to exclude it and measure pure electron hyperfine shifts, we use the splitting in energies of a bright and a dark exciton with the same hole spin projection, for example a - pair of states. Such splitting equals the total electron hyperfine shift plus a constant Zeeman splitting determined by the electron and hole -factors. In order to eliminate the Zeeman contribution and obtain the absolute value of the hyperfine shift for a selected NMR transition of a selected isotope we perform a differential measurement: The probe spectra are measured with rf depolarization (dashed lines in Supplementary Fig. 1) and without (solid lines in Supplementary Fig. 1), the difference in the dark-bright splitting of the two spectra gives the required hyperfine shift. For example the total hyperfine shift of an isotope is found as , where is the change in dark-bright exciton splitting induced by saturating all NMR transitions (see main text and Methods).
Supplementary Note 3 Dependence of the nuclear spin cooling efficiency on the power and wavelength of the optical pumping.
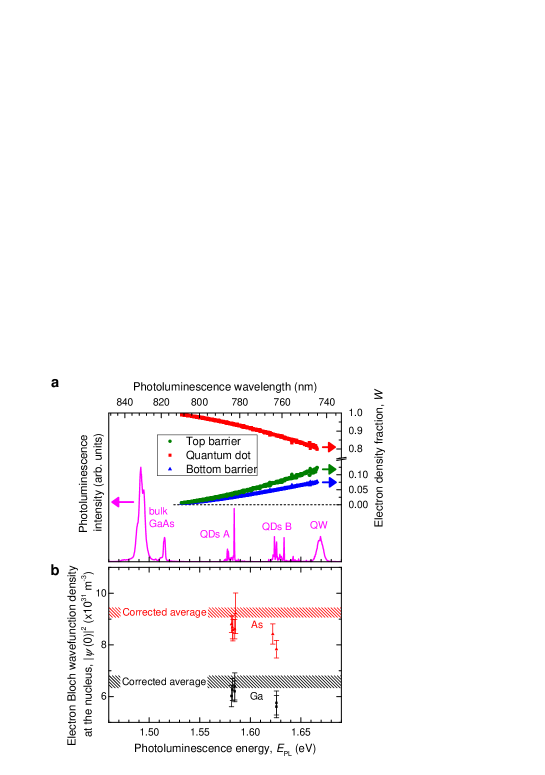
Supplementary Figure 2a shows a broad-range photoluminescence (PL) spectrum of a studied sample measured under non-resonant laser excitation (at 632.8 nm). Several emission features are observed and ascribed to (from left to right) bulk GaAs substrate, long-wavelength quantum dots (type A), short-wavelength quantum dots (type B) and a wetting layer quantum well (QW). Supplementary Figure 2b shows the total optically induced hyperfine shift and the corresponding nuclear spin polarization degree detected on one of the dots type A (marked by an arrow in Supplementary Figure 2a) as a function of a photon energy of a circularly polarized laser at three different excitation powers.
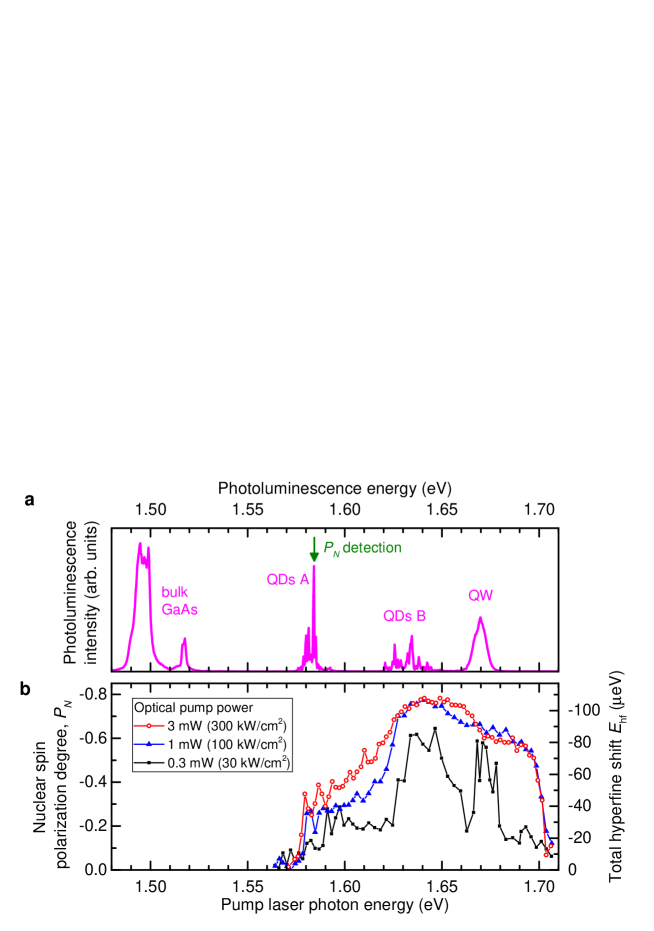
For the lowest used power of 0.3 mW (corresponding to the surface power density of 30 kW/cm2) the result is similar to what was observed previously in the same structure 10 at a comparable excitation power of 0.5 mW: two broad peaks in nuclear spin polarization degree detected in a type A dot are attributed to the resonant optical pumping of the type B dots (1.645 eV peak), and the quantum well (1.675 eV peak consisting of sharp features). When the power is increased up to 3 mW, nuclear spin cooling becomes more efficient for the entire range of the laser photon energies and the broad peaks observed at 0.3 mW broaden further and smear out completely. The largest is observed for a range of energies approximately corresponding to optical excitation of the type B dots. We thus argue that in the studied structures, the most efficient nuclear spin pumping mechanism is via resonant optical injection of spin polarized excitons into the high-energy type B dots with a subsequent tunneling and relaxation into the low-energy type A dots. Measurements at the laser energy of 1.63 eV (which is optimal at 3 mW power) for even higher optical powers up to 15 mW (not shown here) have revealed reduction in , most likely arising from local sample heating. It also follows from Supplementary Figure 2 that for high power optical pumping, a significant nuclear spin cooling can be induced for the entire range of energies between QDs type A and type B, i.e. resonant excitation of type B dots or QW are not the only mechanisms. We further note that up to 30% is observed when pumping with energies as low as 5 meV below the ground state neutral exciton energy of the studied dot. This can be due to the nuclear spin cooling via optical pumping of bi-exciton, multi-exciton or (multi-)charged states. These observations suggest that optical nuclear spin cooling is a complex process, driven by a combination of various nuclear spin pumping and nuclear spin depolarization mechanisms.
It is thus evident that a significant further effort is required in order to understand the mechanisms and engineer the approaches for achieving even deeper cooling of the nuclear spins with . In this respect, we note that the data presented in Supplementary Figure 2b provides only a snapshot of the nuclear spin cooling phenomena in the studied dots. Indeed the measurements were conducted with a relatively broad laser excitation (40 GHz) and coarse steps in photon energy, so that the nuclear spin cooling mechanisms via resonant 11, 12 and quasi-resonant (-shell) 13 optical excitation are yet to be explored. Since each point in Supplementary Figure 2b requires several minutes of PL spectrum integration, a detailed high resolution exploration of as a function of laser power and photon energy (or even more detailed measurements with two or more single-mode tuneable lasers) would require significant experimental effort and is a subject of further work.
Supplementary Note 4 Derivation of electron hyperfine constants : detailed analysis.
The experimentally measured hyperfine shift induced by the polarized nuclear spins is defined as the change in the energy splitting of the 1/2 electron spin levels. The total hyperfine shift is a sum of the hyperfine shifts induced by different isotopes :
| (1) |
The hyperfine shift of the -th isotope in a quantum dot is given by
| (2) |
where the summation goes over all cationic or anionic (depending on the type of the isotope ) sites with coordinates , is the electron hyperfine constant determined only by the fundamental constants and the density of the electron Bloch wavefunction at the nucleus, is the nuclear spin and is the natural abundance of the -th isotope. The nuclear spin polarization degree is always defined and is uniquely related (via Brillouin function) to the dimensionless inverse nuclear spin temperature if the spin temperature exists (, where is the nuclear Larmor frequency, and for spin =3/2 the is given by the last of Eqs. 5 of the main text when divided by ). The inverse temperature and the mole fraction are not constant in general and depend on . ( is defined as the probability that the -th site is occupied by an atom of the element to which the isotope belongs, e.g. =0.5 for Al and Ga in a uniform Al0.5Ga0.5As alloy). is the envelope wavefunction of a localized electron state normalized in a way that when summed over all cationic or anionic sites of the crystal.
Supplementary Eq. 2 gives a complete description of the experimentally observable hyperfine shifts and is the key expression used in the subsequent analysis. If nuclear spin temperature exists Supplementary Eq. 2 can be readily adjusted to yield the experimentally measurable changes in hyperfine shifts and induced by selective rf saturation of the NMR transitions, for this needs to be substituted by the corresponding hyperbolic function of (obtained from Eqs. 5 of the main text by dividing by ).
If (and hence ) is constant over the volume of a quantum dot and its vicinity, Supplementary Eq. 2 simplifies to Eq. 1 of the main text [ with determined only by the structural parameters of the quantum dot , and ] also leading to Eqs. 5 of the main text. For the spatially inhomogeneous , Eq. 1 of the main text still describes the experimentally measured hyperfine shifts if is treated as an average polarization degree, with () depending not only on the and functions, but also on the particular form of . In a similar way, the experimentally measured and can be treated as a result of averaging over the dot volume. The crucial difference is that the and dependencies are not necessarily described by Eqs. 5 of the main text if the hyperfine shifts are obtained by averaging over a distribution of . Since model fitting of the and experimental data is required for the derivation of the nuclear spin temperatures and hyperfine constants, additional justification of the analysis is needed and is presented below.
One can see from Supplementary Eq. 2 what the difficulty is: the experimentally measured hyperfine shifts [left side of the equation] are scalars and can not on their own give full information on the three-dimensional distributions , and [right side of the equeation], and thus additional information and/or assumptions about these functions are needed. The detailed analysis is presented in the subsequent subsections and can be outlined as follows: (A) the molar fractions are estimated from the structural studies on GaAs nanohole quantum dots, (B) the electron envelope wavefunctions are calculated numerically by solving the Schrodinger equation, (C) we show that a particular form of is not important and the derivation of the nuclear spin polarization degrees is robust for a wide range of distributions of .
Supplementary Note 4.1 Effect of the quantum dot structure .
Since arsenic is the only anion in the studied GaAs/AlGaAs structures its molar fraction is , simplifying Eq. 2. As to cations (gallium and aluminium), the earlier TEM studies on similar sample structures have shown sharp interfaces between GaAs and AlGaAs layers 14. We thus use the known molar fractions of aluminium in the barriers to model as a piece-wise function. Such approximation is further justified a posteriori by the smallness () of the fraction of the electron wavefunction in the AlGaAs layers as confirmed by wavefunction calculations (see below in B). Under such conditions, the average cationic molar fractions probed by the electron are effectively , and the particulars of Al/Ga intermixing profile have little effect on the hyperfine shifts and the derivation of the nuclear spin temperatures.
Supplementary Note 4.2 Calculation of the electron envelope wavefunction .
The electron envelope wavefunction that appears as a weighting function in Eq. 2 is calculated by solving the Schrodinger equation using effective mass approximation. We generally follow the approach described in Ref. 15. The electron mass is taken to be (0.067+0.083), and heavy-hole anisotropic masses are taken to be (0.33+0.18), (0.11+0.10), where is the free electron mass. The energy discontinuities at the GaAs/AlxGa1-xAs interface are taken to be 0.79 eV for the conduction band and 0.51 eV for the valence band respectively. We solve single-particle equations for the electron and the hole separately and the contribution of the Coulomb interaction to the exciton energy is calculated as a perturbation.
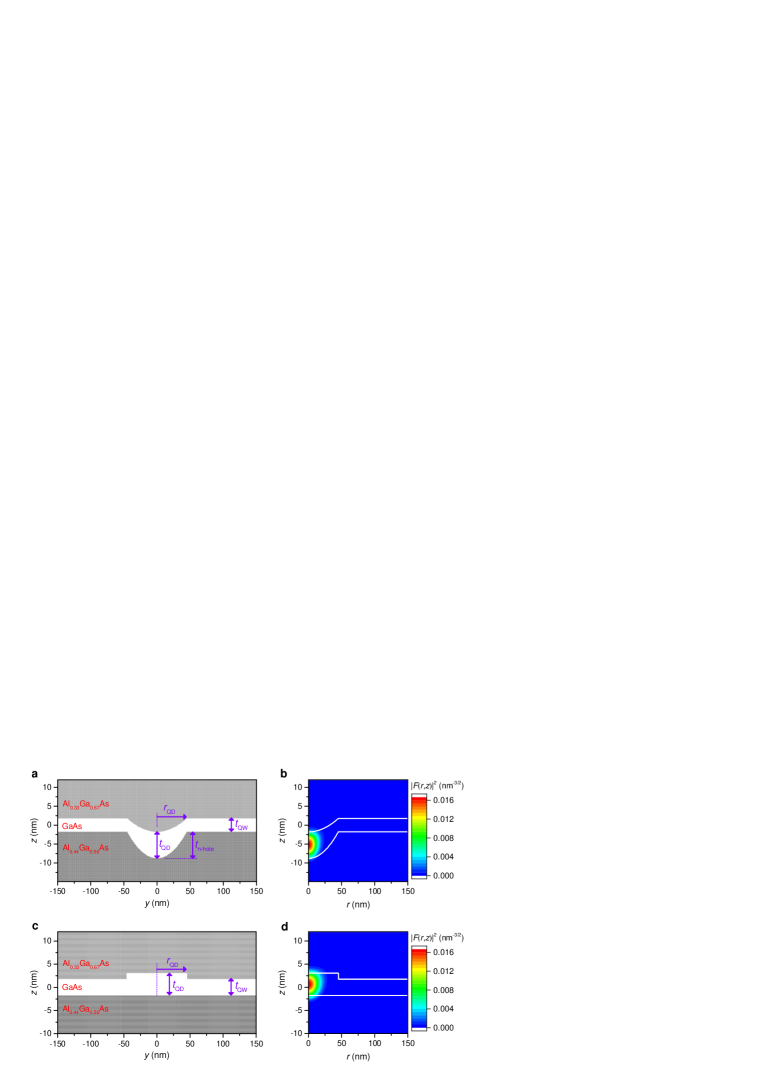
Quantum dots formed by nanohole etching and infilling are modeled using the structure with a cross-section shown in Supplementary Fig. 3a. We assume cylindric symmetry which simplifies the problem. The aluminium molar fractions in the barriers and the thickness of the GaAs quantum well (QW) are taken according to the growth protocol. The calculated QW exciton transition energy is found to match the experimental value of eV (see Supplementary Fig. 2a) for nm in very good agreement with the design QW thickness of nm. The depth of the nanohole (=7.0 nm) the radius of the dot (=45.0 nm), and the thickness of the dot (=7.0 nm) are taken to be comparable to the results of the AFM studies on similar structures 1. The electron wavefunction calculated for such structure is shown in Supplementary Fig. 3b, the optical transition energy is found to be 1.585 eV in good agreement with the emission energies of the long-wavelength (type A) dots.
Short-wavelength quantum dots (type B) were previously shown to arise from the irregularities in GaAs layer thickness at the rims of the nanoholes 10. As a simple approximation we model such dots as disk-shaped QW thickness fluctuations as shown in Supplementary Fig. 3c. With =45.0 nm and =4.81 nm we find transition energy of 1.625 eV in good agreement with experiment. The corresponding electron wavefunction profile is shown in Supplementary Fig. 3d.
We have performed calculations for a wide range of quantum dot dimensions , , . As expected, we find that the same can be obtained for an infinite number of different combinations of , , : the exciton optical transition energy alone does not reveal the entire quantum dot structure. On the other hand, as we show below, the precise knowledge of the electron wavefunction is not required for the calculations of the hyperfine shifts (based on Supplementary Eq. 2). It is sufficient to know the integral properties of such as the fractions of the wavefunction density within the quantum dot GaAs layer and the AlGaAs barriers. These wavefunction density fractions are shown in Supplementary Fig. 4a by the symbols as a function of the exciton transition energy calculated for a large number of model quantum dot structures with different dimensions (both nanohole and disk-shaped dots are included). It can be seen that the calculated points reveal clear dependencies: thus using the experimental energy derived from a PL spectrum (such as shown in Supplementary Fig. 4a by the line) and the calculated one can estimate the wavefunction fractions in the QD and barrier layers for a given studied quantum dot. Since the values are the functions of only, it is not required to know the exact QD shape and size, instead it is sufficient to choose any QD model structure that yields matching the experimental value. In the following analysis we use the particular dot model structures of Supplementary Fig. 3a and 3c whose fit the experimentally observed values of the long- and short-wavelength dots respectively.
Supplementary Note 4.3 The role of the nuclear spin polarization inhomogeneity .
With and estimated above, it is the spatial distribution of the polarization degree [or equivalently the distribution of the inverse nuclear spin temperature ] that needs to be found in order to be able to use Supplementary Eq. 2 to calculate the measured hyperfine shifts. Due to the complex electron-nuclear spin dynamics, experimental measurement or the first principle modeling of distribution in a quantum dot is far beyond what can be achieved at present. Yet, as we now show, it is possible to construct a model for that is sufficiently good to derive electron hyperfine constants from experimental data.
We start by noting that should reach its maximum near the center of the dot () where the electron density peaks and the probability of the electron-nuclear spin flip-flop is maximized. With increasing the polarization should decay monotonically towards 0, since the nuclei remain unpolarized away from the dot. Now let us suppose that the nuclear spins are initially unpolarized in the entire sample () and that the optical cooling is introduced at time . At small the resulting will be proportional to the nuclear spin cooling rate at each point . This rate in turn is proportional to the electron envelope wavefunction density controlling the electron-nuclear flip-flop rate, hence is expected for short . At longer times , nuclear spin diffusion 16, 17 will act to establish a more uniform spatial distribution of . If the longitudinal nuclear spin relaxation was absent, spin diffusion would eventually generate uniform const independent of for . In the real quantum dots in the studied sample the longitudinal relaxation times are long (500 s) but not infinite 10. We thus conclude that the real produced by optical cooling in the studied GaAs/AlGaAs quantum dots is between the two limiting cases of const and .
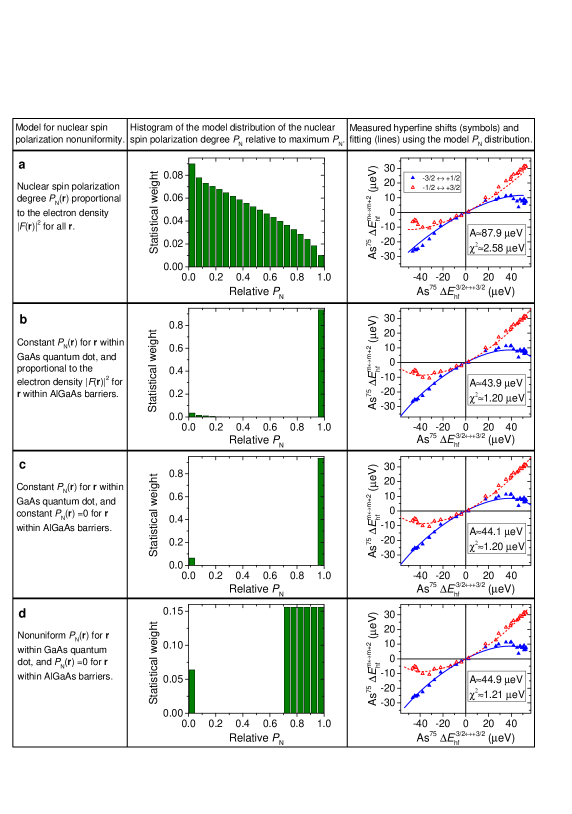
Let us first consider a uniform nuclear spin polarization const. In this case, the sum in the Supplementary Eq. 2 becomes a constant determined only by the structure of the quantum dot, in particular if 75As nuclei () are considered. Under these assumptions we can use Eqs. 5 of the main text to fit the experimental data and derive the nuclear spin temperatures and hyperfine constants . The densities of the electron Bloch wavefunction at the nucleus calculated from the fitted values of (see Eq. 4 of the main text) are shown in Supplementary Fig. 4b by the symbols for all studied quantum dots against their photoluminescence energy . For all studied quantum dots we find that the assumption of const leads to good agreement between experiment and fitting, such as shown in Figs. 2a, b of the main text. On the other hand, there is a small but distinct difference in the fitted values between the long-wavelength (type A) and short-wavelength (type B) quantum dots. As it follows from Supplementary Fig. 4b, the experiments on type B dots that have larger fraction of the electron density in the barriers, give underestimated values of and . This is a clear sign that the const approximation is not exact, and that the deviation arises from the reduced polarization degree in the barriers.
We now examine the opposite case of the largest possible inhomogeneity of the nuclear spin polarization. For this we consider the model structure of Supplementary Fig. 3a with electron envelope wavefunction shown in Supplementary Fig. 3b, and substitute in Supplementary Eq. 2 allowing the hyperfine shifts to be calculated. In order to make the analysis more intuitive we build a histogram of the weighted values that appear in the sum of the Supplementary Eq. 2. For the case of such histogram is shown in the middle column of the Supplementary Fig. 5a for the As nuclei. Each value on the horizontal axis is the polarization degree normalized by its maximum value at the center of the dot, and the height of each bar reflects the fraction of the nuclei with such weighted by the envelope wavefunction density and the molar fraction at such nuclear sites. The right graph of the Supplementary Fig. 5a shows experimental (symbols) and fitted (lines) dependencies for As nuclei in QD A1. The fitting yields an unrealistically large 87.9 eV with a large RMS fitting residual of eV exceeding the experimental error. Thus we can rule out the case.
Combining the above observations, we conclude that the real profile of the nuclear spin polarization degree is much closer to the limiting case of a constant value, rather than to the opposite limit of strongly inhomogeneous . In other words, the spatial width of the distribution is significantly larger than that of the envelope wavefunction density . On the other hand, is not exactly constant, most likely due to the reduced in the AlGaAs barriers. We now discuss how this residual spatial inhomogeneity of can be accounted for in order to improve the accuracy of the hyperfine constant measurement.
Let us assume that optical cooling produces constant within the quantum dot layer, while outside the dot the polarization degree scales as . The corresponding histogram of and fitted dependencies are shown in Supplementary Fig. 5b. Such a model for gives an accurate fit with an RMS residual of eV within the experimental error of the electron hyperfine shift measurements. The assumption of a constant level of within the dot volume can be well justified: long optical cooling times ( s) used in our experiments give sufficient time for nuclear spin polarization to be redistributed via spin diffusion. On the other hand the reduction of in AlGaAs barriers can be understood to arise from the quadrupolar induced suppression of the spin diffusion at the GaAs/AlGaAs interfaces 18, 10.
Very similar fitted value of the hyperfine constant is obtained if we assume a simple bimodal distribution for (constant within the dot and in the barriers as shown in Supplementary Fig. 5c). It is thus evident that the detailed form of distribution in the barriers is not critical due to the small overall effect of the barrier nuclear spin polarization. Importantly, when we perform fitting with bimodal distributions of Supplementary Figs. 5b,c we obtain very close values of the hyperfine constant (and hence ) for both type A and type B dots – this is a good indication that bimodal distribution of is a good approximation to the real distribution of the optically induced .
We now note that the fitting with a bimodal distribution of Supplementary Fig. 5c is equivalent to fitting with a constant in the entire sample, but with hyperfine constant replaced by . This is because the nuclei with do not contribute to the hyperfine shifts and , in which case the additional factor equals , where is the fraction of the electron density in the GaAs QD layer shown in Supplementary Fig. 4a (we consider here the case of 75As where ).
Finally, we examine a case where the barrier nuclei are not polarized (), while the polarization of the QD nuclei is not constant. As an example we use a rectangular distribution with a histogram shown in the middle plot of Supplementary Fig. 5d, where we allow the weighted to be uniformly spread between 70% and 100% of its maximum value, which is likely an exaggeration of the inhomogeneity in a real quantum dot. As the right plot of Supplementary Fig. 5d shows we still find a very good fit with fitted hyperfine constant similar to that obtained from a bimodal distributions of Supplementary Figs. 5b, c. We also find very similar average polarization degrees derived from the fits with different distributions shown in Supplementary Figs. 5b-d.
We thus summarize with the following conclusions. From the measurements on short- and long-wavelength quantum dots we conclude that is reduced in the barriers, which is explained by the suppression of the nuclear spin diffusion at the GaAs/AlGaAs interfaces 18, 10. Our measurement technique not very sensitive to the details of the spatial distribution of the nuclear spin polarization. This however, comes as an advantage, allowing robust measurement of the average and within the GaAs QD layer regardless of the details of the profile. In this Supplementary Note we have presented a detailed first-principles procedure for deriving the electron hyperfine constants from the NMR experiments taking into account the spatial inhomogeneity of the nuclear spin polarization degree . At the same time we have shown that a simplified analysis assuming const (presented in the main text) gives very similar results as long as distribution satisfies rather generic constraints. The only difference is that instead of the hyperfine constants , the simplified model fitting yields a scaled where the structural factor depends on the electron wavefunction density fraction within the GaAs quantum dot volume. This fraction can be estimated by solving the Schrodinger equation for any reasonable model structure whose photoluminescence energy matches the experimentally measured – it is not required to know the exact shape and size of the quantum dot. Even if the value of can not be estimated, the simplified analysis still gives a reliable measure of the average within the dot volume, making the techniques reported here a valuable tool for analysis of the nuclear spin bath thermodynamics in semiconductor quantum dots.
References
- 1 Atkinson, P., Zallo, E., and Schmidt, O. G. Independent wavelength and density control of uniform GaAs/AlGaAs quantum dots grown by infilling self-assembled nanoholes. J. Appl. Phys. 112(5), 054303 (2012).
- 2 Chekhovich, E. A., Kavokin, K. V., Puebla, J., Krysa, A. B., Hopkinson, M., Andreev, A. D., Sanchez, A. M., Beanland, R., Skolnick, M. S., and Tartakovskii, A. I. Structural analysis of strained quantum dots using nuclear magnetic resonance. Nature Nanotech. 7, 646–650 (2012).
- 3 Checkhovich, E. A., Glazov, M. M., Krysa, A. B., Hopkinson, M., Senellart, P., Lemaître, A., Skolnick, M. S., and Tartakovskii, A. I. Element-sensitive measurement of the hole-nuclear spin interaction in quantum dots. Nature Phys 9, 74–78 (2013).
- 4 Munsch, M., Wust, G., Kuhlmann, A. V., Xue, F., Ludwig, A., Reuter, D., Wieck, A. D., Poggio, M., and Warburton, R. J. Manipulation of the nuclear spin ensemble in a quantum dot with chirped magnetic resonance pulses. Nature Nanotechnology 9, 671–675 (2014).
- 5 Chekhovich, E. A., Hopkinson, M., Skolnick, M. S., and Tartakovskii, A. I. Suppression of nuclear spin bath fluctuations in self-assembled quantum dots induced by inhomogeneous strain. Nat Commun 6, 6348 (2015).
- 6 Waeber, A. M., Hopkinson, M., Farrer, I., Ritchie, D. A., Nilsson, J., Stevenson, R. M., Bennett, A. J., Shields, A. J., Burkard, G., Tartakovskii, A. I., Skolnick, M. S., and Chekhovich, E. A. Few-second-long correlation times in a quantum dot nuclear spin bath probed by frequency-comb nuclear magnetic resonance spectroscopy. Nature Phys 12, 688–693 (2016).
- 7 Bayer, M., Stern, O., Kuther, A., and Forchel, A. Spectroscopic study of dark excitons in InxGa1-xAs self-assembled quantum dots by a magnetic-field-induced symmetry breaking. Phys. Rev. B 61, 7273–7276 (2000).
- 8 Chekhovich, E. A., Krysa, A. B., Skolnick, M. S., and Tartakovskii, A. I. Direct measurement of the hole-nuclear spin interaction in single InP/GaInP quantum dots using photoluminescence spectroscopy. Phys. Rev. Lett. 106, 027402 (2011).
- 9 Puebla, J., Chekhovich, E. A., Hopkinson, M., Senellart, P., Lemaître, A., Skolnick, M. S., and Tartakovskii, A. I. Dynamic nuclear polarization in InGaAs/GaAs and GaAs/AlGaAs quantum dots under nonresonant ultralow-power optical excitation. Phys. Rev. B 88, 045306 (2013).
- 10 Ulhaq, A., Duan, Q., Zallo, E., Ding, F., Schmidt, O. G., Tartakovskii, A. I., Skolnick, M. S., and Chekhovich, E. A. Vanishing electron factor and long-lived nuclear spin polarization in weakly strained nanohole-filled GaAs/AlGaAs quantum dots. Phys. Rev. B 93, 165306, Apr (2016).
- 11 Latta, C., Högele, A., Zhao, Y., Vamivakas, A. N., Maletinsky, M., Kroner, M., Dreiser, J., Carusotto, I., Badolato, A., Schuh, D., Wegscheider, W., Atatture, M., and Imamoglu, A. Confluence of resonant laser excitation and bidirectional quantum-dot nuclear-spin plarization. Nat Phys 5, 758 – 763 (2009).
- 12 Chekhovich, E. A., Makhonin, M. N., Kavokin, K. V., Krysa, A. B., Skolnick, M. S., and Tartakovskii, A. I. Pumping of nuclear spins by optical excitation of spin-forbidden transitions in a quantum dot. Phys. Rev. Lett. 104, 066804 (2010).
- 13 Lai, C. W., Maletinsky, P., Badolato, A., and Imamoglu, A. Knight-field-enabled nuclear spin polarization in single quantum dots. Phys. Rev. Lett. 96, 167403 (2006).
- 14 Pfeiffer, M., Lindfors, K., Zhang, H., Fenk, B., Phillipp, F., Atkinson, P., Rastelli, A., Schmidt, O. G., Giessen, H., and Lippitz, M. Eleven nanometer alignment precision of a plasmonic nanoantenna with a self-assembled GaAs quantum dot. Nano Letters 14(1), 197–201 (2014).
- 15 Grundmann, M., Stier, O., and Bimberg, D. InAs/GaAs pyramidal quantum dots: Strain distribution, optical phonons, and electronic structure. Phys. Rev. B 52, 11969–11981 (1995).
- 16 Paget, D. Optical detection of nmr in high-purity GaAs: Direct study of the relaxation of nuclei close to shallow donors. Phys. Rev. B 25, 4444–4451, Apr (1982).
- 17 Eberhardt, K. W., Mouaziz, S., Boero, G., Brugger, J., and Meier, B. H. Direct observation of nuclear spin diffusion in real space. Phys. Rev. Lett. 99, 227603, Nov (2007).
- 18 Nikolaenko, A. E., Chekhovich, E. A., Makhonin, M. N., Drouzas, I. W., Van’kov, A. B., Skiba-Szymanska, J., Skolnick, M. S., Senellart, P., Martrou, D., Lemaître, A., and Tartakovskii, A. I. Suppression of nuclear spin diffusion at a GaAs/AlxGa1-xAs interface measured with a single quantum-dot nanoprobe. Phys. Rev. B 79, 081303 (2009).