Growing supermassive black holes in the late stages of galaxy mergers are heavily obscured
Abstract
Mergers of galaxies are thought to cause significant gas inflows to the inner parsecs, which can activate rapid accretion onto supermassive black holes (SMBHs), giving rise to Active Galactic Nuclei (AGN). During a significant fraction of this process, SMBHs are predicted to be enshrouded by gas and dust. Studying 52 galactic nuclei in infrared-selected local Luminous and Ultra-luminous infrared galaxies in different merger stages in the hard X-ray band, where radiation is less affected by absorption, we find that the amount of material around SMBHs increases during the last phases of the merger. We find that the fraction of Compton-thick (CT, ) AGN in late merger galaxies is higher () than in local hard X-ray selected AGN (), and that obscuration reaches its maximum when the nuclei of the two merging galaxies are at a projected distance of kiloparsecs (). We also find that all AGN of our sample in late merger galaxies have , which implies that the obscuring material covers of the X-ray source. These observations show that the material is most effectively funnelled from the galactic scale to the inner tens of parsecs during the late stages of galaxy mergers, and that the close environment of SMBHs in advanced mergers is richer in gas and dust with respect to that of SMBHs in isolated galaxies, and cannot be explained by the classical AGN unification model in which the torus is responsible for the obscuration.
keywords:
galaxies: active — X-rays: general — galaxies: nuclei — galaxies: Seyfert — quasars: general — infrared: galaxies1 Introduction
Early merger galaxies
Late merger galaxies
Over the past twenty years, accumulated evidence shows that galaxies and the supermassive black holes (SMBHs) at their centres grow together (Ferrarese & Merritt 2000; Gebhardt et al. 2000; Kormendy & Ho 2013) during a phase in which the SMBH is accreting matter and is observed as an Active Galactic Nucleus (AGN). It is however still uncertain how accretion onto SMBHs is triggered, since the gas and dust need to lose of their angular momentum before reaching the vicinity of the SMBH (e.g., Shlosman et al. 1990). The merger of two or more galaxies has been long thought to be one of the main mechanisms capable of funnelling material from the kpc- to the pc-scale environment of SMBHs, while simultaneously triggering vigorous star formation (Sanders et al. 1988). This has been predicted by analytical studies as well as by numerical simulations (e.g., Di Matteo et al. 2005), which indicate that tidal torques lead to the inflow of gas into the innermost regions (Hernquist 1989). In agreement with this idea, Treister et al. (2012) found that the fraction of AGN in mergers increases with the AGN luminosity (see also Bessiere et al. 2012; Schawinski et al. 2012; Hickox et al. 2014; Glikman et al. 2015), and observations of optically-selected (Ellison et al. 2011), IR-selected (Satyapal et al. 2014) and X-ray selected (Silverman et al. 2011; Koss et al. 2012) samples of pairs have shown that the fraction of dual AGN is larger in systems with close companions. Studies of radio-loud AGN have also shown that galaxy interactions might play a role in triggering AGN activity (Ramos Almeida et al. 2011), as well as in the formation of strong jets (Chiaberge et al. 2015).
One of the main predictions of merger-triggered accretion is that during the final phases of a merger most of the accretion would happen when the SMBH is completely enshrouded by gas and dust (e.g., Hopkins et al. 2006). Recent studies have also shown that there seems to be an increase in the amount of obscuring material in mergers of galaxies. Studying pairs of galaxies, Satyapal et al. (2014) found that there is an enhanced fraction of IR-selected AGN with respect to optically-selected AGN in advanced mergers, which suggests that a large number of objects are missed by optical classification because they are heavily obscured.
| (1) | (2) | (3) | (4) | (5) | (6) |
|---|---|---|---|---|---|
| IRAS name | Source | z | M | (″) | (kpc) |
| F000851223 | NGC 34 | 0.019617 | D | S | S |
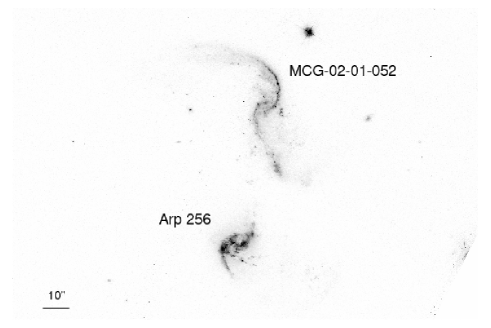
| F001631039 | Arp 256 & MCG0201052 | 0.027152 | B | 56.1 | 33.1 |
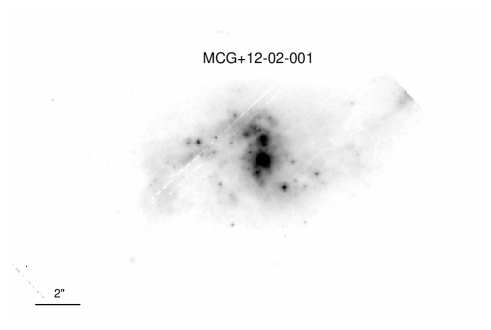
| F00506+7248 | MCG+1202001 | 0.015698 | C | 0.9 | 0.3 |
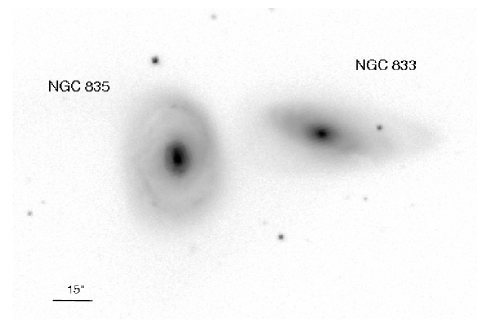
| F020691022 | NGC 833 & NGC 835 | 0.012889 | A | 55.9 | 15.7 |
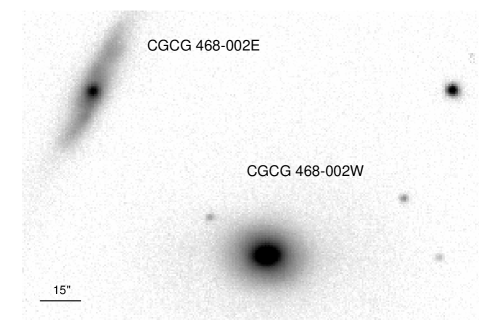
| F05054+1718 | CGCG 468002E & CGCG 468002W | 0.018193 | B | 29.6 | 11.3 |
| F051892524 | IRAS 051892524 | 0.042563 | D | S | S |
| F08572+3915 | IRAS 08572+3915 (NW & SE) | 0.058350 | D | 4.4 | 5.6 |
| F09320+6134 | UGC 05101 | 0.039367 | D | S | S |
| F09333+4841 | MCG+0818013 & MCG+0818012 | 0.025941 | A | 66.5 | 35.4 |
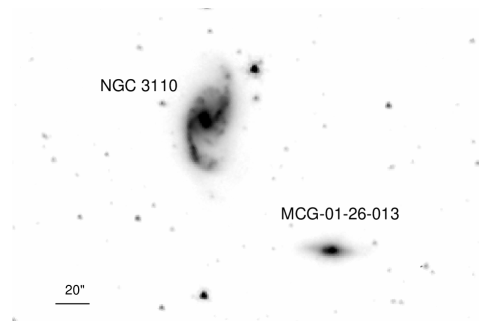
| F100150614 | NGC 3110 & MCG0126013 | 0.016858 | A | 108.9 | 37.7 |
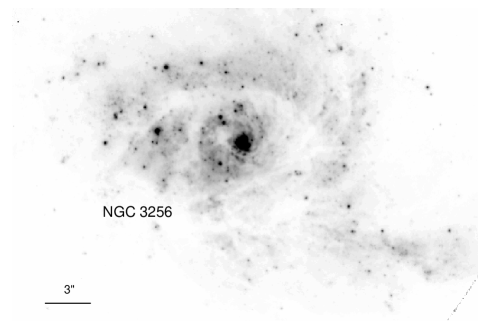
| F102574339 | NGC 3256 | 0.009354 | D | 5.1 | 1.0 |
| F10565+2448 | IRAS 10565+2448 | 0.043100 | D | 7.4 | 6.7 |
| F11257+5850 | Arp 299 (NGC3690W & NGC3690E) | 0.010220 | C | 21.3 | 4.6 |
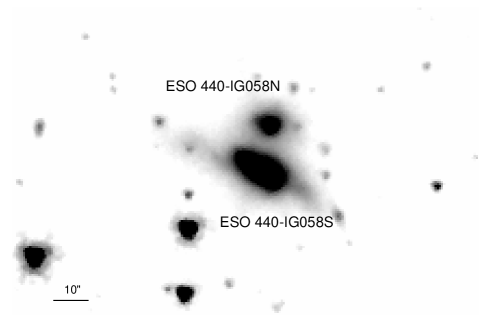
| F120433140 | ESO 440IG058N & ESO 440IG058S | 0.023413 | B | 12.0 | 5.9 |
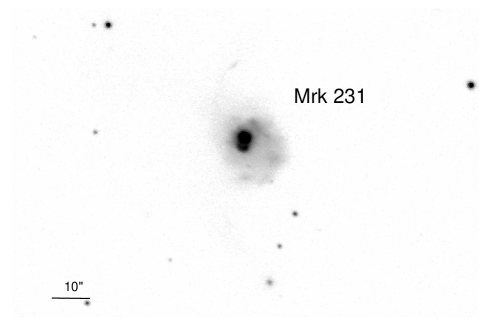
| F12540+5708 | Mrk 231 | 0.042170 | D | S | S |
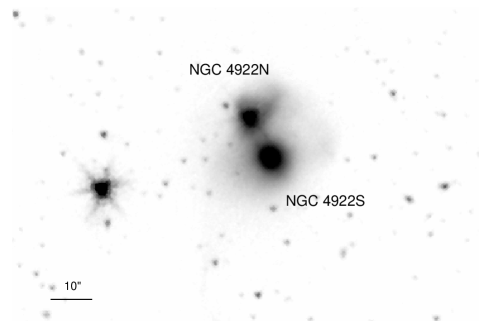
| F12590+2934 | NGC 4922N & NGC 4922S | 0.023169 | C | 21.2 | 10.8 |
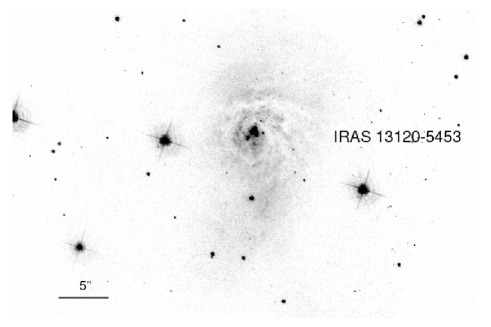
| 131205453 | IRAS 131205453 | 0.030761 | D | S | S |
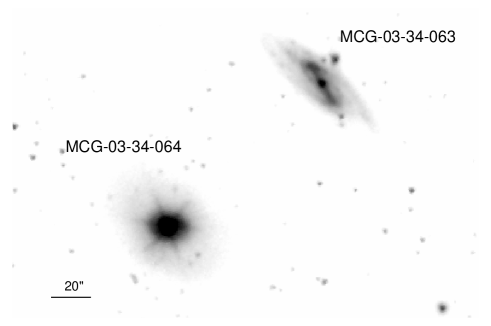
| F131971627 | MCG0334064 & MCG0334063 | 0.021328 | A | 106.2 | 37.7 |
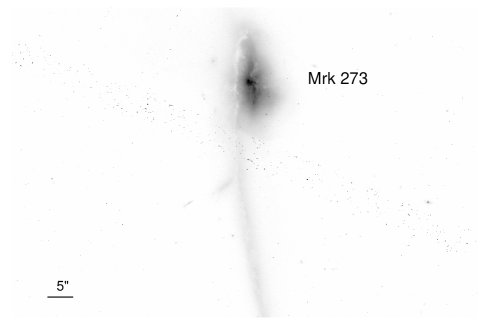
| F13428+5608 | Mrk 273 | 0.037780 | D | 0.9 | 0.7 |
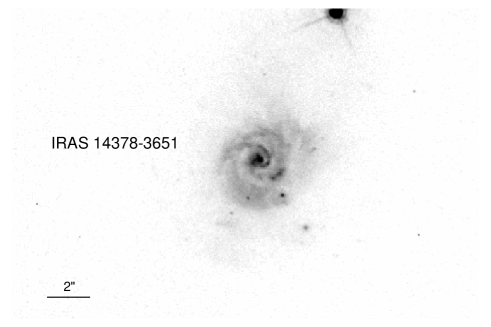
| F143783651 | IRAS 143783651 | 0.067637 | D | S | S |
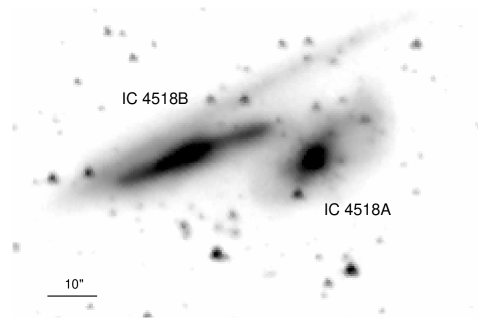
| F145444255 | IC 4518A & IC 4518B | 0.016261 | B | 36.0 | 12.0 |
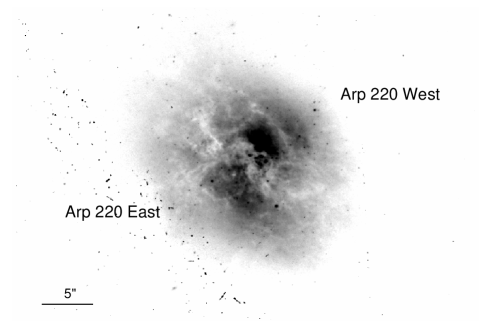
| F15327+2340 | Arp 220W & Arp 220E | 0.018126 | D | 1.0 | 0.4 |
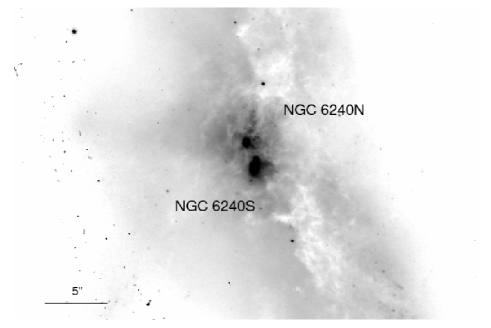
| F16504+0228 | NGC 6240N & NGC 6240S | 0.024480 | D | 1.4 | 0.7 |
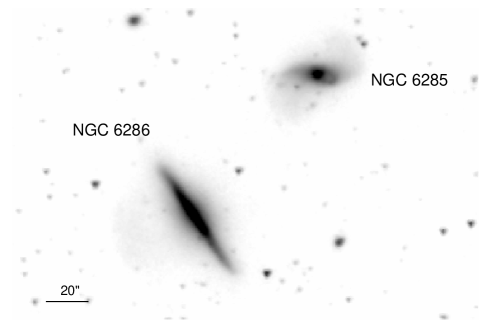
| F16577+5900 | NGC 6286 & NGC 6285 | 0.018349 | B | 91.1 | 35.8 |
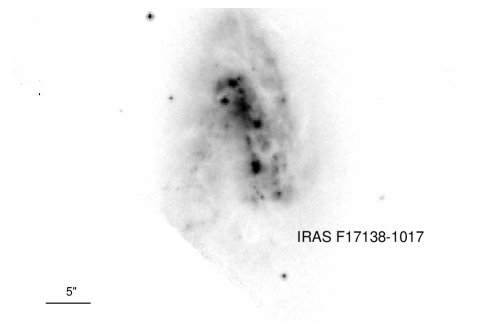
| F171381017 | IRAS F171381017 | 0.017335 | D | S | S |
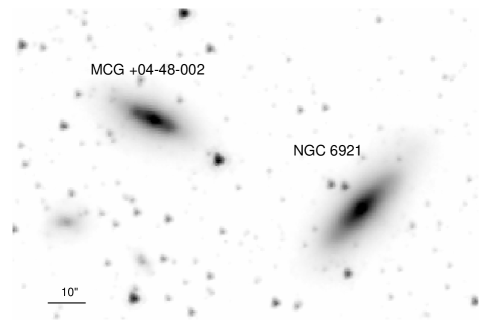
| 20264+2533 | MCG 0448002 & NGC 6921 | 0.013900 | A | 91.4 | 27.1 |
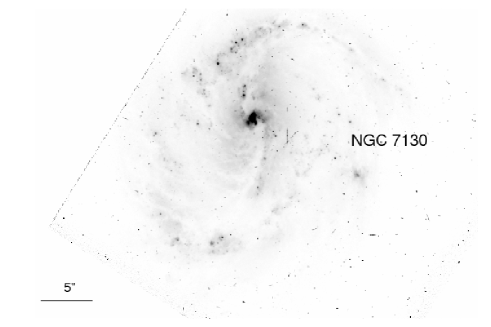
| F214533511 | NGC 7130 | 0.016151 | D | S | S |
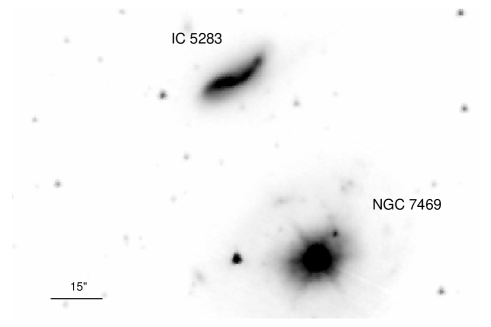
| F23007+0836 | NGC 7469 & IC 5283 | 0.016317 | A | 79.7 | 26.8 |
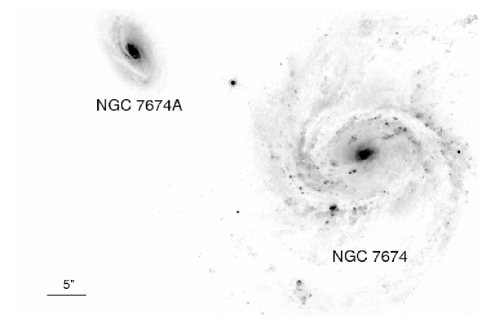
| F23254+0830 | NGC 7674 & NGC 7674A | 0.028924 | A | 34.1 | 20.7 |
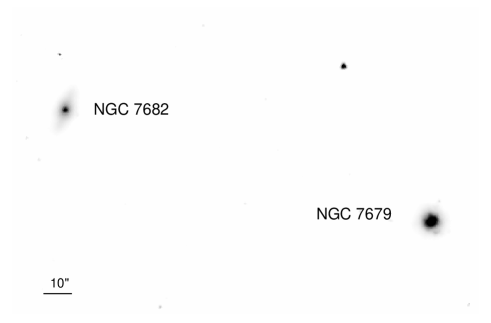
| 23262+0314 | NGC 7679 & NGC 7682 | 0.017139 | A | 269.7 | 97.3 |
Studying galaxies at , Kocevski et al. (2015) found an increase in the fraction of galaxies undergoing mergers, or with interactions signatures, in AGN with with respect to unobscured AGN. Tentative evidence of an excess of merging systems in AGN with was found by Del Moro et al. (2016) studying mid-IR quasars at . Analysing the X-ray spectra of heavily obscured AGN in the COSMOS field, Lanzuisi et al. (2015) found evidence of an increase in the fraction of mergers in CT sources with respect to X-ray selected samples. Koss et al. (2016a) also discussed a possible increase in the fraction of advanced mergers in Compton-thick (CT, ) AGN, finding that two out of the nine CT AGN selected by using the spectral curvature approach are in close mergers ( kpc). This fraction ()111The value was calculated following Cameron (2011), and the uncertainties represent the 16th and 84th quantiles of a binomial distribution. is higher than that typically found for Swift/BAT AGN (; Koss et al. 2010).
| (1) | (2) | (3) | (4) |
| IRAS name | Source | () | Reference |
| F020691022 | NGC 833 | Oda et al. (in prep.) | |
| NGC 835a | Oda et al. (in prep.) | ||
| NGC 835b | Oda et al. (in prep.) | ||
| F051892524 | IRAS 051892524 | Teng et al. (2015) | |
| F08572+3915 | IRAS 08572+3915 | – | Teng et al. (2015) |
| F09320+6134 | UGC 5101 | Oda et al. (2016) | |
| F102574339 | NGC 3256 | – | Lehmer et al. (2015) |
| F10565+2448 | IRAS 10565+2448 | – | Teng et al. (2015) |
| F11257+5850 | NGC 3690W | Ptak et al. (2015) | |
| F12540+5708 | Mrk 231 | Teng et al. (2014) | |
| 131205453 | IRAS 131205453 | Teng et al. (2015) | |
| F13428+5608 | Mrk 273 | Teng et al. (2015) | |
| F143783651 | IRAS 143783651 | – | Teng et al. (2015) |
| F15327+2340 | Arp 220W | Teng et al. (2015) | |
| F16504+0228 | NGC 6240N | Puccetti et al. (2016) | |
| NGC 6240S | Puccetti et al. (2016) | ||
| F16577+5900 | NGC 6286 | Ricci et al. (2016b) | |
| F23254+0830 | NGC 7674 | Gandhi et al. (2016) | |
| Notes. NC: value not constrained; a XMM-Newton observation; b NuSTAR and Chandra observation. | |||
With the aim of understanding how galaxy mergers affect the environment of AGN, we have studied a sample of 30 luminous222 and ultra-luminous333 IR galaxies (U/LIRGs) in different merger stages (for a total of 52 individual galactic nuclei) at hard X-ray energies ( keV). Hard X-rays are one of the best energy bands to detect and characterise the most obscured and possibly CT AGN, due to the lower opacity of the obscuring material with respect to softer X-ray energies. The recent launch of the NASA mission NuSTAR (Harrison et al. 2013), the first focussing hard X-ray (3–79 keV) telescope in orbit, has allowed the study of even some of the most obscured and elusive growth episodes of AGN (e.g., Annuar et al. 2015; Baloković et al. 2014; Boorman et al. 2016; Brightman et al. 2015; Gandhi et al. 2014; Lansbury et al. 2014, 2015; Ricci et al. 2016a, b). The objects in our sample were selected from the Great Observatories All-sky LIRG Survey (GOALS, Armus et al. 2009). GOALS is a local () galaxy sample selected from the Infrared Astronomical Satellite (IRAS) revised bright Galaxy Survey (Sanders et al. 2003). The sample has a rich collection of ancillary data, from the radio to the X-rays (e.g., Inami et al. 2010; Iwasawa et al. 2011b; Petric et al. 2011; Romero-Cañizales et al. 2012; Díaz-Santos et al. 2013; Stierwalt et al. 2013; Privon et al. 2015, 2016), and the IRAS infrared selection guarantees that the sample is not biased by obscuration.
In this work we report the results of broad-band X-ray spectroscopy for all the U/LIRGs of the sample by combining NuSTAR and Swift/BAT data with archival Chandra, XMM-Newton and Swift/XRT data. From X-ray spectroscopy and multi-wavelength properties, clear evidence of AGN emission is found in 25 nuclei, of which 13 are early mergers and 12 are late mergers. The X-ray spectra of these AGN were self-consistently modelled to take into account both absorption (including Compton scattering and photoelectric absorption) and reprocessing of the X-ray radiation from the circumnuclear material. This approach provides strong constraints on the line-of-sight column density. The paper is structured as follows. In 2 we describe the sample of galaxies used and the different merger stages, in 3 we report details about the X-ray data used and the data reduction, and in 4 we discuss the spectral fitting procedure adopted. The observed increase in the fraction of CT AGN along the merger sequence (with advanced mergers being typically more obscured than isolated galaxies) is discussed in 5, while in 6 we summarise our results and present our conclusions. In a forthcoming paper (Ricci et al. in prep.) we will discuss the relation between the multi-wavelength properties of the U/LIRGs of our sample and the bolometric luminosity of the AGN. Throughout the paper we adopt standard cosmological parameters (, , ). Unless otherwise stated, all uncertainties are quoted at the 90% confidence level.
2 Sample and merger stages
The GOALS sample contains 180 LIRGs and 22 ULIRGs selected from the IRAS Revised Bright Galaxy Sample (Sanders et al. 2003), which is a complete sample of extragalactic objects with 60m flux Jy. The galaxies in GOALS represent a large, statistically complete sample of U/LIRGs. Objects in GOALS have been observed by Spitzer and Herschel (Inami et al. 2010; Petric et al. 2011; Díaz-Santos et al. 2011; Inami et al. 2013; Díaz-Santos et al. 2013; Stierwalt et al. 2013; Díaz-Santos et al. 2014; Stierwalt et al. 2014). Our sample contains all GOALS sources observed by NuSTAR and for which data were available as of March 2016. This includes: i) sources located at Mpc, and with , amongst which ten LIRGs in different merger stages that were awarded to our group during AO–1 (for a total of 200 ks, PI: F. E. Bauer); ii) the nearest () ULIRGs from Sanders et al. (2003) (see Teng et al. 2015 for details); iii) sources detected by Swift/BAT and observed as a part of the campaign aimed at characterising local hard X-ray selected sources with NuSTAR. We excluded the four U/LIRGs classified as non-mergers (N stage) by Stierwalt et al. (2013) since we are interested in studying the evolution of obscuration along the merger sequence. We also included three systems (IRAS F23007+0836, IRAS 23262+0314, IRAS F131971627) that were detected at hard X-rays by Swift/BAT (Baumgartner et al. 2013) but have not been observed by NuSTAR, to avoid any possible bias in the NuSTAR selection of BAT sources.
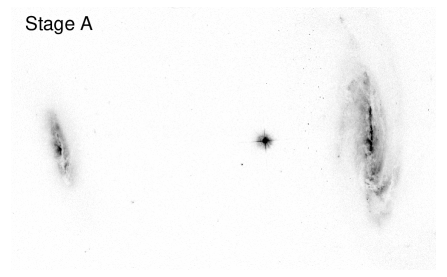
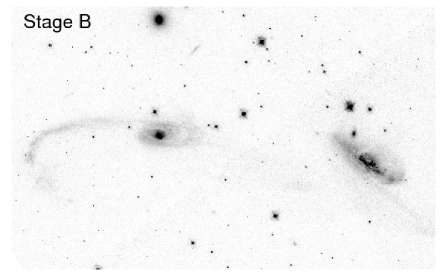
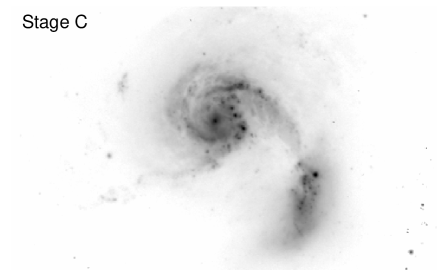
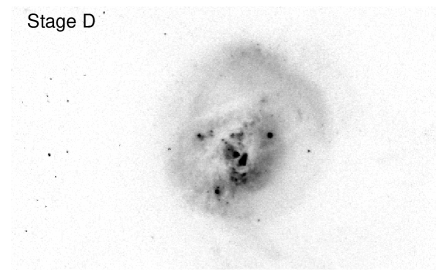
We divided GOALS galaxies into four subsamples, based on the merger stage determined by Stierwalt et al. (2013) and Haan et al. (2011) from visual inspection of Spitzer IRAC 3.6m and Hubble Space Telescope images (see Figure 1 and Table 1). The merger sequence we considered is the following:
Stage A are systems in pre-merger, i.e. galaxy pairs prior to a first encounter.
Stage B are objects in the initial phases of merger, i.e. galaxies after the first-encounter, with galaxy disks still symmetric and showing signs of tidal tails.
Stage C are systems in the mid-stage of merger, showing amorphous disks, tidal tails, and other signs of merger activity.
Stage D are sources in the final merger stages, showing the two nuclei in a common envelope or only a single nucleus.
| (1) | (2) | (3) | (4) | (5) |
|---|---|---|---|---|
| IRAS name | Source | Facility | Observation ID | Exposure [ks] |
| F000851223 | NGC 34 | NuSTAR | 60101068002 | 21.4/21.4 |
| Chandra | 15061 | 14.8 | ||
| XMM-Newton | 0150480501 | 12.0/16.7/17.2 | ||
| F001631039 | Arp 256 & MCG0201052 | NuSTAR | 60101069002 | 20.5/20.5 |
| Chandra | 13823 | 29.6 | ||
| F00506+7248 | MCG+1202001 | NuSTAR | 60101070002 | 25.5/25.5 |
| Chandra | 15062 | 14.3 | ||
| F05054+1718 | CGCG 468002E & CGCG 468002W | NuSTAR | 60006011002 | 15.5/15.5 |
| Swift/XRT | 49706 | 72.1 | ||
| F09333+4841 | MCG+0818013 & MCG+0818012 | NuSTAR | 60101071002 | 19.1/19.1 |
| Chandra | 15067 | 13.8 | ||
| F100150614 | NGC 3110 & MCG0126013 | NuSTAR | 60101072002 | 17.9/17.8 |
| Chandra | 15069 | 14.9 | ||
| XMM-Newton | 0550460201 | 11.0/17.8/18.0 | ||
| F120433140 | ESO 440IG058N & ESO 440IG058S | NuSTAR | 60101073002 | 28.6/28.6 |
| Chandra | 15064 | 14.8 | ||
| F12590+2934 | NGC 4922N & NGC 4922S | NuSTAR | 60101074002 | 20.7/20.6 |
| Chandra | 15065 | 14.9 | ||
| F131971627 | MCG0334064 & MCG0334063 | XMM-Newton | 0506340101 | 66.5/85.4/85.9 |
| F145444255 | IC 4518A & IC 4518B | NuSTAR | 60061260002 | 7.8/7.8 |
| XMM-Newton | 0406410101 | 21.2/24.4 | ||
| F16577+5900 | NGC 6286 & NGC 6285 | NuSTAR | 60101075002 | 17.5/17.5 |
| Chandra | 10566 | 14.0 | ||
| F171381017 | IRAS F171381017 | NuSTAR | 60101076002 | 25.9/25.9 |
| Chandra | 15063 | 14.8 | ||
| 20264+2533 | MCG +0448002 & NGC 6921 | NuSTAR | 60061300002 | 19.5/19.5 |
| XMM-Newton | 0312192301 | 6.5/12.4/12.7 | ||
| F214533511 | NGC 7130 | NuSTAR | 60061347002 | 21.2/21.2 |
| Chandra | 2188 | 38.6 | ||
| F23007+0836 | NGC 7469 & IC 5283 | XMM-Newton | 0207090101 | 59.2 |
| 23262+0314 | NGC 7679 & NGC 7682 | XMM-Newton | 0301150501 | 13.1/19.3/19.1 |
Objects in stage A and B can be considered early mergers, and those in stage C and D late mergers. We used the merger classifications provided by Stierwalt et al. (2013), with the exception of the following three systems.
-
•
IRAS F145444255 (IC 4518A and IC 4518B) is in the GOALS sample but, while Spitzer imaging is available, this system was not classified by Stierwalt et al. (2013). Optical and IR images show that the two galaxies are clearly separated (36 arcsec or 12.0 kpc) and show signs of tidal interactions (see Appendix A.21). They were therefore classified as being in stage B.
-
•
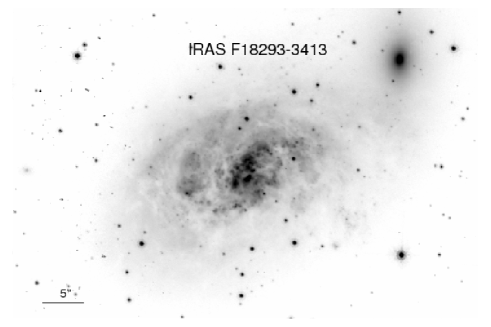
IRAS F182933413 is classified as being in stage C by Stierwalt et al. (2013). Hubble Space Telescope (HST) imaging (Fig. 2) shows, however, that the two systems do not share a common envelope, and the source was classified as being in a pre-merger stage by Haan et al. (2011). Given the much smaller size of the companion object, we reclassify this object as stage N.
-
•
IRAS F214533511 (NGC 7130), which was initially classified as a non-merger has been recently shown to present post-merger features by Davies et al. (2014). We therefore reclassify this source as stage D with a single nucleus.
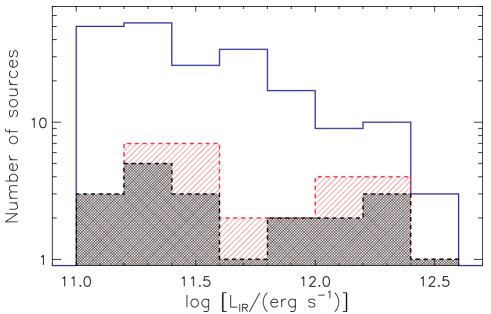
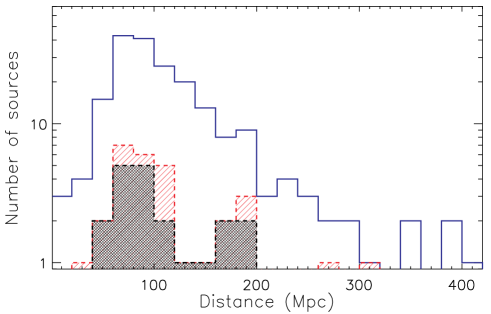
Overall our sample consists of 30 systems, of which eight show a single nucleus and the remaining 22 show two nuclei, for a total of 52 galactic nuclei. Our sample is a representative subsample of GOALS galaxies. The histogram of the 8-1000 m luminosities () of all objects in the GOALS sample and of the GOALS galaxies in our sample are showed in the top panel of Fig. 3 (blue and red lines, respectively). The two samples have similar luminosities, and performing a Kolmogorov-Smirnov (KS) test we find a p-value of 0.13, which implies that our sample does not have a distribution of significantly different from that of the GOALS sample. Similarly, the distribution of distances of our sample does not differ from that of GOALS galaxies (bottom panel of Fig. 3), and the KS test results in a p-value of 0.91. The two panels of Fig. 3 also show the distributions of the AGN in our sample (black lines). A KS test between the luminosity (distance) distributions of AGN and of all the galaxies in the GOALS sample shows that the two samples are not significantly different, resulting in a p-value of 0.16 (0.60).
The sample objects, together with their merger stage and the distance between the two nuclei are reported in Table 1. The images of the objects of our samples are shown in Figs. 4-8. NuSTAR observations of 15 systems have been studied before, and for these objects we report the results from the literature in Table 2.
IRAS F000851223
IRAS F001631039
IRAS F00506+7248
IRAS F020691022
IRAS F05054+1718
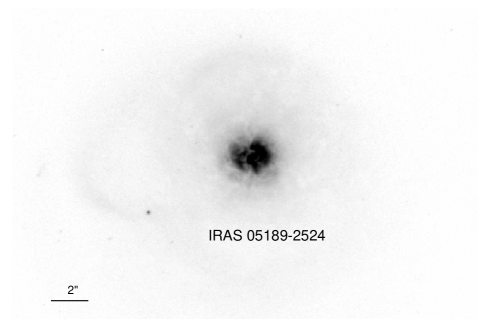
IRAS F051892524
IRAS 085723915
IRAS F09320+6134
IRAS F09333+4841
IRAS 100150614
IRAS 102574339
IRAS 105652448
IRAS 112575850
IRAS 120433140
IRAS F125405708
IRAS F125902934
IRAS 131205453
IRAS F131971627
IRAS 134285608
IRAS 143783651
IRAS 145444255
IRAS 153272340
IRAS 165040228
IRAS F16577+5900
IRAS F171381017
IRAS 20264+2533
IRAS 214533511
IRAS 230070836
IRAS 232540830
IRAS 232620314
3 X-ray observations and data reduction
We analysed the X-ray observations of 16 systems, using XMM-Newton (3.2), Chandra (3.3), NuSTAR (3.1), Swift/BAT and Swift/XRT data (3.4). The observation log of our sample is reported in Table 3. Details about the analysis of all sources are reported in Appendix A. The angular separation between the nuclei and the relation with the extraction regions used for the different instruments are discussed in detail in Appendix A for every source analysed here.
3.1 NuSTAR
We studied here the 13 observations carried out by the Nuclear Spectroscopic Telescope Array (NuSTAR, Harrison et al. 2013) not studied before. Of these, nine were observed as a part of a dedicated campaign awarded to our group during NuSTAR AO-1 (PI F. Bauer). The NuSTAR data were processed using the NuSTAR Data Analysis Software nustardas v1.4.1 within heasoft v6.16, adopting the calibration files released on UT 2015 March 16 (Madsen et al. 2015). A circular region of 45 arcsec was used for the sources, while the background was extracted from an annulus centred on the X-ray source, with an inner and outer radius of 50 and 100 arcsec, respectively. In none of the NuSTAR observations analysed here are two AGN confused or within the same extraction region. This is due to the fact that either i) no nucleus was detected by NuSTAR; ii) one nucleus only was detectable by NuSTAR; iii) if both nuclei were detectable, they were at a distance sufficient to avoid confusion.
| (1) | (2) | (3) | (4) | (5) | (6) | (7) | (8) |
| IRAS name | Source | kT | |||||
| () | (keV) | () | |||||
| F000851223 | NGC 34 | – | 240.7/288 [C/] | ||||
| F001631039 | Arp 256 | – | – | 167.9/191 [C] | |||
| MCG0201052 | – | – | – | 62.0/91 [C] | |||
| F00506+7248 | MCG+1202001 | – | – | – | 131.8/144 [C] | ||
| F05054+1718 | CGCG 468002W | – | – | – | 604.0/545 [] | ||
| F09333+4841 | MCG+0818013 | – | – | – | 57.6/71 [C] | ||
| F100150614 | NGC 3110 | – | – | 245.2/270 [C/] | |||
| MCG0126013 | – | – | – | 44.9/53 [C/] | |||
| F120433140 | ESO440IG058N | – | – | – | – | 40.1/45 [C] | |
| ESO440IG058S | – | – | – | 66.7/71 [C] | |||
| F12590+2934 | NGC 4922N | 56.3/108 [C/] | |||||
| F131971627 | MCG0334064 | 1805.1/1396 [] | |||||
| F145444255 | IC 4518A | – | 399.2/331 [] | ||||
| IC 4518B | 165.7/188 [C] | ||||||
| F16577+5900 | NGC 6285 | – | – | – | – | 16.8/16 [C] | |
| F171381017 | IRASF171381017 | – | – | – | – | 108.2/131 [C/] | |
| 20264+2533 | MCG +0448002 | – | 185.5/169 [] | ||||
| NGC 6921 | – | 64.7/82 [] | |||||
| F214533511 | NGC 7130 | 330.5/346 [C/] | |||||
| F23007+0836 | NGC 7469 | – | – | – | 1923.5/1766 [] | ||
| 23262+0314 | NGC 7679 | – | – | 278.9/259 [] | |||
| NGC 7682 | – | 876.2/914 [C] | |||||
| Notes. : value of fixed to that of the AGN continuum (); : additional plasma ( keV); : value fixed | |||||||
3.2 XMM-Newton
XMM-Newton (Jansen et al. 2001) observations of seven systems of our sample were available. We analysed EPIC/PN (Strüder et al. 2001) and MOS (Turner et al. 2001) data by reducing the original data files (ODFs) using XMM-Newton Standard Analysis Software (SAS) version 12.5.0 (Gabriel et al. 2004). The raw PN and MOS data files were then reduced using the epchain and emchain tasks, respectively.
The observations were then filtered for periods of high background activity by analysing the EPIC/PN and MOS background light curves in the 10–12 keV band and above 10 keV, respectively. For both cameras we extracted the spectra of the sources using a circular region of 25 arcsec radius, while the background was extracted from a circular region of 40 arcsec radius, located on the same CCD of the source and in a zone where no other source was found.
For all the XMM-Newton observations analysed here, with the exception of IRAS F14544-4255, the two nuclei are at a distance larger than the size of the extraction region used. In the case of IRAS F14544-4255 the two galaxies are from each other, and we used a radius of 5 arcsec (20 arcsec) for the spectral extraction of IC 4518B (IC 4518A).
3.3 Chandra
Chandra (Weisskopf et al. 2000) ACIS (Garmire et al. 2003) observations are available for ten sources in our sample. Most of these observations were carried out as a part of the campaign aimed at following up GOALS sources (PI: D. Sanders, see Iwasawa et al. 2011b; Torres Albà et al. in prep. for details). We reduced Chandra ACIS data following standard procedures, using CIAO v.4.6. All data were reprocessed using the chandra_repro task. For the extraction we used a circular region with a radius of 10 arcsec, which included all the X-ray emission associated to the objects. A circular region with the same radius, selected in region where no other source was detected was used for the background.
3.4 Swift XRT and BAT
Data from the X-ray telescope (XRT, Burrows et al. 2005) on board Swift were used only for IRAS F05054+1718. Swift/XRT data analysis was performed using the xrtpipelinev0.13.0 within heasoft v6.16 following the standard guidelines. Swift/BAT time-averaged spectra were used for two systems (IRAS F23007+0836 and IRAS F131971627), and were taken from the latest release of the Swift/BAT catalog (Baumgartner et al. 2013).
4 X-ray spectral analysis
The X-ray spectral analysis was carried out within xspec v.12.8.2 (Arnaud 1996). Galactic absorption in the direction of the source was added to all models using the Tuebingen-Boulder interstellar matter absorption model TBabs (Wilms et al. 2000), fixing the column density () to the value reported by Kalberla et al. (2005) for the coordinates of the source. Abundances were fixed to solar values. Spectra were typically rebinned to 20 counts per bin in order to use statistics. Cash statistics (Cash 1979) were used to fit Chandra spectra, and the source spectra were binned to have one count per bin, in order to avoid issues related to empty bins in xspec.
We used a variety of spectral models to reproduce the X-ray emission from the galaxies in our sample. To model the underlying stellar processes, which can lead to X-ray emission in U/LIRGs, we used a thermal plasma (apec in xspec) and a power-law component (zpowerlaw) to reproduce X-ray emission from hot plasma gas and an underlying population of X-ray binaries, respectively. The free parameters of the apec model are the temperature () and the normalization (), while for the power-law component they are the photon index () and the normalization (). If required by the data we added photoelectric absorption (zphabs) to the thermal plasma and the X-ray binary emission. The only free parameter of this component is the column density ().
From X-ray spectroscopy and multi-wavelength properties evidence of AGN emission is found in 25 nuclei, of which 13 are early mergers and 12 are late mergers. While we cannot completely exclude the presence of low-luminosity or heavily obscured AGN in the systems for which no evidence of AGN activity is found, the X-ray spectra of all the sources analysed here (with the exception of IRAS F171381017) have characteristics consistent with those of star-forming regions in the X-ray band. We refer the reader to Appendix A for a detailed discussion on the presence of accreting SMBHs and on the X-ray and multi-wavelength properties of all sources of our sample.
In order to self-consistently reproduce absorbed and reprocessed X-ray radiation from the circumnuclear material of the AGN we used the torus model developed by Brightman & Nandra (2011), which considers an X-ray source surrounded by a spherical-toroidal structure (atable{torus1006.fits}). This model was developed from ray-tracing simulations and reproduces the main features arising from the reprocessing of the primary X-ray radiation from neutral material (e.g., Matt et al. 1991; Murphy & Yaqoob 2009): a narrow Fe K line at 6.4 keV (e.g., Shu et al. 2010; Ricci et al. 2014a, b) and the Compton hump at keV (e.g., Koss et al. 2016a). These features are particularly prominent in CT AGN, due to the fact that most of the primary X-ray emission is obscured. The free parameters of the torus model we used here are the column density (), the photon index () and the normalization () of the primary X-ray emission. In this model does not vary with the inclination angle, which we set to the maximum value permitted ( deg). The model allows also to vary the half-opening angle of the torus (). This component was fixed to deg whenever it could not be constrained. In obscured AGN a second, unabsorbed, power-law component is often observed emerging at energies lower than the photoelectric cutoff. This component has often been associated to Thomson scattering of the primary X-ray radiation from ionised gas (e.g., Ueda et al. 2007). To take into account this feature, which could be confused with the emission arising from a population of X-ray binaries, when an AGN is present we fixed the photon index of the second power-law component to the value of the AGN primary X-ray emission. The amount of scattered radiation is parametrised in terms of , which is the ratio between the normalizations of the scattered component and of the primary X-ray emission.
5 Discussion
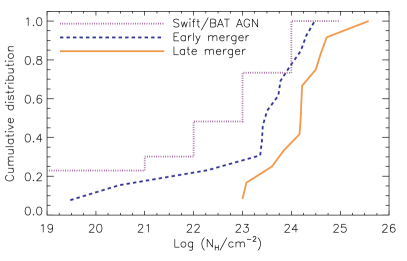
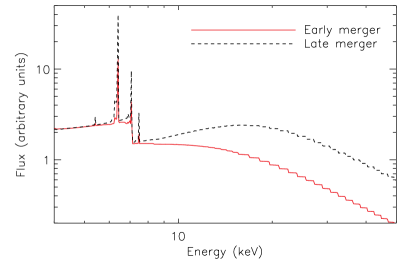
The broad-band X-ray spectral analysis of the objects in our sample shows that AGN in advanced merger stages are typically more obscured than AGN in isolated galaxies or in galaxies in the early stages of mergers (Fig. 9). In Fig. 10 we illustrate the average normalised spectral models of AGN in galaxies in early (red continuous line) and late (black dashed line) merger stage. The image clearly illustrates that the main features indicating heavy obscuration, the Fe K line and Compton hump, are stronger in AGN in late merger stage galaxies. We find that AGN in late-merger stage galaxies host a significantly ( confidence) larger fraction of CT AGN () compared to local hard X-ray selected AGN (, Ricci et al. 2015; see also Burlon et al. 2011), which are mostly found in non-merging systems444Only of Swift/BAT AGN are found in close mergers (Koss et al. 2010).. The fraction of CT AGN in early-merger stage galaxies () is marginally lower than in late-merger stage galaxies, and is consistent with that of local hard X-ray selected AGN (Fig. 11). All the uncertainties reported on the fractions of AGN represent the 16th and 84th quantiles of a binomial distribution, computed with the beta function (Cameron 2011).
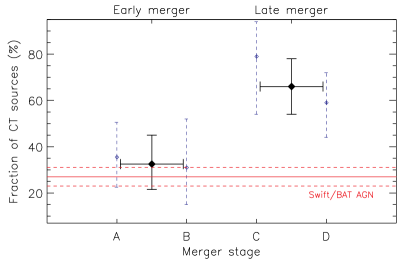
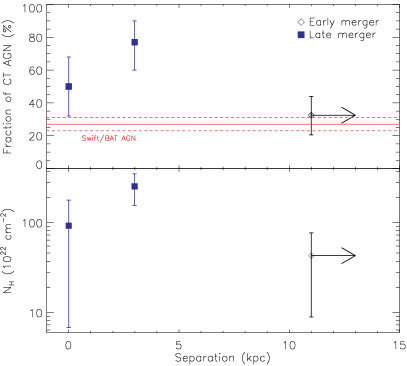
Dividing the sample based on the distance between the nuclei of the merging galaxies (top panel of Fig. 12), we find that the fraction of CT AGN peaks () when the sources are in late merger stages and at a projected distance of 0.4–10.8 kiloparsecs. The median column density (bottom panel of Fig. 12) also reaches its maximum value at this stage [], and is larger than for early mergers at a distance kpc []. In agreement with these X-ray based results, a further four nuclei (the NW and SE nuclei of IRAS 08572+3915, NGC 3690E and IRAS 143783651) in the sample have indications for the presence of accreting SMBHs from other multi-wavelength tracers, although they are only weakly or not detected by NuSTAR (and are therefore very likely heavily obscured). All are in late stage of mergers, with three of them being in systems in which the two galactic nuclei are separated by a few kiloparsecs (see Appendix A).
The increase of the fraction of CT AGN along the merger sequence is in strong agreement with the long-standing paradigm that galaxy mergers are able to trigger the inflow of material onto the close environment of SMBHs. Recent numerical simulations of mergers (Blecha et al. in prep.) show that an increase in caused by the merger dynamics is expected as the distance between the two nuclei decreases. Because these simulations can only probe column densities on resolved scales ( pc), they provide a lower limit on the total line-of-sight obscuration. On scales of pc, the median value of predicted by the simulations () is significantly lower than what we found here, and the simulations shows that AGN can be obscured by CT material only for a very brief phase around coalescence. This could imply that the material responsible for most of the obscuration is located on scales smaller than those probed by the simulations (i.e., pc). Our findings are consistent with recent observations carried out in the submm band, which found evidence of Compact Obscuring Nuclei (CON; Aalto et al. 2015) in U/LIRGS (e.g., Sakamoto et al. 2010; Costagliola et al. 2013; Martín et al. 2016). These CON typically have sizes of tens of parsecs (e.g., Aalto et al. 2015; Scoville et al. 2015), and the high column densities () inferred from the submm observations may be responsible for the bulk of the obscuration traced by the X-rays.
According to the classical unification scheme of AGN (Antonucci 1993), obscuration is only due to anisotropic material distributed in the form of a torus, and the sole difference between obscured and unobscured objects is the inclination of the observer with respect to the torus. The fraction of CT AGN in mergers vastly exceeds that expected considering a random viewing angle with respect to the torus, and this enhanced obscuration is indicative of additional material on pc-scales. Moreover, as illustrated in Fig. 9, AGN in late mergers are almost completely surrounded by material with , which covers of the solid angle of the accreting SMBH555The covering factor was calculated following the approach described in Cameron (2011), and the uncertainties represent the 16th and 84th quantiles of a binomial distribution.. As a comparison, the covering factor of material with in Swift/BAT AGN is (Ricci et al. 2015). This implies that the classical unification scenario is not sufficient to describe the structure of obscuration in galaxies undergoing mergers. Our results can be interpreted in the framework of the AGN evolutionary model first proposed by Sanders et al. (1988) for U/LIRGS. This scenario starts with a merger of galaxies, which triggers accretion and heavy obscuration, along with strong starbursts, and is then followed by a phase in which feedback from the AGN removes the obscuring material and the source can be observed as a red quasar (e.g., Urrutia et al. 2008; Banerji et al. 2012; LaMassa et al. 2016). The object eventually ends its life as an unobscured quasar (e.g., Treister et al. 2010). Here we find a hint of a decrease in the fraction of CT AGN and in the median with the separation (for kpc). In particular closely-separated nuclei seem to have a larger fraction of CT AGN than objects in the single-nuclei phase, which in the evolutionary scheme would be the stage when the AGN is starting to clean up its environment. This behaviour, if confirmed, would also be in agreement with recent numerical simulations (Blecha et al. in prep.).
Several studies over the past years have shown that the fraction of AGN in mergers increases with the AGN luminosity (e.g., Treister et al. 2012; Glikman et al. 2015), reaching at bolometric luminosities of , in agreement with the idea that mergers of galaxies are able to effectively fuel SMBHs. This picture is consistent with what has been recently found for mid-IR selected Hot Dust-obscured galaxies (e.g., Eisenhardt et al. 2012; Wu et al. 2012; Assef et al. 2015), which host the most luminous obscured AGN known (e.g., Stern et al. 2014; Piconcelli et al. 2015; Assef et al. 2016; Ricci et al. 2017), show an excess of submillimiters galaxies as neighbours (Jones et al. 2015), and tend to be found in mergers of galaxies (Fan et al. 2016). Some recent studies of galaxies at (e.g., Villforth et al. 2014, 2016) have argued that the fraction of AGN in mergers is significantly lower, and it does not increase with the AGN bolometric luminosity. However, the samples used for these studies were selected in the soft X-ray band, which is strongly biased against heavily obscured sources. In particular, Villforth et al. (2016) used a ROSAT-selected sample, which, in the rest-frame of the sources they considered, corresponds to a selection in the keV band. Our work shows that the circumnuclear environment of AGN in mergers is different (i.e. richer in gas and dust) from that of AGN in isolated galaxies, which implies that soft X-ray selection would fail to detect most of the AGN in mergers. Considering the median of sources in advanced stages of merger with two distinct nuclei [], which would be the sources easier to distinguish as mergers at , the AGN would lose of the keV flux.
Treister et al. (2012) showed that, while 90% of AGN are triggered by secular processes (i.e., stellar bars, supernova winds, etc.), of the SMBH growth is caused by mergers. Since mergers are predicted to be ubiquitous and play a fundamental role in the formation and evolution of galaxies (Springel et al. 2005), accretion triggered by tidal torques could contribute significantly to the growth of SMBHs, and could produce the observed relation between the mass of the SMBH and the velocity dispersion of the galaxy bulge (e.g., Di Matteo et al. 2005; Blecha et al. 2011). With the NuSTAR observations analysed here, we show that mergers of galaxies are able to drive material into the proximity of the SMBH, thus strengthening the idea that interactions between galaxies are critical to understand the link between accreting SMBHs and their hosts.
6 Summary and conclusions
In this work we studied the relation between AGN obscuration and galaxy mergers. This was done analysing the broad-band X-ray emission of a sample of 30 luminous and ultra-luminous IR galaxies in different merger stages from the GOALS sample (for a total of 52 individual galactic nuclei). In a forthcoming paper (Ricci et al. in prep.) we will discuss the multi-wavelength properties of the U/LIRGs of our sample, and how they relate to the bolometric luminosity of the AGN. In the following we summarise our findings.
-
•
All AGN of our sample in late merger galaxies have , which implies that the obscuring material covers of the X-ray source (see Fig. 9). The close environment of these objects is therefore very different from what would be foreseen by the unification model of AGN.
- •
-
•
A peak in the fraction of CT AGN is found when the nuclei of the two merging galaxies are at a projected distance of kiloparsecs (, see Fig. 12). This is also the stage at which the maximum of the median is observed []. We also find a hint of a decrease both in and in the median when only a single nucleus is observed. If confirmed, this decrease of the obscuring material might be related to feedback from the AGN clearing out its environment.
Our results confirm the long-standing idea that galaxy mergers are able to trigger the inflow of material onto the inner tens of parsecs, and that the close environment of AGN in late-merger galaxies is richer in gas and dust as compared to AGN in isolated galaxies.
Appendix A Notes on individual sources
In the following we report the details on the individual sources, including previous literature studies on the presence of an accreting SMBH using multi-wavelength tracers of AGN activity. The proxies of AGN activity we use are the following:
-
•
The presence of high-excitation mid-IR (MIR, 5–40 m) emission lines (e.g., Sturm et al. 2002), and in particular [Ne V] m and [Ne V] m, indicate of the presence of an AGN, since the ionization potential of [Ne V] is 97 eV, which is considered too high to be produced by star formation (e.g., Weedman et al. 2005).
-
•
The slope of the near IR continuum, with a very red continuum (, with , Imanishi et al. 2010) suggesting the presence of a buried AGN (Risaliti et al. 2006; Sani et al. 2008; Imanishi et al. 2008). Similarly, we also used the Wide-field Infrared Survey Explorer satellite (WISE, Wright et al. 2010) colours, adopting as threshold for the presence of an AGN (Stern et al. 2012). It should be however remarked that this tracer can be problematic for low-luminosity AGN in strongly star-forming galaxies (e.g., Griffith et al. 2011; Hainline et al. 2016).
-
•
The equivalent width (EW) of the 3.3m and 6.2m polycyclic aromatic hydrocarbon (PAH) features. PAH features are destroyed by the radiation field of the AGN or diluted by the strong MIR continuum, thus low values of the EW typically indicate the presence of an AGN [EW nm, Imanishi et al. 2010; Ichikawa et al. 2014; EWm, Stierwalt et al. 2013].
-
•
Optical line ratios. The U/LIRGs of our sample are optically classified as objects dominated by star formation in the optical band (i.e. HII-regions; e.g., Ho et al. 1997), objects that might contain both star-formation and AGN activity (i.e., composite objects; e.g. Yuan et al. 2010), and objects that are clearly dominated by AGN activity (i.e., Seyfert 1s or Seyfert 2s).
-
•
The spatial variations of the radio spectral index (i.e., radio-spectral-index maps; Vardoulaki et al. 2015) allow objects to be classified as radio-AGN, composite AGN/starburst (SB), and radio-starburst (radio-SB).
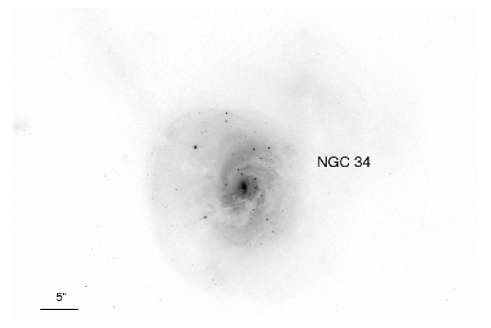
A.1 IRAS F000851223 (NGC 34)
The LIRG NGC 34 is in merger stage D, and shows a single nucleus (Fig. 4). The object is reported to be a Seyfert 2 by Yuan et al. (2010). Using the radio spectral index maps, Vardoulaki et al. (2015) also confirmed the presence of an AGN.
The source is detected by NuSTAR in the 3–10 keV (10-24 keV) band at 5.7 (6.3) and 6.8 (4.4) for FPMA and FPMB, respectively. The source is also detected by Chandra and by XMM-Newton. The X-ray spectrum of NGC 34 (Fig. 13) shows a clear Fe K feature at keV, which also indicates the presence of an AGN. We therefore applied a model including both thermal emission and an AGN component (atable{torus1006.fits} + apec + zpowerlaw). We added a cross-calibration constant between the different, non-simultaneous, observations. We found that the flux varied by a factor 2 between the NuSTAR, Chandra and XMM-Newton observations. Our spectral analysis shows that the AGN is heavily obscured, with a column density of . The value of the half-opening angle could not be constrained for this observation, and was therefore fixed to deg. The scattered radiation has a flux of of the primary X-ray emission in the X-ray energy band probed here.
A.2 IRAS F001631039 (Arp 256 & MCG0201052)
The two objects are in stage B, and their projected separation is 33.1 kpc (Fig. 4). While Arp 256 is a LIRG, the IR luminosity of MCG0201052 is . Optically, Arp 256 is classified by Yuan et al. (2010) as a HII-region, and none of the tracers detect an AGN in Arp 256 or MCG0201052.
The two galactic nuclei are at a distance (56.1″) that allows them to be well separated by Chandra. While the two galaxies are detected by Chandra, they are not detected by NuSTAR, with both nuclei only exhibiting significances of in the 3–10 keV band and of in the 10–24 keV band. The Chandra spectra of both sources are soft, and can be well fit by a starburst model. For Arp 256 a thermal plasma and a power law component, both of which appear obscured [zphabs(zpo+apec)], are necessary to best reproduce the spectrum. The same model, with the exception of the absorbing component, was used for MCG0201052. The spectra and the fit are shown in Fig. 13.
A.3 IRAS F00506+7248 (MCG+1202001)
This LIRG is in merger stage C, and the projected separation of the two nuclei is 0.3 kpc (Fig. 4). The system is classified in the optical as a composite (Alonso-Herrero et al. 2009), and none of the tracers analysed suggest the presence of an AGN.
While the system is detected by Chandra, it is not detected by NuSTAR, and the significance is for each camera in the 3–10 keV and 10–24 keV band. Given the very small separation between the two nuclei (0.9″) the X-ray emission observed by Chandra could come from any of the two nuclei, or from both of them. The Chandra spectrum was fitted with a simple absorbed power law model (zphabszpowerlaw). Using the relation of Ranalli et al. (2003), we find that the star formation rate obtained for the source (, Howell et al. 2010) is able to account for the totality of the 2–10 keV luminosity observed. The steep photon index obtained () also suggests that the X-ray emission is related to star formation. The spectrum of the source is illustrated in Fig. 13.
A.4 IRAS F020691022 (NGC 833 & NGC 835)
IRAS F020691022 (also called Arp 318) is composed of two galaxies at a projected distance of 15.7 kpc and is in merger stage A (Fig. 4). The multi-wavelength tracers fail to detect evidence of AGN activity, with the exception of optical spectroscopy for NGC 835, which is classified as a Seyfert 2 (Véron-Cetty & Véron 2010). NGC 835 hosts a low-luminosity AGN which appears responsible for most of the 2–10 keV emission (González-Martín et al. 2016). NGC 833 is classified as a LINER (Véron-Cetty & Véron 2010), but it has been found to be AGN dominated, with a very low star-formation rate () over the past few hundreds of Myr (O’Sullivan et al. 2014).
The two galaxies are separated by 55.9″, and could be therefore well resolved by the NuSTAR, XMM-Newton/EPIC and Chandra observations studied by Oda et al. (in prep.), who found that both sources are strongly detected by NuSTAR. Oda et al. (in prep.) found that the analysis of the combined XMM-Newton EPIC, Chandra/ACIS and NuSTAR spectra of NGC 833 results in a column density of . Variability of the line-of-sight column density between the Chandra and XMM-Newton observations of NGC 835 was found by González-Martín et al. (2016). Oda et al. (in prep.) find that the NuSTAR spectrum is very different from the XMM-Newton observation carried out in January 2000, while it is consistent with the spectrum of the more recent (July 2013) Chandra observation. Fitting separately the combined Chandra/NuSTAR spectra and the XMM-Newton spectrum, Oda et al. (in prep.) found that the column density varies from (XMM-Newton) to (Chandra/NuSTAR). Through the rest of the paper we use the mean value of the column density for this source ().
A.5 IRAS F05054+1718 (CGCG 468002E & CGCG 468002W)
This system in merger stage B is composed of an eastern (CGCG 468002E) and a western (CGCG 468002W) component (Fig. 4). While the eastern object is a LIRG, the western component has a luminosity in the IR of . The western component shows a [Ne V] line at 14.32 m (Inami et al. 2013), which indicates the presence of an AGN. From the ratio of the [Ne V]/[Ne II] and [O IV]/[Ne II] lines the AGN is found to contribute to of the MIR emission (Petric et al. 2011). The western component also shows a weak (EWm) PAH 6.2m feature, indicative of a significant AGN contribution to the MIR flux. None of the proxies of AGN activity find evidence of an AGN in the eastern component.
The two galaxies are separated by , and could therefore be distinguished both by the Swift/XRT and the NuSTAR observations studied here. CGCG 468002W is clearly detected by NuSTAR in both detectors ( in 0.3–10 kev and in 10–24 keV for both FPMA and FPMB). The source is also detected by Swift/XRT in the 0.3–10 keV band. The Swift/XRT spectrum of this source is comprised from the integration of several observations carried out within a month in late 2014. The model we used to fit the spectra is similar to that used for NGC 34, with the exception of the thermal plasma, which is not required by the data. We also added a line at keV (EW eV) to account for the observed excess at keV. The model we used is atable{torus1006.fits} + zgauss + zpowerlaw, and shows that the level of obscuration of the source is low []. A cross-calibration constant was also added, and showed that the flux of NuSTAR is times higher than that of the XRT observation. The ratio between the scattered power-law and the primary X-ray emission is . The broad-band spectrum is illustrated in Fig. 13. CGCG 468002E was detected by neither Swift/XRT (2–8 keV) nor by NuSTAR (10–24 keV).
A.6 IRAS 051892524
This merger stage D ULIRG shows a single nucleus (Fig. 4), which has been found to host an AGN using several proxies. The source shows strong 14.32 m (Inami et al. 2013) and 24.32 m (Pereira-Santaella et al. 2010) [Ne V] lines, and very weak PAH features at 3.3m (EW nm, Imanishi et al. 2008) and at 6.2m (EW m, Stierwalt et al. 2013). Optically the source is classified as a Seyfert 2 (Yuan et al. 2010). The [Ne V]/[Ne II] and [O IV]/[Ne II] ratios indicate that the AGN contributes of the MIR flux.
Previous studies in the X-ray band have also confirmed the presence of an AGN. The source has been detected by XMM-Newton (Imanishi & Terashima 2004; Teng & Veilleux 2010), by Chandra (Ptak et al. 2003), and by the XIS camera on board Suzaku (Teng et al. 2009). These X-ray spectral studies have shown that the AGN is obscured, with a line-of-sight column density . The source has also been detected by Swift/BAT (Koss et al. 2013). IRAS 051892524 was detected by NuSTAR in three observations carried out in 2013 for a total of ks (Teng et al. 2015). Analyzing the combined XMM-Newton and NuSTAR spectrum, Teng et al. (2015) showed that the obscuration can be explained by considering two absorbers, with column densities of and , covering and of the X-ray source, respectively. To account for the partial covering, for this object we considered to be the sum of the two column densities weighted by the covering factor.
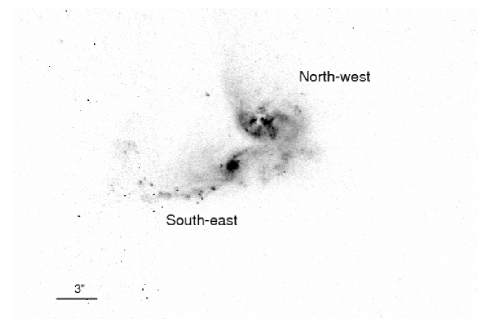
A.7 IRAS 08572+3915
IRAS 08572+3915 is a ULIRG in a merger stage D showing two distinct nuclei (northwest and southeast), located at a distance of 5.6 kpc (Fig. 5). While no [Ne V] emission line is detected (Pereira-Santaella et al. 2010; Inami et al. 2013), the system shows a very strong silicate absorption feature at m () and weak PAH features at 3.3m (EW nm, Imanishi et al. 2008) and at 6.2m (EW m, Stierwalt et al. 2013). Using the radio spectral index, Vardoulaki et al. (2015) also found results consistent with the presence of an AGN. Both the northwest (NW) and the southeast (SE) nuclei are classified as Seyfert 2s by Yuan et al. (2010).
The NuSTAR observation of this object did not yield significant detections of either unresolved nuclei (Teng et al. 2015). The source was also not detected by a previous Suzaku observation (Teng et al. 2009). Teng et al. (2015) argued that the source could be X-ray weak, although it cannot be excluded that it is heavily obscured, similar to what we find here for most of the sources showing two nuclei with a separation of a few kpc. Using CO, Evans et al. (2002) estimated the average column density to be in the range of for this system. The NW nucleus was detected by Chandra, and Teng et al. (2009) reported an observed 0.5–10 keV luminosity of . The hardness ratios points to a photon index of , also indicative of heavy obscuration. We conclude therefore that both nuclei are likely to host heavily obscured AGN, but do not use these sources since an estimation of is lacking.
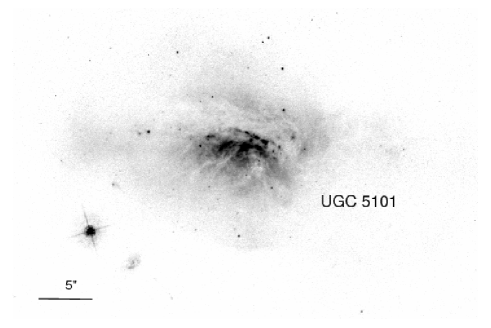
A.8 IRAS F09320+6134 (UGC 5101)
UGC 5101 is a ULIRG with a single nucleus, classified as merger stage D (Fig. 5). Multi-wavelength studies have shown strong evidence for the presence of an AGN, such as 14.32m and 24.32m [Ne V] emission lines (Pereira-Santaella et al. 2010; Inami et al. 2013), and weak 3.3m (EW nm, Imanishi et al. 2008) and 6.2m (EW m, Stierwalt et al. 2013) PAH features. The WISE colour of UGC 5101 is ( mag), consistent with a significant AGN MIR emission (Stern et al. 2012). In the optical the source is reported as being a Seyfert 2 (Yuan et al. 2010).
Chandra and XMM-Newton observations of this object were studied by Imanishi et al. (2003), who found that the AGN is CT. UGC 5101 was also reported as CT by Ricci et al. (2015) analyzing XMM-Newton and Swift/BAT data. This in agreement with the depth of the 9.7m silicate feature (=-0.78, Stierwalt et al. 2013), which could also suggest the presence of a buried AGN. A recent study carried out by Oda et al. (2016), who studied in detail observations of this object carried out by Chandra, XMM-Newton, Suzaku and NuSTAR, confirmed the CT obscuration of the source ().
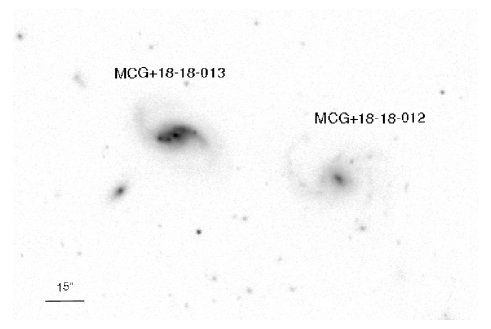
A.9 IRAS F09333+4841 (MCG+0818013 & MCG+0818012)
These two merger stage A galaxies have a projected separation of 35.4 kpc (Fig. 5). While MCG+0818013 is classified as a LIRG, the IR luminosity of MCG+0818012 is . MCG+0818013 is classified as a composite galaxy by Yuan et al. (2010), and none of the multi-wavelength tracers identify an AGN in the system.
The two galaxies are separated by 66.5″, and could therefore be clearly resolved by both Chandra and NuSTAR. In each of the 0.3–2 keV and 3–8 keV Chandra images, only MCG+0818013 is detected, showing extended emission in both bands. Neither nucleus is detected by NuSTAR in the 3–10 keV or 3–24 keV bands. The X-ray spectral analysis was carried out using the Chandra data alone. The X-ray spectrum of MCG+0818013 was fitted with an obscured power-law (zphabs po) model. We found that the level of obscuration is low () and the X-ray continuum is rather steep (). No additional thermal component is necessary, and the X-ray spectrum is fully consistent with a scenario in which star formation is the only mechanism producing X-ray emission. The X-ray spectrum of MCG+0818013 is shown in Fig. 13.
A.10 IRAS F100150614 (NGC 3110 & MCG0126013)
This system includes two galaxies in a merger stage A, with a projected separation of 37.7 kpc (Fig. 5). Of the two galaxies, only NGC 3110 is a LIRG. NGC 3110 is classified as a HII-region by Yuan et al. (2010), and no trace of an AGN is evident for NGC 3110 and MCG0126013 from any of the multi-wavelength properties.
The two galaxies are separated by 108.9″, and could therefore be clearly resolved by both Chandra and NuSTAR. Neither nucleus is detected by NuSTAR in the 3–10 keV or 10–24 keV band. The combined Chandra/ACIS and XMM-Newton/EPIC X-ray spectrum of NGC 3110 could be well fit by an absorbed collisionally ionised plasma plus a power law [zphabs*(zpowerlaw+apec)]. We applied a similar model to MCG0126013, although this object did not require the presence of absorbing material along the line of sight (zpowerlaw+apec). For both sources the X-ray spectral analysis does not require the presence of an AGN. The X-ray spectra of these two sources are illustrated in Fig. 14.
A.11 IRAS F102574339 (NGC 3256)
NGC 3256 is a LIRG in stage D (Fig. 5), with two nuclei detected in the radio (Norris & Forbes 1995) with a projected separation of 1 kpc. None of the multi-wavelength proxies of AGN activity indicate the presence of an accreting SMBH, and the optical spectrum has been classified as that of an HII-region (Lípari et al. 2000).
The Chandra spectrum was studied by Lira et al. (2002a) who could detect both nuclei (separated by 5.1″), and found X-ray emission consistent with being purely from star formation. The spectrum is in fact very soft, and could be modelled by the superposition of three thermal plasma components or by a steep power law with a photon index . NGC 3256 was observed by NuSTAR, and the results were reported in Lehmer et al. (2015), who concluded that the emission at keV detected by NuSTAR is produced by a population of 5–10 ultra-luminous X-ray sources.
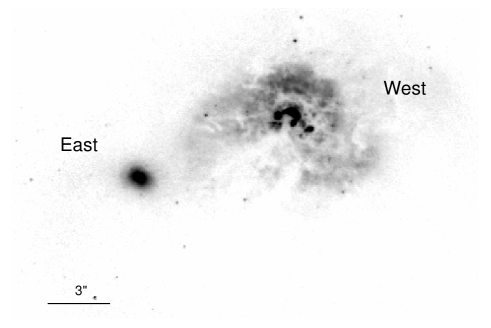
A.12 IRAS 10565+2448
IRAS 10565+2448 is a ULIRG in stage D (Fig. 5) showing two nuclei (east and west components) with a projected separation of 6.7 kpc (Scoville et al. 2000). The west component was classified as a composite galaxy in the optical by Yuan et al. (2010), and no evidence of AGN activity has been found from the multi-wavelength properties of the object.
The two nuclei are separated by 7.4″, and Chandra observations could be able to resolve both of them. The source was detected in the X-rays by Chandra and XMM-Newton (Teng & Veilleux 2010; Iwasawa et al. 2011b), and the spectra were found to be consistent with a star-formation origin of the X-ray emission. The galaxy was not detected in a 25 ks NuSTAR observation (Teng et al. 2015).
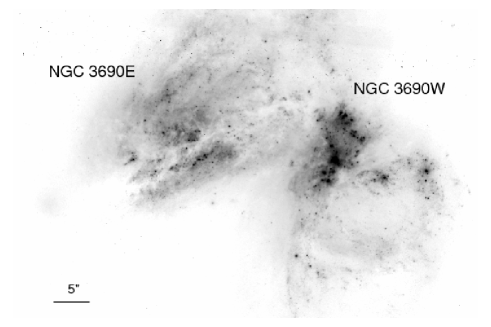
A.13 IRAS F11257+5850 (Arp 299)
Arp 299 is a LIRG in merger stage C, with two nuclei (NGC 3690W and NGC 3690E) at a projected separation of 4.6 kpc (Fig. 6). The eastern nucleus is often confused with IC 0694, which is a lenticular galaxy nearby. Both nuclei show signatures of AGN activity in different energy bands. NGC 3690W has a weak 3.3m PAH feature (EW nm; Imanishi et al. 2010) and a red 2.5-5 m continuum (; Imanishi et al. 2010). A red near-IR continuum is also found for NGC 3690E (; Imanishi et al. 2010). The WISE colours of both nuclei are also consistent with AGN activity, being ( mag) and ( mag) for NGC 3690W and NGC 3690E, respectively. In the MIR the 6.2m PAH feature is rather weak for both NGC 3690W (EWm; Stierwalt et al. 2013) and NGC 3690E (EWm; Stierwalt et al. 2013), and indicates AGN contributions to the MIR luminosities of each nucleus of and (Stierwalt et al. 2013), respectively. In the optical Yuan et al. (2010) classified NGC 3690W as a Seyfert 2 and NGC 3690E as a HII-region.
The two nuclei are separated by 21.3″, and could be resolved in the X-ray band by several studies carried out in the past decade. The presence of a buried AGN in NGC 3690W was first found by Della Ceca et al. (2002) using BeppoSAX data. Combining BeppoSAX with Chandra and XMM-Newton observations, Ballo et al. (2004) confirmed the heavily obscured nature of the western component, detecting a prominent Fe K line. Ballo et al. (2004) also argued for the presence of a CT AGN in NGC 3690E, which shows a strong Fe XXV line at 6.7 keV. Alonso-Herrero et al. (2013), using the CanariCam instrument on the 10.4 m Gran Telescopio Canarias found evidence of AGN activity in both nuclei. For NGC 3690E they estimated that the AGN is times less luminous than NGC 3690W and the material surrounding the SMBH has an extinction of mag. More recently, studying the simultaneous NuSTAR and Chandra spectra of NGC 3690W in the keV range, Ptak et al. (2015) found a column density of . No evidence of X-ray emission above 10 keV from NGC 3690E was found, and Ptak et al. (2015) concluded that the AGN is heavily obscured and/or significantly less luminous than NGC 3690W. Both NGC 3690W and NGC 3690E show deep silicate features ( and , respectively; Stierwalt et al. 2013), consistent with a buried AGN scenario.
A.14 IRAS F120433140 (ESO 440IG058N & ESO 440IG058S)
The two objects are in merger stage B, and their projected separation is 5.9 kpc (Fig. 6). The northern source is a LIRG, while the southern source has an IR luminosity of . In the optical ESO 440IG058N has been classified as a HII-region, while ESO 440IG058S as a composite system (Yuan et al. 2010). Both galaxies show strong m PAH features (EW and 0.66 m for ESO 440IG058N & ESO 440IG058S, respectively; Stierwalt et al. 2013), and none of the tracers considered demonstrate the presence of an AGN.
The two sources are at 12″, and both have been detected by Chandra. No source was detected by NuSTAR at the position of the system, and therefore the spectral analysis was carried out using only Chandra. The X-ray spectrum of ESO 440IG058N was fitted using a simple power law model, with no absorption required (zpowerlaw). The model used for ESO 440IG058S takes into account thermal emission and a power-law component (zpowerlaw+apec). Both sources are consistent with no AGN contribution in the X-ray band, and their X-ray spectra are shown in Fig. 14.
A.15 IRAS F12540+5708 (Mrk 231)
Mrk 231 is an ULIRG with a single nucleus in merger stage D (Fig. 6), and notably is the nearest broad-absorption line quasar. While the MIR spectrum of the source does not show evidence of [Ne V] emission lines (Pereira-Santaella et al. 2010; Inami et al. 2013), the presence of a luminous AGN is inferred from the weak 3.3m (EW nm, Imanishi et al. 2010) and 6.2m (EW m, Stierwalt et al. 2013) PAH features and from the MIR colours (). In the optical band the source is classified as a Seyfert 1 (Yuan et al. 2010). Studying several different tracers of AGN emission, Veilleux et al. (2009) found that the AGN contributes to of the bolometric output of the system. A lower value () was obtained by Nardini et al. (2010) using spectral decomposition. Mrk 231 is also known to have a strong kpc-scale outflow (Rupke & Veilleux 2013; Feruglio et al. 2015), which has been interpreted as proof of quasar-mode feedback (Feruglio et al. 2010).
The broad-band 0.5–30 keV NuSTAR and Chandra spectrum of the source was studied by Teng et al. (2014), who found that the primary X-ray continuum is flat, and the X-ray source is obscured by Compton-thin material. Teng et al. (2014) found that the source is X-ray weak, with the 2–10 keV to bolometric luminosity ratio being (compared to a typical value for local Seyferts of , e.g., Vasudevan & Fabian 2007). The values of the column density were found to vary between the 2003 Chandra () and the 2012 Chandra/NuSTAR () observations. Since we are interested in studying the global properties of AGN in mergers, here we used the average of the two values of the column density.
A.16 IRAS F12590+2934 (NGC 4922N & NGC 4922S)
This merger stage C system includes a LIRG (NGC 4922N) and a nucleus significantly weaker in the IR [NGC 4922S, ]. The two nuclei have a projected separation of 10.8 kpc (Fig. 6). Significant [Ne V] 14.32m emission is observed from the system (Inami et al. 2013), while only an upper limit was reported for the 24.32m line (Pereira-Santaella et al. 2010). The presence of an AGN in the northern nucleus is suggested by the WISE colours (, mag), while the southern nucleus does not present evidence of a dominating AGN component in the MIR (). The system is classified as a Seyfert 2 (Yuan et al. 2010), and shows a weak 6.2m PAH feature (EWm; Stierwalt et al. 2013). The depth of the 9.7m silicate feature is (Stierwalt et al. 2013), possibly indicating a buried AGN.
The two nuclei are at a distance of 21.2″, and could be well resolved by Chandra. While in the optical NGC 4922S is significantly brighter than NGC 4922N, the galaxy is detected by Chandra only in the 0.3–2 keV band. NGC 4922N is detected both in the 0.3–2 and 2–10 keV band. A source at a position coincident with NGC 4922N is detected by NuSTAR at 4.2 and 4.6 in the 3–10 keV band for FPMA and FPMB, respectively. In the 10–24 keV band the system is detected at 3.3 in both detectors. Considering the position of the NuSTAR source, the fact that NGC 4922S is not detected in the 2–10 keV, and the similar flux level of the NuSTAR source with NGC 4922N in the overlapping energy band, we conclude that the source detected by NuSTAR is NGC 4922N. The X-ray spectrum of NGC 4922N shows a prominent Fe K line at keV. Fitting the combined 2–24 keV Chandra/NuSTAR spectrum with a power-law plus a Gaussian line, we find that the line has an equivalent width of keV and the X-ray continuum is very hard (). Using the Torus model together with a scattered component and a thermal plasma (zpowerlaw+atable{torus1006.fits} + zphabsapec) we find that the X-ray source is CT (), in agreement with the flat X-ray spectrum and the strong Fe K line. The torus half-opening angle could not be constrained, and was therefore fixed to deg in the model. The fraction of scattered radiation is . The broad-band X-ray spectrum of NGC 4922N is shown in Fig. 14.
A.17 IRAS 131205453
This ULIRG in merger stage D shows a single nucleus (Fig. 6). The presence of an AGN is inferred from the WISE colours (, mag) and from the Seyfert 2 optical classification (Véron-Cetty & Véron 2010). The spectral decomposition study of Nardini et al. (2010) found that the AGN does not contribute significantly to the bolometric output of the system ().
A.18 IRAS F131971627 (MCG0334064 & MCG0334063)
This system is composed of the LIRG MCG0334064, and the normal galaxy MCG0334063. The two galaxies are located at a projected distance of 37.7 kpc, and are reported as being in merger stage A. The presence of an AGN in MCG0334064 is confirmed by the detection of the 14.32m and 24.32m [Ne V] emission lines (Pereira-Santaella et al. 2010; Inami et al. 2013), and by the very weak (EWm) 6.2m PAH feature (Stierwalt et al. 2013). The optical spectrum of this source is consistent with that of an HII-region (Yuan et al. 2010).
The two galaxies are separated by 106.2″, and could be clearly resolved by XMM-Newton/EPIC. While, MCG0334063 is not detected in the X-rays, MCG0334064 is clearly detected by XMM-Newton, and it was associated to the Swift/BAT source. The X-ray spectrum of MCG0334064 is dominated by the emission from the AGN (Miniutti et al. 2007). We fitted the combined XMM-Newton EPIC and Swift/BAT spectra with a model that includes both absorption and reflection from a torus, a scattered component, three thermal plasmas and two Gaussian lines (atable{torus1006.fits} + 3apec + 2zgauss + zpowerlaw; Fig. 14). We find that, in agreement with the results of Miniutti et al. (2007), the X-ray source is obscured by Compton-thin material (). The half-opening angle of the torus is deg, while only an upper limit is obtained for the fraction of scattered radiation (%). The two Gaussian lines have energies of and keV, with an equivalent width of eV and eV, respectively.
A.19 IRAS 134285608 (Mrk 273)
The ULIRG Mrk 273 is a late merger system (stage D, Fig. 7) composed of two nuclei located separated by 0.7 kpc from each other (Scoville et al. 2000). The MIR spectrum of the source shows a 14.32m [Ne V] emission line (Inami et al. 2013). The presence of an AGN is confirmed by the WISE colour (, mag), by radio spectral index maps (Vardoulaki et al. 2015) and by the weak 6.2m PAH feature (EW m, Stierwalt et al. 2013). The source is classified as a Seyfert 2 in the optical (Veilleux et al. 1999).
Iwasawa et al. (2011a) discussed the analysis of the Chandra observations of the two nuclei (separated by 0.9″), and their analysis indicated that the AGN coincides with the south-western nucleus, while the northern nucleus contains a powerful starburst which dominates the far infrared emission. However, the extended emission in the 6–7 keV range in direction of the northern nucleus might imply the presence of a second obscured AGN. Mrk 273 was clearly detected by NuSTAR in a ks observation carried out in late 2013. The broad-band XMM-Newton/NuSTAR X-ray spectrum of this object was recently studied by Teng et al. (2015), who found that the X-ray source is obscured by material with a column density of .
A.20 IRAS 143783651
IRAS 143783651 is a ULIRG in merger stage D with a single nucleus (Fig. 7). The 14.32m and 24.32m [Ne V] lines are not detected (Pereira-Santaella et al. 2010; Inami et al. 2013). The WISE colour is above the threshold for AGN activity (, mag), while from the EW of the 6.2m feature (m) Stierwalt et al. (2013) estimate a contribution of the AGN to the MIR flux of . The study of Nardini et al. (2010), based on spectral decomposition, finds a significantly lower contribution from the AGN to the bolometric luminosity (). In the optical band IRAS 143783651 has been classified as a LINER by Kim & Sanders (1998) and as a Seyfert 2 by Duc et al. (1997).
The source was detected by Chandra, and Iwasawa et al. (2011b) argued that the hard X-ray colour implies the presence of an AGN with a relatively low 2–10 keV luminosity. From the small ratio between the 2–10 keV and the IR luminosity, Iwasawa et al. (2011b) proposed that the AGN is a CT candidate. The source was observed by NuSTAR for 24.5 ks, and was weakly detected only in the 3–10 keV band (Teng et al. 2015), thereby providing no additional constraints beyond those obtained by Chandra.
A.21 IRAS F145444255 (IC 4518A & IC 4518B)
IRAS F145444255 is a LIRG which is composed of two galaxies (IC 4518A & IC 4518B) at a projected separation of 12.0 kpc (Fig. 7). The system is classified as an early merger (stage B). Both the 14.32m and the 24.32m [Ne V] emission lines are observed in the MIR spectrum of IC 4518A, while they are not detected in that of IC 4518B (Pereira-Santaella et al. 2010; Inami et al. 2013). The 6.2m PAH feature of IC 4518A is very weak (EWm), but is significantly stronger in IC 4518B (EWm). The WISE colour confirms the presence of an AGN in IC 4518A (, mag), and the galaxy is also classified as a Seyfert 2 in the optical (Masetti et al. 2008). From spectral decomposition, Hernán-Caballero et al. (2015) found that the contribution from the AGN in IC 4518A to the MIR flux is .
The two galaxies are both detected by XMM-Newton/EPIC and are at from each other, so that we used a radius of 5 arcsec (20 arcsec) for the spectral extraction of IC 4518B (IC 4518A). IC 4518A was significantly detected both by EPIC/PN and MOS1 on board XMM-Newton and by NuSTAR. The EPIC/MOS2 spectrum could not be extracted since the inner chip where the source was located was not available during this observation. The spectrum was fitted with the same model we used for other AGN (atable{torus1006.fits} + apec + zpowerlaw). The model reproduces well the X-ray spectrum, and we find a column density of in the direction of the X-ray source. The fraction of scattered radiation is , and only an upper limit is obtained for the half-opening angle of the torus ( deg). We found that the cross-correlation constant for the EPIC/PN and MOS1 spectra is , which implies that the source was times dimmer than at the time of the NuSTAR observation. IC 4518B is detected only by EPIC/PN. Due to the low signal-to-noise ratio the spectrum was rebinned to 1 count per bin and we applied Cash statistics. The X-ray spectrum shows a strong Fe K line at keV (EW eV), and a very flat 2–10 keV continuum (), both clear indications of the presence of a buried AGN. We applied the same model as for IC 4518A, with the addition of an absorption component for the thermal plasma and the scattered component [atable{torus1006.fits} + zphabs(apec + zpowerlaw)]. Due to the low signal-to-noise ratio the photon index was fixed to and the half-opening angle of the torus to 60 deg. We found that the source is obscured by material with a column density of , and the scattered flux is of the primary X-ray emission. The observed flux of IC 4518B is of that of IC 4518A in the 3–10 and 10–24 keV bands, so that its contribution to the NuSTAR spectrum can be safely ignored. The spectra of IC 4518A and IC 4518B are shown in Fig. 15.
A.22 IRAS F15327+2340 (Arp 220W & Arp 220E)
Arp 220 is the nearest ULIRG, and is in merger stage D with two nuclei (east and west) separated by only 0.4 kpc (Fig. 7). The presence of at least one AGN in this system has been confirmed by several pieces of observational evidence. The western nucleus is classified as a Seyfert 2 by optical spectroscopy (Yuan et al. 2010). The system shows a weak 6.2m PAH feature (EWm, Stierwalt et al. 2013), which could imply an AGN contribution of to the MIR flux. Using six multi-wavelength tracers, Veilleux et al. (2009) found that the AGN contributes to of the bolometric flux. A similar value () was obtained by Nardini et al. (2010) through spectral decomposition. Studies carried out using CO have confirmed that the western nucleus hosts a deeply buried AGN, with a total column density of (Downes & Eckart 2007; Scoville et al. 2015). Consistent with this, Stierwalt et al. (2013) found that this source exhibits a deep 9.7m silicate absorption feature ().
The two nuclei are separated by 1″, and Chandra observations have shown that the peak of the 2–7 keV emission is in the western nucleus (Iwasawa et al. 2011b), while no emission is observed in the same band where the eastern nucleus lies. In the X-ray band Arp 220 has been shown to have a flat X-ray continuum (, Ptak et al. 2003; Iwasawa et al. 2005) and a strong emission line at 6.7 keV (EW keV, Iwasawa et al. 2005). NuSTAR detected X-ray emission from Arp 220 up to 20 keV (Teng et al. 2015), and using a torus model yields only a lower limit on the column density of , consistent with the results obtained by CO studies. Teng et al. (2015) discuss that the X-ray spectrum could also be well reproduced by a combination of thermal plasma models. However, given the strong evidence for an AGN obtained at other wavelengths, we consider here that the hard X-ray emission is produced by the AGN in Arp 220W.
A.23 IRAS 165040228 (NGC 6240N and NGC 6240S)
IRAS 165040228 is a LIRG in merger stage D with two nuclei (NGC 6240N and NGC 6240s) separated by 0.7 kpc (Fig. 7). The system shows a 14.32m [Ne V] emission line, and in the optical is classified as a LINER (Yuan et al. 2010). The contribution of AGN activity to the bolometric luminosity has been estimated to be (Veilleux et al. 2009).
The two nuclei are separated by 1.4″, and were both detected by Chandra observations (Komossa et al. 2003). The presence of an AGN has been confirmed by several studies carried out in the X-ray band (Iwasawa & Comastri 1998; Vignati et al. 1999; Lira et al. 2002b). Chandra observations have shown that NGC 6240S is brighter than NGC 6240N, and that both nuclei host CT AGN (Komossa et al. 2003). Combining Chandra, XMM-Newton and BeppoSAX data with recent NuSTAR observations, Puccetti et al. (2016) found that both NGC 6240S () and NGC 6240N () host CT AGN.
A.24 IRAS F16577+5900 (NGC 6286 & NGC 6285)
IRAS F16577+5900 is a system composed of a LIRG (NGC 6286) and its companion (NGC 6285), which is significantly less luminous in the IR []. The two galaxies are in merger stage B and are separated by 35.8 kpc (Fig. 7). None of the tracers of AGN activity show evidence of an accreting SMBH in either nucleus, with the possible exception of faint 14.32m and 24.32m [Ne V] emission lines in NGC 6286 (Dudik et al. 2009). The detection of these lines, however, was questioned by Inami et al. (2013). Optically, NGC 6286 is classified as a composite (Yuan et al. 2010). Studying the multi-wavelength SED of NGC 6286, Vega et al. (2008) found that an AGN might contribute to of the MIR emission of the galaxy.
Given the separation between the two sources (91.1″), they could be well resolved by XMM-Newton/EPIC, Chandra and NuSTAR observations. A joint analysis of XMM-Newton, Chandra and NuSTAR observations of this system has shown that NGC 6286 contains a buried AGN (Ricci et al. 2016b), with a column density of . NGC 6285 was not detected by NuSTAR, and the Chandra spectrum is well reproduced by a single power-law model (zpowerlaw; Fig. 15).
A.25 IRAS F171381017
The LIRG IRAS F171381017 is a coalesced merger (stage D) showing only one nucleus (Fig. 8). None of the multi-wavelength tracers find any evidence of AGN activity in this system, which is optically classified as a composite (Yuan et al. 2010).
The source was detected by NuSTAR at the 4.3 and 5 levels in the 3–10 keV band for FPMA and FPMB, respectively, but remains undetected in the 10-24 keV band. Given the non-detection above 10 keV we modelled only the 3–10 keV region of the NuSTAR spectrum. The combined Chandra and NuSTAR spectra can be well fit with a simple power-law model (zpowerlaw) with a photon index of . This is harder than the typical X-ray emission observed for star-forming regions. While we cannot exclude the presence of a low-luminosity or heavily obscured AGN in this object, both the multi-wavelength tracers and the low 2–10 keV X-ray luminosity [] are consistent with a star-forming galaxy. The X-ray spectrum of the source is shown in Fig. 15.
A.26 IRAS 20264+2533 (MCG +0448002 & NGC 6921)
IRAS 20264+2533 is an early merger (stage A) composed of two galaxies with a projected separation of 27.1 kpc: NGC 6921 and the LIRG MCG +0448002 (Fig. 8). The presence of an AGN in MCG +0448002 is suggested by the detection of [Ne V] 14.32m, although the source is found to be an HII-region in the optical (Masetti et al. 2006).
The two galaxies are separated by 91.4″, and could therefore be resolved by both XMM-Newton/EPIC and NuSTAR observations. X-ray observations of these two sources were recently discussed by Koss et al. (2016b), who found both sources to host obscured AGN. Both objects show Fe K lines at 6.4 keV, and this feature is particularly prominent in NGC 6921. We studied the combined XMM-Newton and NuSTAR spectrum of each source using the same combination of models applied to other AGN (zpowerlaw+atable{torus1006.fits}+apec). For MCG +0448002 we found that the flux of the primary X-ray emission during the NuSTAR observation was about one fourth of that measured by the XMM-Newton observation (the cross-calibration constants were and for FPMA and FPMB, respectively). The X-ray source is obscured by material with a column density of , while the ratio between scattered radiation and primary X-ray emission is found to be . We also constrain the half-opening angle of the torus to be deg. Previous observations of NGC 6921 found that the galaxy hosts a CT AGN (Ricci et al. 2015; Koss et al. 2016b). Our spectral analysis confirms this result. Applying the same model we used for MCG +0448002, we obtained a column density in the direction of the X-ray source of . The scattered radiation is of the primary component, while the half-opening angle of the torus is deg. The broad-band X-ray spectra of these two sources are shown in Fig. 15.
A.27 IRAS F214533511 (NGC 7130)
The LIRG IRAS F214533511 is in merger stage D with a single nucleus (Fig. 8). The MIR spectrum of the source shows [Ne V] 14.32m and 24.32m emission lines (Pereira-Santaella et al. 2010; Inami et al. 2013), clear indications of AGN activity. The galaxy is classified as a Seyfert 2 (Yuan et al. 2010), and from the 6.2m PAH feature Stierwalt et al. (2013) suggested that the AGN contributes of the MIR flux. From spectral decomposition, Hernán-Caballero et al. (2015) concluded that of the MIR luminosity is due to the AGN.
Studying a Chandra observation, Levenson et al. (2005) found that the galaxy hosts a CT AGN. This was also confirmed by Gilli et al. (2010) using the X-ray to [Ne V]3426 flux ratio. Our analysis of the combined Chandra and NuSTAR spectrum confirms the heavy obscuration of this source, which shows a very strong Fe K line at 6.4 keV (EW keV). Using the torus model plus two different thermal plasmas [zpowerlaw+atable{torus1006.fits} + zphabs(apec+apec)] we found a column density of and that of the primary X-ray radiation is scattered. Only an upper limit for the half-opening angle of the torus could be obtained by our analysis ( deg). The broad-band X-ray spectrum of NGC 7130 is presented in Fig. 16.
A.28 IRAS F23007+0836 (NGC 7469 and IC 5283)
IRAS F23007+0836 is a system composed of a pair of galaxies in an early merger (stage A) at a projected distance of 26 kpc (Fig. 8). NGC 7469 is a LIRG, while IC 5283 has a lower IR luminosity (). The presence of an AGN in NGC 7469 has been confirmed by several tracers. The MIR spectrum shows both 14.32m and 24.32m [Ne V] emission lines (Pereira-Santaella et al. 2010; Inami et al. 2013), and weak 3.3m (EW nm) and 6.2m (EWm) PAH features (Yamada et al. 2013; Stierwalt et al. 2013). The AGN is optically classified as a Seyfert 1 (Yuan et al. 2010), and it has been estimated that it contributes of the MIR flux.
The two galaxies are separated by 79.7″, and could therefore be resolved by XMM-Newton/EPIC, NuSTAR and Swift/XRT observations. Previous X-ray studies of NGC 7469 carried out using XMM-Newton (Blustin et al. 2003; Scott et al. 2005) and Suzaku (Walton et al. 2013) have shown that the AGN is obscured only by ionised material, in agreement with the optical classification. To constrain the level of obscuration of the source we studied the combined XMM-Newton and Swift/BAT spectrum. Data from EPIC/MOS were not used because the inner chips of MOS1 and MOS2 were missing during the observation. We used a model that considers reprocessed X-ray emission from a slab [pexrav, (Magdziarz & Zdziarski 1995)], a Gaussian line for the Fe K emission (zgauss), a soft excess in the form of a blackbody (bbody) and ionised absorption (zxipcf). The model we used is zxipcf(bbody + zgauss + zxipcfpexrav). We find that the neutral column density in the direction of the source is extremely low [], and the Fe K line at keV is relatively weak (EW eV). The two ionised absorbers have column densities of and , ionization parameters of and , and cover a fraction of and of the X-ray source. The temperature of the blackbody component is eV, while the reflection parameter is . The X-ray spectrum of NGC 7469 is shown in Fig. 16.
The EPIC/PN observation of IRAS F23007+0836 was carried out in small-window mode, and therefore IC 5283 fell outside of the limited FOV of this XMM-Newton observation. We therefore analysed the Swift/XRT image of the field, but found that IC 5283 is not detected either in the 0.3–2 keV or in the 2–10 keV band.
A.29 IRAS F23254+0830 (NGC 7674 & NGC 7674A)
IRAS F23254+0830 is a galaxy pair in merger stage A, with the two galaxies having a separation of kpc (Fig. 8). NGC 7674 is a LIRG, while NGC 7674A has an IR luminosity of . The presence of an AGN in NGC 7674 is confirmed by several proxies. Both [Ne V] 14.32m and 24.32m are significantly detected (Pereira-Santaella et al. 2010; Inami et al. 2013). The WISE colour is above the threshold (, mag), and the NIR slope shows a red continuum (, Imanishi et al. 2010). Both the 3.3m (EW nm) and the 6.2m (EWm) PAH features are weak (Imanishi et al. 2010; Stierwalt et al. 2013). Optical spectroscopy studies have classified NGC 7674 as a Seyfert 2 (Yuan et al. 2010).
NGC 7674A, which is located at 34.1″from NGC 7674, is not detected in the X-ray band by observations carried out with Swift/XRT, which would be able to resolve the two sources (Gandhi et al. 2016). A NuSTAR observation of NGC 7674, combined with Suzaku/XIS and Swift/XRT observations, was recently studied by Gandhi et al. (2016). In this work it was found that, although the Fe K line is relatively weak (EW eV), the AGN is CT and possibly reflection dominated, with a line-of-sight column density of .
A.30 IRAS 23262+0314 (NGC 7679 and NGC 7682)
IRAS 23262+0314 is a system in an early merger (stage A) with the two galaxies (NGC 7679 and NGC 7682) separated by 97.3 kpc (Fig. 8). NGC 7679 is a LIRG which shows a 14.32 m [Ne V] emission line (Inami et al. 2013) and is optically classified as a Seyfert 2 (Yuan et al. 2010). Spectral decomposition studies have shown that the AGN in this galaxy could contribute to of the MIR emission (Hernán-Caballero et al. 2015). NGC 7682 is not a luminous IR source and is optically classified as a Seyfert 2 (Huchra & Burg 1992).
The two galaxies are separated by 269.7″, and could be well resolved by the XMM-Newton observations analysed here. NGC 7679 was found to be unobscured with a luminosity of in the analysis of a BeppoSAX observation (Risaliti 2002; Dadina 2007). The X-ray luminosity is above the threshold typically used to separate AGN from starbursts in the 2–10 keV band (; Kartaltepe et al. 2010). In a subsequent XMM-Newton observation we found the X-ray source was about ten times dimmer in the 2–10 keV band (), and the spectrum could be well modeled with a power-law component, plus a thermal component, a Gaussian line and neutral absorption [zphabs(apec+po+zgauss)]. We confirm that the source is unobscured and find that the Gaussian line has an energy of keV and an equivalent width of eV. The strong X-ray variability indicates the presence of an AGN. Using the relation of Ranalli et al. (2003), we find that a star formation rate of is needed to account for the 2–10 keV luminosity of the source at the time of the XMM-Newton observation. This is times larger than the value obtained from H (, Davies et al. 2016) and times that inferred from the 3.6m and 8m images (, Davies et al. 2016). The star formation rate needed to reproduce the X-ray luminosity found by Dadina (2007) would be , times larger than the value observed. We therefore conclude that most of the X-ray emission observed is most likely due to the AGN. NGC 7682 is a known CT AGN (Singh et al. 2011; Ricci et al. 2015). We analysed the XMM-Newton of this object using a torus model plus scattered emission and a thermal plasma [zpowerlaw+atable{torus1006.fits}+zphabsapec]. Our analysis confirms that the X-ray source is CT, with a column density of . We find that the half-opening angle of the torus is deg and % of the primary radiation is scattered. The X-ray spectra of NGC 7679 and NGC 7682 are illustrated in Fig. 16.
Appendix B X-ray spectra
The X-ray spectra and the best-fit models are illustrated in Figures 13–16. For visualization purposes, spectra are typically rebinned to have at least a significance of per bin.
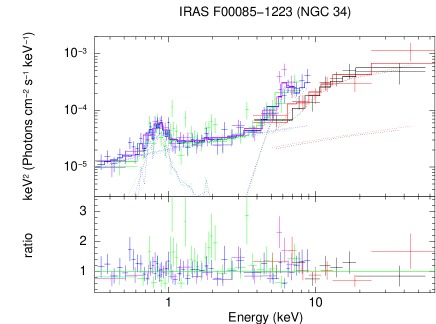
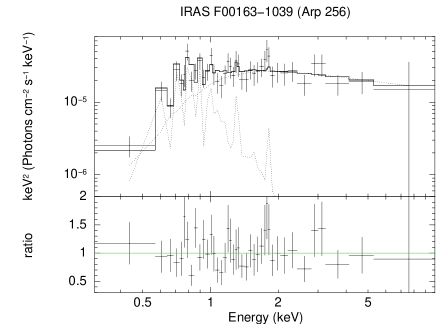

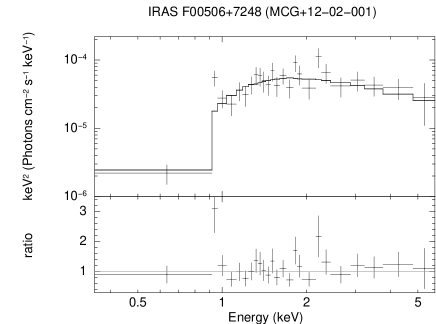
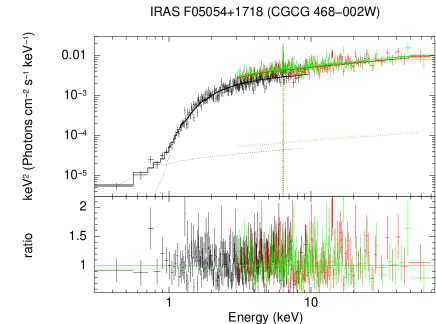
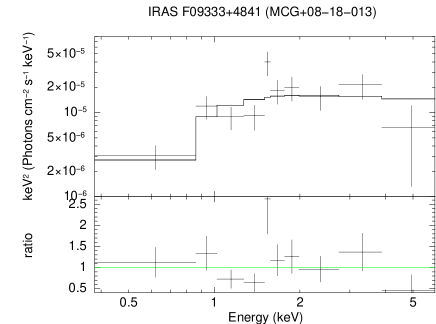
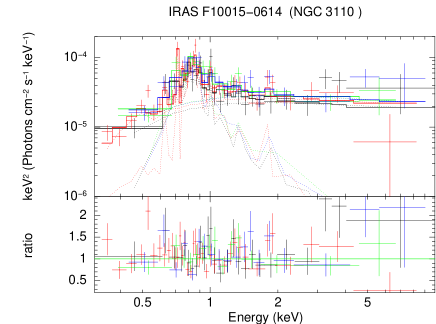
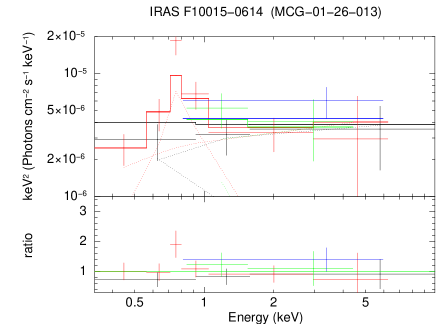
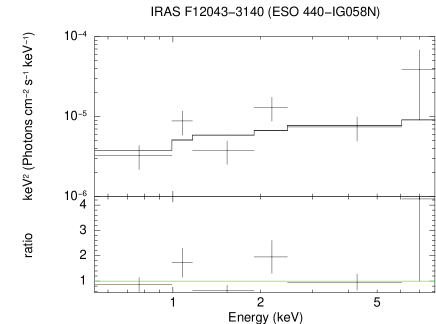

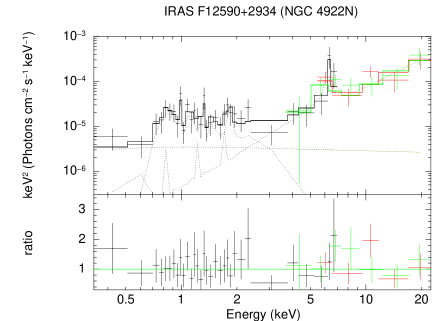
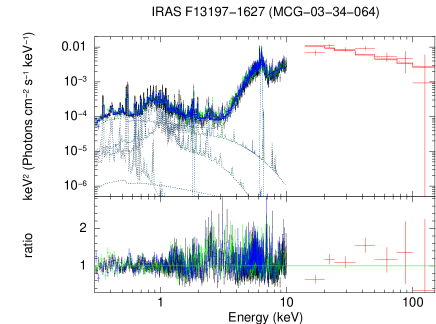
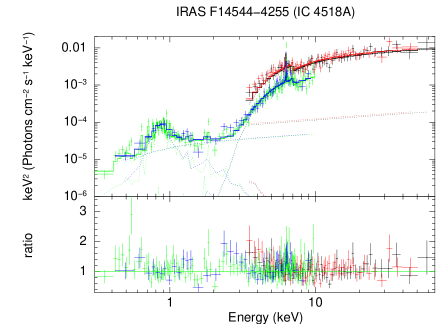
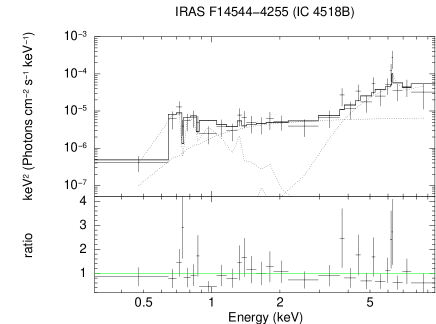
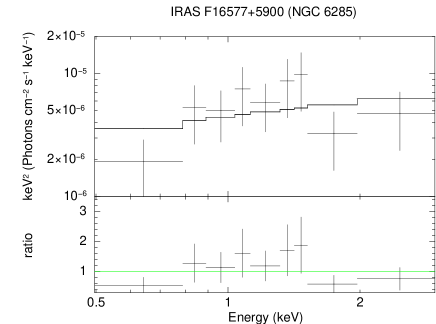
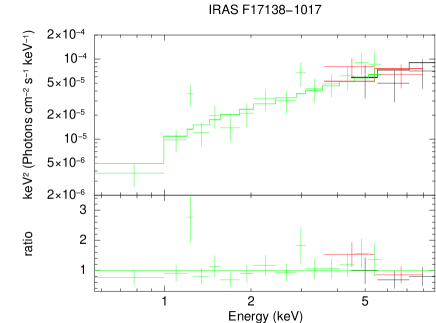
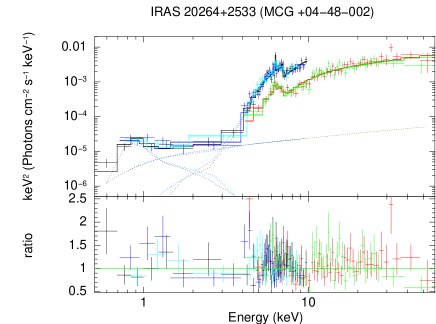
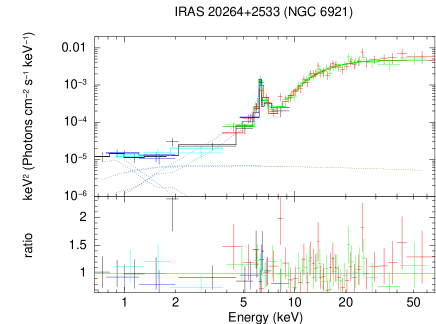
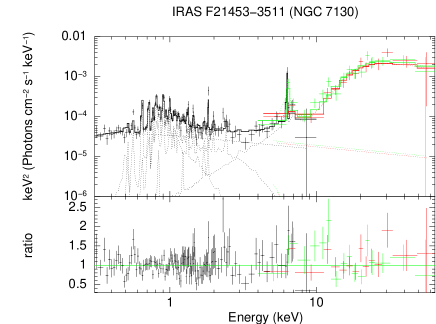
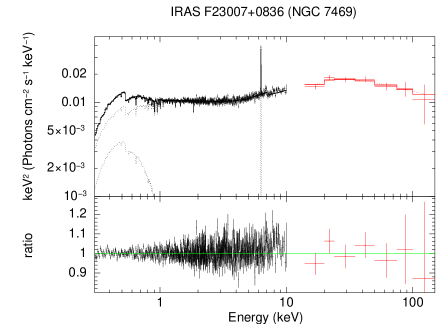
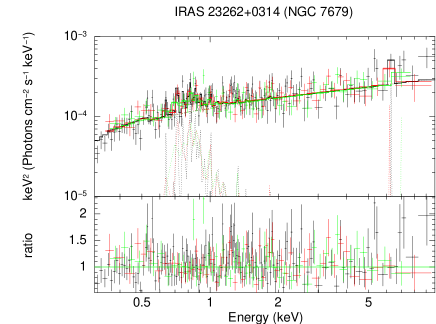
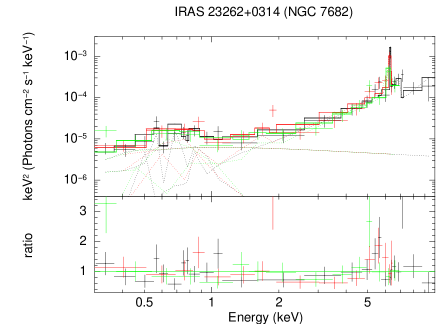
Acknowledgements
We thank the referee for the careful reading of the manuscript and for the prompt report that helped us improve the quality of the paper. We thank the NuSTAR Cycle 1 TAC for the NuSTAR data on which this paper is based, Chin-Shin Chang, George Lansbury, Dave Alexander and Johannes Buchner for useful comments on the manuscript. This work made use of data from the NuSTAR mission, a project led by the California Institute of Technology, managed by the Jet Propulsion Laboratory, and funded by the National Aeronautics and Space Administration. We thank the NuSTAR Operations, Software and Calibration teams for support with the execution and analysis of these observations. This research has made use of the NuSTAR Data Analysis Software (NuSTARDAS) jointly developed by the ASI Science Data Center (ASDC, Italy) and the California Institute of Technology (Caltech, USA), and of the NASA/ IPAC Infrared Science Archive and NASA/IPAC Extragalactic Database (NED), which are operated by the Jet Propulsion Laboratory, California Institute of Technology, under contract with the National Aeronautics and Space Administration. We acknowledge financial support from the CONICYT-Chile grants “EMBIGGEN” Anillo ACT1101 (CR, FEB, ET), FONDECYT 1141218 (CR, FEB), FONDECYT 1160999 (ET), FONDECYT 3150361 (GP), Basal-CATA PFB–06/2007 (CR, FEB, ET), the NASA NuSTAR AO1 Award NNX15AV27G (FEB), the China-CONICYT fund (CR), the Swiss National Science Foundation (Grant PP00P2_138979/1 and PP00P2_166159, KS), the Chinese Academy of Science grant No. XDB09030102 (LH), the National Natural Science Foundation of China grant No. 11473002 (LH), the Ministry of Science and Technology of China grant No. 2016YFA0400702 (LH), the Spanish MINECO (KI) under grant AYA2013-47447-C3-2-P and MDM-2014-0369 of ICCUB (Unidad de Excelencia María de Maeztu”), and the Ministry of Economy, Development, and Tourism’s Millennium Science Initiative through grant IC120009, awarded to The Millennium Institute of Astrophysics, MAS (FEB).
References
- Aalto et al. (2015) Aalto S., Martín S., Costagliola F., et al., 2015, A&A, 584, A42
- Alonso-Herrero et al. (2009) Alonso-Herrero A., García-Marín M., Monreal-Ibero A., et al., 2009, A&A, 506, 1541
- Alonso-Herrero et al. (2013) Alonso-Herrero A., Roche P. F., Esquej P., et al., 2013, ApJ, 779, L14
- Annuar et al. (2015) Annuar A., Gandhi P., Alexander D. M., et al., 2015, ApJ, 815, 36
- Antonucci (1993) Antonucci R., 1993, ARA&A, 31, 473
- Armus et al. (2009) Armus L., Mazzarella J. M., Evans A. S., et al., 2009, PASP, 121, 559
- Arnaud (1996) Arnaud K. A., 1996, in Astronomical Data Analysis Software and Systems V, edited by G. H. Jacoby & J. Barnes, vol. 101 of Astronomical Society of the Pacific Conference Series, 17
- Assef et al. (2015) Assef R. J., Eisenhardt P. R. M., Stern D., et al., 2015, ApJ, 804, 27
- Assef et al. (2016) Assef R. J., Walton D. J., Brightman M., et al., 2016, ApJ, 819, 111
- Ballo et al. (2004) Ballo L., Braito V., Della Ceca R., Maraschi L., Tavecchio F., Dadina M., 2004, ApJ, 600, 634
- Baloković et al. (2014) Baloković M., Comastri A., Harrison F. A., et al., 2014, ApJ, 794, 111
- Banerji et al. (2012) Banerji M., McMahon R. G., Hewett P. C., et al., 2012, MNRAS, 427, 2275
- Baumgartner et al. (2013) Baumgartner W. H., Tueller J., Markwardt C. B., et al., 2013, ApJS, 207, 19
- Bessiere et al. (2012) Bessiere P. S., Tadhunter C. N., Ramos Almeida C., Villar Martín M., 2012, MNRAS, 426, 276
- Blecha et al. (in prep.) Blecha L., et al., in prep.
- Blecha et al. (2011) Blecha L., Cox T. J., Loeb A., Hernquist L., 2011, MNRAS, 412, 2154
- Blustin et al. (2003) Blustin A. J., Branduardi-Raymont G., Behar E., et al., 2003, A&A, 403, 481
- Boorman et al. (2016) Boorman P. G., Gandhi P., Alexander D. M., et al., 2016, ApJ, 833, 245
- Brightman et al. (2015) Brightman M., Baloković M., Stern D., et al., 2015, ApJ, 805, 41
- Brightman & Nandra (2011) Brightman M., Nandra K., 2011, MNRAS, 413, 1206
- Burlon et al. (2011) Burlon D., Ajello M., Greiner J., Comastri A., Merloni A., Gehrels N., 2011, ApJ, 728, 58
- Burrows et al. (2005) Burrows D. N., Hill J. E., Nousek J. A., et al., 2005, Space Sci. Rev., 120, 165
- Cameron (2011) Cameron E., 2011, PASA, 28, 128
- Cash (1979) Cash W., 1979, ApJ, 228, 939
- Chiaberge et al. (2015) Chiaberge M., Gilli R., Lotz J. M., Norman C., 2015, ApJ, 806, 147
- Costagliola et al. (2013) Costagliola F., Aalto S., Sakamoto K., et al., 2013, A&A, 556, A66
- Dadina (2007) Dadina M., 2007, A&A, 461, 1209
- Davies et al. (2016) Davies R. L., Groves B., Kewley L. J., et al., 2016, MNRAS, 462, 1616
- Davies et al. (2014) Davies R. L., Rich J. A., Kewley L. J., Dopita M. A., 2014, MNRAS, 439, 3835
- Del Moro et al. (2016) Del Moro A., Alexander D. M., Bauer F. E., et al., 2016, MNRAS, 456, 2105
- Della Ceca et al. (2002) Della Ceca R., Ballo L., Tavecchio F., et al., 2002, ApJ, 581, L9
- Di Matteo et al. (2005) Di Matteo T., Springel V., Hernquist L., 2005, Nature, 433, 604
- Díaz-Santos et al. (2013) Díaz-Santos T., Armus L., Charmandaris V., et al., 2013, ApJ, 774, 68
- Díaz-Santos et al. (2014) Díaz-Santos T., Armus L., Charmandaris V., et al., 2014, ApJ, 788, L17
- Díaz-Santos et al. (2011) Díaz-Santos T., Charmandaris V., Armus L., et al., 2011, ApJ, 741, 32
- Downes & Eckart (2007) Downes D., Eckart A., 2007, A&A, 468, L57
- Duc et al. (1997) Duc P.-A., Mirabel I. F., Maza J., 1997, A&AS, 124
- Dudik et al. (2009) Dudik R. P., Satyapal S., Marcu D., 2009, ApJ, 691, 1501
- Eisenhardt et al. (2012) Eisenhardt P. R. M., Wu J., Tsai C.-W., et al., 2012, ApJ, 755, 173
- Ellison et al. (2011) Ellison S. L., Patton D. R., Mendel J. T., Scudder J. M., 2011, MNRAS, 418, 2043
- Evans et al. (2002) Evans A. S., Mazzarella J. M., Surace J. A., Sanders D. B., 2002, ApJ, 580, 749
- Fan et al. (2016) Fan L., Han Y., Fang G., et al., 2016, ApJ, 822, L32
- Ferrarese & Merritt (2000) Ferrarese L., Merritt D., 2000, ApJ, 539, L9
- Feruglio et al. (2015) Feruglio C., Fiore F., Carniani S., et al., 2015, A&A, 583, A99
- Feruglio et al. (2010) Feruglio C., Maiolino R., Piconcelli E., et al., 2010, A&A, 518, L155
- Gabriel et al. (2004) Gabriel C., Denby M., Fyfe D. J., et al., 2004, in Astronomical Data Analysis Software and Systems (ADASS) XIII, edited by F. Ochsenbein, M. G. Allen, D. Egret, vol. 314 of Astronomical Society of the Pacific Conference Series, 759
- Gandhi et al. (2016) Gandhi P., Annuar A., Lansbury G. B., et al., 2016, ArXiv e-prints
- Gandhi et al. (2014) Gandhi P., Lansbury G. B., Alexander D. M., et al., 2014, ApJ, 792, 117
- Garmire et al. (2003) Garmire G. P., Bautz M. W., Ford P. G., Nousek J. A., Ricker Jr. G. R., 2003, in X-Ray and Gamma-Ray Telescopes and Instruments for Astronomy., edited by J. E. Truemper, H. D. Tananbaum, vol. 4851 of Society of Photo-Optical Instrumentation Engineers (SPIE) Conference Series, 28–44
- Gebhardt et al. (2000) Gebhardt K., Bender R., Bower G., et al., 2000, ApJ, 539, L13
- Gilli et al. (2010) Gilli R., Vignali C., Mignoli M., Iwasawa K., Comastri A., Zamorani G., 2010, A&A, 519, A92
- Glikman et al. (2015) Glikman E., Simmons B., Mailly M., Schawinski K., Urry C. M., Lacy M., 2015, ApJ, 806, 218
- González-Martín et al. (2016) González-Martín O., Hernández-García L., Masegosa J., et al., 2016, A&A, 587, A1
- Griffith et al. (2011) Griffith R. L., Tsai C.-W., Stern D., et al., 2011, ApJ, 736, L22
- Haan et al. (2011) Haan S., Surace J. A., Armus L., et al., 2011, AJ, 141, 100
- Hainline et al. (2016) Hainline K. N., Reines A. E., Greene J. E., Stern D., 2016, ApJ, 832, 119
- Harrison et al. (2013) Harrison F. A., Craig W. W., Christensen F. E., et al., 2013, ApJ, 770, 103
- Hernán-Caballero et al. (2015) Hernán-Caballero A., Alonso-Herrero A., Hatziminaoglou E., et al., 2015, ApJ, 803, 109
- Hernquist (1989) Hernquist L., 1989, Nature, 340, 687
- Hickox et al. (2014) Hickox R. C., Mullaney J. R., Alexander D. M., et al., 2014, ApJ, 782, 9
- Ho et al. (1997) Ho L. C., Filippenko A. V., Sargent W. L. W., 1997, ApJS, 112, 315
- Hopkins et al. (2006) Hopkins P. F., Hernquist L., Cox T. J., Di Matteo T., Robertson B., Springel V., 2006, ApJS, 163, 1
- Howell et al. (2010) Howell J. H., Armus L., Mazzarella J. M., et al., 2010, ApJ, 715, 572
- Huchra & Burg (1992) Huchra J., Burg R., 1992, ApJ, 393, 90
- Ichikawa et al. (2014) Ichikawa K., Imanishi M., Ueda Y., et al., 2014, ApJ, 794, 139
- Imanishi et al. (2008) Imanishi M., Nakagawa T., Ohyama Y., et al., 2008, PASJ, 60, S489
- Imanishi et al. (2010) Imanishi M., Nakagawa T., Shirahata M., Ohyama Y., Onaka T., 2010, ApJ, 721, 1233
- Imanishi & Terashima (2004) Imanishi M., Terashima Y., 2004, AJ, 127, 758
- Imanishi et al. (2003) Imanishi M., Terashima Y., Anabuki N., Nakagawa T., 2003, ApJ, 596, L167
- Inami et al. (2013) Inami H., Armus L., Charmandaris V., et al., 2013, ApJ, 777, 156
- Inami et al. (2010) Inami H., Armus L., Surace J. A., et al., 2010, AJ, 140, 63
- Iwasawa & Comastri (1998) Iwasawa K., Comastri A., 1998, MNRAS, 297, 1219
- Iwasawa et al. (2011a) Iwasawa K., Mazzarella J. M., Surace J. A., et al., 2011a, A&A, 528, A137
- Iwasawa et al. (2005) Iwasawa K., Sanders D. B., Evans A. S., Trentham N., Miniutti G., Spoon H. W. W., 2005, MNRAS, 357, 565
- Iwasawa et al. (2011b) Iwasawa K., Sanders D. B., Teng S. H., et al., 2011b, A&A, 529, A106
- Jansen et al. (2001) Jansen F., Lumb D., Altieri B., et al., 2001, A&A, 365, L1
- Jones et al. (2015) Jones S. F., Blain A. W., Lonsdale C., et al., 2015, MNRAS, 448, 3325
- Kalberla et al. (2005) Kalberla P. M. W., Burton W. B., Hartmann D., et al., 2005, A&A, 440, 775
- Kartaltepe et al. (2010) Kartaltepe J. S., Sanders D. B., Le Floc’h E., et al., 2010, ApJ, 709, 572
- Kim & Sanders (1998) Kim D.-C., Sanders D. B., 1998, ApJS, 119, 41
- Kocevski et al. (2015) Kocevski D. D., Brightman M., Nandra K., et al., 2015, ApJ, 814, 104
- Komossa et al. (2003) Komossa S., Burwitz V., Hasinger G., Predehl P., Kaastra J. S., Ikebe Y., 2003, ApJ, 582, L15
- Kormendy & Ho (2013) Kormendy J., Ho L. C., 2013, ARA&A, 51, 511
- Koss et al. (2013) Koss M., Mushotzky R., Baumgartner W., et al., 2013, ApJ, 765, L26
- Koss et al. (2012) Koss M., Mushotzky R., Treister E., Veilleux S., Vasudevan R., Trippe M., 2012, ApJ, 746, L22
- Koss et al. (2010) Koss M., Mushotzky R., Veilleux S., Winter L., 2010, ApJ, 716, L125
- Koss et al. (2016a) Koss M. J., Assef R., Baloković M., et al., 2016a, ApJ, 825, 85
- Koss et al. (2016b) Koss M. J., Glidden A., Baloković M., et al., 2016b, ApJ, 824, L4
- LaMassa et al. (2016) LaMassa S. M., Ricarte A., Glikman E., et al., 2016, ApJ, 820, 70
- Lansbury et al. (2014) Lansbury G. B., Alexander D. M., Del Moro A., et al., 2014, ApJ, 785, 17
- Lansbury et al. (2015) Lansbury G. B., Gandhi P., Alexander D. M., et al., 2015, ApJ, 809, 115
- Lanzuisi et al. (2015) Lanzuisi G., Ranalli P., Georgantopoulos I., et al., 2015, A&A, 573, A137
- Lehmer et al. (2015) Lehmer B. D., Tyler J. B., Hornschemeier A. E., et al., 2015, ApJ, 806, 126
- Levenson et al. (2005) Levenson N. A., Weaver K. A., Heckman T. M., Awaki H., Terashima Y., 2005, ApJ, 618, 167
- Lípari et al. (2000) Lípari S., Díaz R., Taniguchi Y., Terlevich R., Dottori H., Carranza G., 2000, AJ, 120, 645
- Lira et al. (2002a) Lira P., Ward M., Zezas A., Alonso-Herrero A., Ueno S., 2002a, MNRAS, 330, 259
- Lira et al. (2002b) Lira P., Ward M. J., Zezas A., Murray S. S., 2002b, MNRAS, 333, 709
- Madsen et al. (2015) Madsen K. K., Harrison F. A., Markwardt C. B., et al., 2015, ApJS, 220, 8
- Magdziarz & Zdziarski (1995) Magdziarz P., Zdziarski A. A., 1995, MNRAS, 273, 837
- Martín et al. (2016) Martín S., Aalto S., Sakamoto K., et al., 2016, A&A, 590, A25
- Masetti et al. (2006) Masetti N., Bassani L., Bazzano A., et al., 2006, A&A, 455, 11
- Masetti et al. (2008) Masetti N., Mason E., Morelli L., et al., 2008, A&A, 482, 113
- Matt et al. (1991) Matt G., Perola G. C., Piro L., 1991, A&A, 247, 25
- Miniutti et al. (2007) Miniutti G., Ponti G., Dadina M., Cappi M., Malaguti G., 2007, MNRAS, 375, 227
- Murphy & Yaqoob (2009) Murphy K. D., Yaqoob T., 2009, MNRAS, 397, 1549
- Nardini et al. (2010) Nardini E., Risaliti G., Watabe Y., Salvati M., Sani E., 2010, MNRAS, 405, 2505
- Norris & Forbes (1995) Norris R. P., Forbes D. A., 1995, ApJ, 446, 594
- Oda et al. (in prep.) Oda S., et al., in prep.
- Oda et al. (2016) Oda S., Tanimoto A., Ueda Y., Imanishi M., Terashima Y., Ricci C., 2016, ArXiv:1612.07450
- O’Sullivan et al. (2014) O’Sullivan E., Vrtilek J. M., David L. P., et al., 2014, ApJ, 793, 74
- Pereira-Santaella et al. (2010) Pereira-Santaella M., Diamond-Stanic A. M., Alonso-Herrero A., Rieke G. H., 2010, ApJ, 725, 2270
- Petric et al. (2011) Petric A. O., Armus L., Howell J., et al., 2011, ApJ, 730, 28
- Piconcelli et al. (2015) Piconcelli E., Vignali C., Bianchi S., et al., 2015, A&A, 574, L9
- Privon et al. (2016) Privon G. C., Aalto S., Falstad N., et al., 2016, ArXiv e-prints
- Privon et al. (2015) Privon G. C., Herrero-Illana R., Evans A. S., et al., 2015, ApJ, 814, 39
- Ptak et al. (2003) Ptak A., Heckman T., Levenson N. A., Weaver K., Strickland D., 2003, ApJ, 592, 782
- Ptak et al. (2015) Ptak A., Hornschemeier A., Zezas A., et al., 2015, ApJ, 800, 104
- Puccetti et al. (2016) Puccetti S., Comastri A., Bauer F. E., et al., 2016, A&A, 585, A157
- Ramos Almeida et al. (2011) Ramos Almeida C., Tadhunter C. N., Inskip K. J., Morganti R., Holt J., Dicken D., 2011, MNRAS, 410, 1550
- Ranalli et al. (2003) Ranalli P., Comastri A., Setti G., 2003, A&A, 399, 39
- Ricci et al. (2017) Ricci C., Assef R. J., Stern D., et al., 2017, ApJ, 835, 105
- Ricci et al. (2016a) Ricci C., Bauer F. E., Arevalo P., et al., 2016a, ApJ, 820, 5
- Ricci et al. (2016b) Ricci C., Bauer F. E., Treister E., et al., 2016b, ApJ, 819, 4
- Ricci et al. (2014a) Ricci C., Ueda Y., Ichikawa K., et al., 2014a, A&A, 567, A142
- Ricci et al. (2015) Ricci C., Ueda Y., Koss M. J., Trakhtenbrot B., Bauer F. E., Gandhi P., 2015, ApJ, 815, L13
- Ricci et al. (2014b) Ricci C., Ueda Y., Paltani S., Ichikawa K., Gandhi P., Awaki H., 2014b, MNRAS, 441, 3622
- Risaliti (2002) Risaliti G., 2002, A&A, 386, 379
- Risaliti et al. (2006) Risaliti G., Maiolino R., Marconi A., et al., 2006, MNRAS, 365, 303
- Romero-Cañizales et al. (2012) Romero-Cañizales C., Pérez-Torres M. A., Alberdi A., et al., 2012, A&A, 543, A72
- Rupke & Veilleux (2013) Rupke D. S. N., Veilleux S., 2013, ApJ, 768, 75
- Sakamoto et al. (2010) Sakamoto K., Aalto S., Evans A. S., Wiedner M. C., Wilner D. J., 2010, ApJ, 725, L228
- Sanders et al. (2003) Sanders D. B., Mazzarella J. M., Kim D.-C., Surace J. A., Soifer B. T., 2003, AJ, 126, 1607
- Sanders et al. (1988) Sanders D. B., Soifer B. T., Elias J. H., et al., 1988, ApJ, 325, 74
- Sani et al. (2008) Sani E., Risaliti G., Salvati M., et al., 2008, ApJ, 675, 96
- Satyapal et al. (2014) Satyapal S., Ellison S. L., McAlpine W., Hickox R. C., Patton D. R., Mendel J. T., 2014, MNRAS, 441, 1297
- Schawinski et al. (2012) Schawinski K., Simmons B. D., Urry C. M., Treister E., Glikman E., 2012, MNRAS, 425, L61
- Scott et al. (2005) Scott J. E., Kriss G. A., Lee J. C., et al., 2005, ApJ, 634, 193
- Scoville et al. (2015) Scoville N., Sheth K., Walter F., et al., 2015, ApJ, 800, 70
- Scoville et al. (2000) Scoville N. Z., Evans A. S., Thompson R., et al., 2000, AJ, 119, 991
- Shlosman et al. (1990) Shlosman I., Begelman M. C., Frank J., 1990, Nature, 345, 679
- Shu et al. (2010) Shu X. W., Yaqoob T., Wang J. X., 2010, ApJS, 187, 581
- Silverman et al. (2011) Silverman J. D., Kampczyk P., Jahnke K., et al., 2011, ApJ, 743, 2
- Singh et al. (2011) Singh V., Shastri P., Risaliti G., 2011, A&A, 532, A84
- Springel et al. (2005) Springel V., White S. D. M., Jenkins A., et al., 2005, Nature, 435, 629
- Stern et al. (2012) Stern D., Assef R. J., Benford D. J., et al., 2012, ApJ, 753, 30
- Stern et al. (2014) Stern D., Lansbury G. B., Assef R. J., et al., 2014, ApJ, 794, 102
- Stierwalt et al. (2014) Stierwalt S., Armus L., Charmandaris V., et al., 2014, ApJ, 790, 124
- Stierwalt et al. (2013) Stierwalt S., Armus L., Surace J. A., et al., 2013, ApJS, 206, 1
- Strüder et al. (2001) Strüder L., Briel U., Dennerl K., et al., 2001, A&A, 365, L18
- Sturm et al. (2002) Sturm E., Lutz D., Verma A., et al., 2002, A&A, 393, 821
- Teng et al. (2014) Teng S. H., Brandt W. N., Harrison F. A., et al., 2014, ApJ, 785, 19
- Teng et al. (2015) Teng S. H., Rigby J. R., Stern D., et al., 2015, ApJ, 814, 56
- Teng & Veilleux (2010) Teng S. H., Veilleux S., 2010, ApJ, 725, 1848
- Teng et al. (2009) Teng S. H., Veilleux S., Anabuki N., et al., 2009, ApJ, 691, 261
- Torres Albà et al. (in prep.) Torres Albà N., et al., in prep.
- Treister et al. (2010) Treister E., Natarajan P., Sanders D. B., Urry C. M., Schawinski K., Kartaltepe J., 2010, Science, 328, 600
- Treister et al. (2012) Treister E., Schawinski K., Urry C. M., Simmons B. D., 2012, ApJ, 758, L39
- Turner et al. (2001) Turner M. J. L., Abbey A., Arnaud M., et al., 2001, A&A, 365, L27
- Ueda et al. (2007) Ueda Y., Eguchi S., Terashima Y., et al., 2007, ApJ, 664, L79
- Urrutia et al. (2008) Urrutia T., Lacy M., Becker R. H., 2008, ApJ, 674, 80
- Vardoulaki et al. (2015) Vardoulaki E., Charmandaris V., Murphy E. J., et al., 2015, A&A, 574, A4
- Vasudevan & Fabian (2007) Vasudevan R. V., Fabian A. C., 2007, MNRAS, 381, 1235
- Vega et al. (2008) Vega O., Clemens M. S., Bressan A., Granato G. L., Silva L., Panuzzo P., 2008, A&A, 484, 631
- Veilleux et al. (1999) Veilleux S., Kim D.-C., Sanders D. B., 1999, ApJ, 522, 113
- Veilleux et al. (2009) Veilleux S., Rupke D. S. N., Kim D.-C., et al., 2009, ApJS, 182, 628
- Véron-Cetty & Véron (2010) Véron-Cetty M.-P., Véron P., 2010, A&A, 518, A10
- Vignati et al. (1999) Vignati P., Molendi S., Matt G., et al., 1999, A&A, 349, L57
- Villforth et al. (2014) Villforth C., Hamann F., Rosario D. J., et al., 2014, MNRAS, 439, 3342
- Villforth et al. (2016) Villforth C., Hamilton T., Pawlik M. M., et al., 2016, ArXiv:1611.06236
- Walton et al. (2013) Walton D. J., Nardini E., Fabian A. C., Gallo L. C., Reis R. C., 2013, MNRAS, 428, 2901
- Weedman et al. (2005) Weedman D. W., Hao L., Higdon S. J. U., et al., 2005, ApJ, 633, 706
- Weisskopf et al. (2000) Weisskopf M. C., Tananbaum H. D., Van Speybroeck L. P., O’Dell S. L., 2000, in X-Ray Optics, Instruments, and Missions III, edited by J. E. Truemper, B. Aschenbach, vol. 4012 of Society of Photo-Optical Instrumentation Engineers (SPIE) Conference Series, 2–16
- Wilms et al. (2000) Wilms J., Allen A., McCray R., 2000, ApJ, 542, 914
- Wright et al. (2010) Wright E. L., Eisenhardt P. R. M., Mainzer A. K., et al., 2010, AJ, 140, 1868
- Wu et al. (2012) Wu J., Tsai C.-W., Sayers J., et al., 2012, ApJ, 756, 96
- Yamada et al. (2013) Yamada R., Oyabu S., Kaneda H., et al., 2013, PASJ, 65
- Yuan et al. (2010) Yuan T.-T., Kewley L. J., Sanders D. B., 2010, ApJ, 709, 884