Observational evidence for high neutronization in supernova remnants: implications for Type Ia supernova progenitors
Abstract
The physical process whereby a carbon–oxygen white dwarf explodes as a Type Ia supernova (SN Ia) remains highly uncertain. The degree of neutronization in SN Ia ejecta holds clues to this process because it depends on the mass and the metallicity of the stellar progenitor, and on the thermodynamic history prior to the explosion. We report on a new method to determine ejecta neutronization using Ca and S lines in the X-ray spectra of Type Ia supernova remnants (SNRs). Applying this method to Suzaku data of Tycho, Kepler, 3C 397 and G337.20.7 in the Milky Way, and N103B in the Large Magellanic Cloud, we find that the neutronization of the ejecta in N103B is comparable to that of Tycho and Kepler, which suggests that progenitor metallicity is not the only source of neutronization in SNe Ia. We then use a grid of SN Ia explosion models to infer the metallicities of the stellar progenitors of our SNRs. The implied metallicities of 3C 397, G337.20.7, and N103B are major outliers compared to the local stellar metallicity distribution functions, indicating that progenitor metallicity can be ruled out as the origin of neutronization for these SNRs. Although the relationship between ejecta neutronization and equivalent progenitor metallicity is subject to uncertainties stemming from the 12C +16O reaction rate, which affects the Ca/S mass ratio, our main results are not sensitive to these details.
1 Introduction
Type Ia supernovae (SNe Ia) are the thermonuclear explosions of white dwarf (WD) stars that are destabilized by mass accretion from a close binary companion. Despite their importance for many fields of astrophysics, such as galactic chemical evolution (Kobayashi et al., 2006; Andrews et al., 2016), studies of dark energy (Riess et al., 1998; Perlmutter et al., 1999) and constraints on CDM parameters (Betoule et al., 2014; Rest et al., 2014), key aspects of SNe Ia remain uncertain, including the precise identity of their stellar progenitors and the mechanism that triggers the thermonuclear runaway. Discussions of SN Ia progenitors are often framed by the single degenerate and double degenerate scenarios, depending on whether the WD companion is a non-degenerate star or another WD. In the single degenerate scenario, the WD grows in mass through accretion over a relatively long timescale (t year) and explodes when it gets close to the Chandrasekhar limit M (Nomoto et al., 1984; Thielemann et al., 1986; Hachisu et al., 1996; Han & Podsiadlowski, 2004). In most double degenerate scenarios, by contrast, the destabilizing event (a merger or collision) happens on a dynamical timescale (Iben & Tutukov, 1984), quickly leading to an explosion that is not necessarily close to MCh (Raskin et al., 2009; Rosswog et al., 2009; Raskin et al., 2010; Sim et al., 2010; van Kerkwijk et al., 2010; Kushnir et al., 2013). In principle, it is possible to discriminate between single degenerate and double degenerate systems exploding on a dynamical timescale after merging, provided that some observational probes are sensitive to the presence or absence of an extended accretion phase leading to the thermonuclear runaway and to the mass of the exploding star (see the recent reviews by Wang & Han 2012 and Maoz et al. 2014). Here we examine one of these probes, the degree of neutronization in SN Ia ejecta.
The neutron excess, defined as (where is the electron fraction, is the atomic number, and is the mass number) should be zero in WDs composed solely of 12C and 16O. The value of can be increased through weak interactions taking place at different stages during the life of SN Ia progenitors. So far, three such mechanisms have been proposed.
-
1.
Progenitor metallicity. The bottleneck reaction in the CNO cycle, 14N(p,)15O, causes all the C, N, and O in the progenitor to pile up onto 14N at the end of H burning, which then becomes 22Ne during hydrostatic He burning through the chain 14N(, )18F(, )18O(, )22Ne. Since 22Ne carries a neutron excess, this results in a linear scaling of with progenitor metallicity : (Timmes et al., 2003; Bravo et al., 2010; Moreno-Raya et al., 2016). Hence, this 22Ne content is usually defined as the “metallicity” of a WD.
-
2.
Carbon simmering. In SN Ia progenitors that approach MCh through slow accretion, carbon can ignite close to the center without immediately triggering a thermonuclear runaway. Instead, the WD develops a large () convective core for a few thousands of years until the heat from fusion overwhelms neutrino cooling and an explosion ensues (Woosley et al., 2004; Wunsch & Woosley, 2004; Piro & Chang, 2008). During this ‘C simmering’ phase, electron captures on the products of C fusion (mostly 13N and 23Na) increase the value of (Chamulak et al., 2008; Piro & Bildsten, 2008; Martínez-Rodríguez et al., 2016).
-
3.
Neutron-rich Nuclear Statistical Equilibrium (n-NSE). When a WD explodes close to MCh, the inner is dense enough for electron captures to take place during nucleosynthesis, shifting the equilibrium point of NSE away from 56Ni to more neutron-rich species like 55Mn and 58Ni (Iwamoto et al., 1999; Brachwitz et al., 2000).
To summarize, the baseline neutronization level in all SNe Ia is set by progenitor metallicity. Additional neutronization can be introduced only in systems that explode close to MCh, by C simmering or n-NSE. C simmering will affect most of the SN ejecta, while n-NSE will only affect the NSE material synthesized in the innermost layers (i.e., Fe-peak elements). Thus, while mixing may blur this distinction to some degree, accurate measurements of in SNe have the potential to constrain the fundamental properties of SN Ia progenitors.
Emission lines from stable Mn and Ni in the X-ray spectra of Type Ia supernova remnants (SNRs) have been used to measure and infer the properties of SN Ia progenitors (Badenes et al., 2008a; Park et al., 2013; Yamaguchi et al., 2015). However, these weak lines are often hard to detect, and it is difficult to disentangle the neutronization effects of n-NSE and C simmering using Fe-peak nuclei (see Park et al., 2013; Yamaguchi et al., 2015, for discussions). Here, we report on a new method to measure neutronization in SNe Ia based on the sensitivity of the Ca/S yield to identified by De et al. (2014). and are produced in a quasi-nuclear statistical equilibrium in a temperature range 24109 K. In this regime, the nuclear abundances are determined by a set of coupled Saha equations that ultimately depend on the temperature, density, and Ye (e.g. Clifford & Tayler, 1965; Hartmann et al., 1985; Nadyozhin & Yudin, 2004; Seitenzahl et al., 2008; De et al., 2014). Thus, the abundances of symmetric nuclei such as 32S and 40Ca depend on the overall Ye. For explosive events such as SNe Ia, the freeze-out from high temperatures occurs on a time scale faster than the nuclear rearrangement, ensuring that the abundances produced at these temperatures are the same as the final abundances (De et al., 2014; Miles et al., 2016). Among the intermediate-mass elements, is the most sensitive to changes in the electron fraction. De et al. (2014) found a systematic quasi-linear yield with respect to , and a more complex trend for the global abundance of . Thus, more neutron-rich progenitors should have a lower Ca/S mass ratio (). Here we show that the Ca/S mass ratio in SN Ia ejecta is indeed a good observational tracer of neutronization, with the key advantages that (a) it is not affected by n-NSE and (b) it uses much stronger emission lines that can be easily measured in a larger sample of objects.
This paper is organized as follows. In Section 2, we describe the observations and derive values. In Section 3, we interpret the inferred and discuss the implications for SN Ia physics. In Section 4, we analyze the relation between and the 12C +16O reaction rate. Finally, in Section 5, we summarize our results and outline future lines of work.
2 Observations and data analysis
Yamaguchi et al. (2014) list 11 Type Ia SNRs with Fe K emission in the Milky Way and the Large Magellanic Cloud (LMC). We re-reduce and analyze all these Suzaku spectra, paying special attention to the emission lines from S, Ar, Ca, Cr, Mn, Fe, and Ni. We do not include Si in our analysis because of the well-known calibration problems around keV in the Suzaku CCDs (https://heasarc.gsfc.nasa.gov/docs/suzaku/analysis/sical.html).
| SNR | Exp. Time | Continuum Model | Refs.111111References consulted for the absorption and continuum components in the spectral fittings: (1) Safi-Harb et al. (2005), (2) Lewis et al. (2003), (3) Someya et al. (2014), (4) Rakowski et al. (2006), (5) Reynolds et al. (2007), (6) Patnaude et al. (2012), (7) Park et al. (2013), (8) Badenes et al. (2006). | 121212All the uncertainties are in the 90% confidence range (). Note that the confidence intervals do not necessarily have to be symmetric (https://heasarc.gsfc.nasa.gov/xanadu/xspec/manual/XSerror.html). | 12 | 12 | |
|---|---|---|---|---|---|---|---|
| (ks) | |||||||
| 3C 397 | 104 | 3.00 | Bremms. ( keV131313Best-fit parameter.) | 1 | |||
| N103B | 224 | 0.34 | Power law () | 2,3 | |||
| G337.20.7 | 304 | 3.20 | Power law () | 4 | Undeterm. | ||
| Kepler | 146 | 0.52 | Power law () | 5,6,7 | |||
| Tycho | 313 | 0.60 | Power law () | 8 |
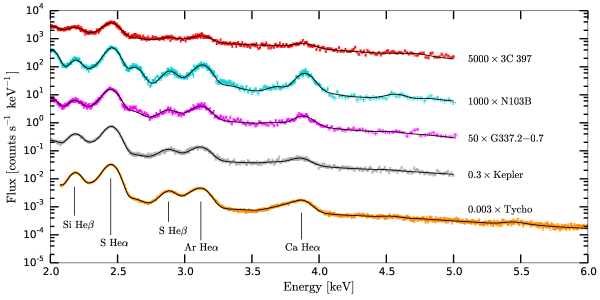
We merge the data from the two active front-illuminated CCDs (XIS0 and 3) to increase photon counts. The spectrum of each SNR is fit in the 2.05.0 keV energy range with a plane-parallel shock model (vvpshock, Borkowski et al., 2001) plus an additional component for the continuum (either bremsstrahlung or a power law), using the XSPEC software (Arnaud, 1996, version 12.9.0i, https://heasarc.gsfc.nasa.gov/xanadu/xspec/manual/) and the most recent non-equilibrium ionization atomic data from AtomDB (Foster et al., 2012, 2014). We fix the hydrogen column densities and the continuum components to values previously reported for each SNR (see references in Table 1). We let the electron temperature , the ionization time scale (defined as the product of the electron density and the expansion age) and the abundances of the -elements in the shock model vary until we get a valid fit, with a reduced chi-square (where is the number of degrees of freedom). This allows us to derive confidence intervals for the different parameters. We convert these abundances retrieved by the best-fit spectral model into mass ratios using the Anders & Grevesse (1989) factors.
Our goal is to measure Ca/S mass ratios to better than in order to compare with a grid of SN explosion models (where physically meaningful variations of are of this order or larger). Only the five objects shown in Figure 1 pass this quality cut: 3C 397, G337.20.7, Kepler and Tycho in the Milky Way, and N103B in the LMC. The relevant parameters for the observations are listed in Table 1. Additionally, we determine Ar/S mass ratios for these SNRs.
As a sanity check, we also fit all spectra using two single-ionization timescale non-equilibrium ionization models (vvrnei, Hughes et al., 2000), and find mass ratios consistent with the values obtained with the plane-parallel shock models. For Tycho, we are unable to get a valid fit with a plane-parallel shock model, so we use two non-equilibrium ionization models in an enlarged energy window between and keV (See Figure 1). Only this spectral model can successfully fit the Ca He feature (see Badenes et al., 2006, for a discussion about this line in the spectrum of Tycho and the difficulties to reproduce it with explosion models). We follow the same procedure around the Fe K line (5.08.0 keV) for each SNR, but can confidently detect the Mn and Ni lines only for 3C 397, Kepler and Tycho (measurements reported in Yamaguchi et al., 2015), so we choose to determine the Cr/Fe mass ratio () for all objects as a baseline measurement of Fe-peak ejecta.
The final Ar/S, Ca/S and Cr/Fe mass ratios are listed in Table 1. The relative errors in the inferred are in the range of 516%, which allows for meaningful comparisons with explosion models. These are lower than the previous Fe-peak relative errors for 3C 397, Kepler and Tycho: 3570% () and 2865% (, ). Hence, the mass ratios of intermediate-mass elements can be measured with better precision than those of Fe-peak elements. Prior measurements of in the optical spectra of SNe Ia are based on tomography (e.g. 0.299 for SN 2002bo, Stehle et al. 2005; 0.029 for SN 2003du, Tanaka et al. 2011; between and for SN 1986G, Ashall et al. 2016), and strongly depend on the radiative transfer treatment and on the chosen explosion model. The error bars from these tomography estimates are either undetermined or higher (35%) than our measured errors. It is worth mentioning that all these measurements, with the exception of SN 2003du, overlap the ones reported in this paper (see Figure 5).
Before doing a direct comparison between models and SNR observations, we must distinguish between dynamically old objects like 3C 397 and G337.20.7, which have likely thermalized the entire SN ejecta (Rakowski et al., 2006; Yamaguchi et al., 2015), and dynamically young objects like Kepler and Tycho, which probably have not (Badenes et al., 2006; Patnaude et al., 2012), with N103B being a transitional object between the two classes (Lewis et al., 2003; Williams et al., 2014). The X-ray spectra of dynamically young objects are only representative of the shocked material, not of the entire SN ejecta, and comparisons to bulk yields from SN explosion models should be done with some caution. However, the diagnostic Ca/S mass ratios in Kepler and Tycho are largely unaffected by this, since the vast majority of the explosive Si-burning material has already been shocked in these two objects (Badenes et al., 2006; Patnaude et al., 2012).
The values measured in our SNRs span the range between 0.17 and 0.28. N103B has 0.26, between Tycho (0.25) and Kepler (0.28). This alone makes it challenging to invoke progenitor metallicity as the only source of neutronization in SN ejecta (e.g., Timmes et al., 2003), unless Kepler’s progenitor was more metal-poor than most LMC stars, which seems unlikely given its measured Fe-peak mass ratios (Park et al., 2013) and location toward the Galactic center region. Therefore, our observations alone, without any comparison to models, indicate that progenitor metallicity is not the only source of neutronization in SN Ia progenitors.
3 Interpretation
3.1 Comparison with explosion models
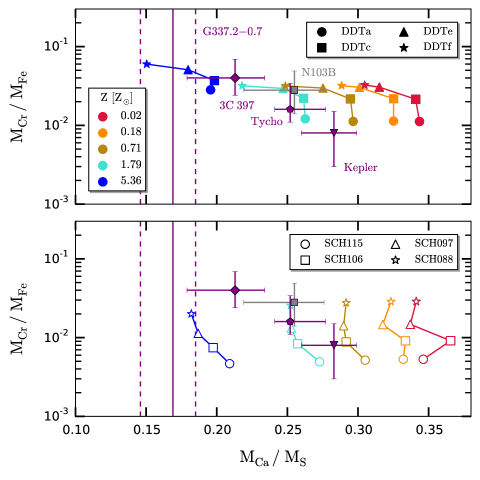
To interpret our measured mass ratios, we use the spherically symmetric SN Ia explosion models introduced in Yamaguchi et al. (2015), which are calculated with a version of the code described in Bravo & Martínez-Pinedo (2012), updated to account for an accurate coupling between hydrodynamics and nuclear reactions (Bravo et al., 2016). In this model grid, the MCh explosions are delayed detonations (Khokhlov, 1991) with a central density and different deflagration-to-detonation densities (): and , labeled as DDTa, DDTc, DDTe, and DDTf (see Badenes et al., 2003, 2005, 2008b). The sub-MCh models are central detonations of CO WDs with a core temperature and masses and , similar to the models by Sim et al. (2010). Each model in the grid is calculated with five different values of the progenitor metallicity, and , taking (Asplund et al., 2009). This progenitor neutronization is set by increasing the abundance of 22Ne in the pre-explosion WD according to the Timmes et al. (2003) metallicity relation. Additional neutronization from C simmering in MCh models with large convective cores () should behave in a similar way, i.e., increasing the value of throughout the convective region of the pre-explosion WD (Martínez-Rodríguez et al., 2016). However, for simplicity, we have not included a separate enhancement of due to simmering in this model grid. Because no simmering is included in our models, the level of neutronization in intermediate-mass elements is controlled exclusively by progenitor metallicity. The value of in the inner of ejecta in the MCh models is further modified by n-NSE nucleosynthesis during the explosion (Iwamoto et al., 1999; Brachwitz et al., 2000). Although simplified, this model grid captures the basic phenomenology of neutronization in SN Ia progenitors.
The bulk Cr/Fe vs. Ca/S mass ratios in the models are shown in Figure 2, together with the values measured in the five SNRs in our sample. As expected from De et al. (2014), the Ca/S mass ratio in the models is a good tracer of progenitor neutronization (see also Figure 3). Models with different metallicities that burn Ca and S at similar temperatures have values that can be discriminated by observations. This is because the main contribution to both elements comes from the isotopes and , whose abundances are in quasi-statistical equilibrium at the temperatures ( 4109 K) at which is synthesized. In this regime, , where is the abundance of alpha particles, which decreases as metallicity increases (see Figures 2 and 8 in Bravo, 2013). The DDT models with the lowest (DDTe and f), which correspond to the low luminosity end of SNe Ia, show lower Ca/S mass ratios because they burn a larger mass of Ca at a lower density and temperature than their more energetic counterparts, which results in a lower Ca/S mass ratio. Figure 3 shows that, for a given metallicity, the MCh and sub-MCh models predict similar values.
It is worth noting that the models in our grid span the observed Ca/S and Cr/Fe mass ratios for all the SNRs. Furthermore, the level of neutronization inferred from the closest equivalent progenitor metallicity () is rather high in all SNRs. When compared to the metallicity distribution functions (MDFs) in the Milky Way and the LMC (see Figure 4 and Section 3.2), this suggests an additional source of neutronization in SN Ia ejecta. One possibility is carbon simmering. To quantify the increase in , we need to consider some additional information about the objects under study. The properties of the Fe K emission analyzed by Yamaguchi et al. (2014) rule out the MCh models with the lowest (DDTe and f) for N103B, 3C 397, Kepler, and Tycho, and favor them for G337.20.7. These constraints are confirmed by detailed spectral modeling for Tycho, G337.20.7 and Kepler (Badenes et al., 2006; Rakowski et al., 2006; Patnaude et al., 2012), and by the light echo spectrum of Tycho (Krause et al., 2008). Once the ruled out MCh models are removed, we can better constrain the values for each SNR from the Ca/S mass ratio: for 3C 397 and G337.20.7, for Tycho and N103B, and between 1.8 and for Kepler. These values are roughly the same for sub-MCh explosions, although the Cr/Fe mass ratio can rule out these models for 3C 397 (see also Yamaguchi et al., 2015). We note that Vink (2016) proposed a sub-MCh progenitor for Kepler based on the properties of its light curve, and our measured is in good accordance with the sub-MCh models in our grid. These results are in agreement with previous analyses based on emission lines from Fe-peak elements in Tycho, Kepler, and 3C 397 (Badenes et al., 2008a; Park et al., 2013; Yamaguchi et al., 2015), but they represent a much cleaner measurement of the pre-explosion neutronization in the progenitor, since the Ca/S mass ratio is not susceptible to contamination from n-NSE material synthesized in the deepest layers of the WD (see Park et al., 2013, for a discussion).
3.2 Comparison with metallicity distribution functions
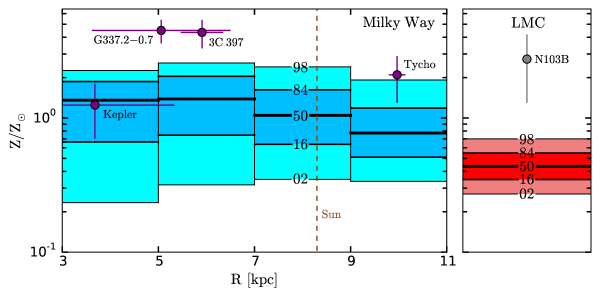
The significance of the high values of that we infer from the X-ray spectra becomes apparent when we compare them to the MDFs of the underlying stellar populations. This is shown in Figure 4, where we take the MDF as a function of Galactocentric radius for the Milky Way disk (Hayden et al., 2015) and the bulk MDF of the LMC (adapted from Choudhury et al., 2016). The Galactocentric radii of the Milky Way SNRs are calculated from their Galactic coordinates and the most recent estimates for their distances from the solar system: 6.59.5 kpc to 3C 397 (Leahy & Ranasinghe, 2016), 2.09.3 kpc to G337.20.7 (Rakowski et al., 2006), 3.06.4 kpc to Kepler (Reynoso & Goss, 1999; Sankrit et al., 2005) and 2.53.0 kpc to Tycho (Tian & Leahy, 2011). We linearly interpolate between our DDT models (upper panel of Figure 2) to find an approximate range for each SNR, excluding the models that can be ruled out based on the Fe K emission. We note that the values are similar in MCh and sub-MCh explosions (see Section 3.1).
Our analysis indicates that progenitor metallicity can be ruled out as the only source of neutronization in 3C 397, G337.20.7, and N103B, which are many standard deviations above the mean stellar metallicity of their environments in the Galaxy and the LMC (see Figure 4). Tycho is a outlier, and Kepler is the only object whose neutronization is compatible with the stellar metallicity distribution in its Galactic environment.
4 Sensitivity of to the 12C +16O reaction rate
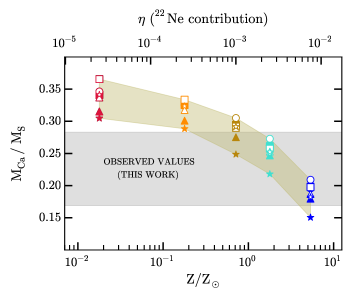
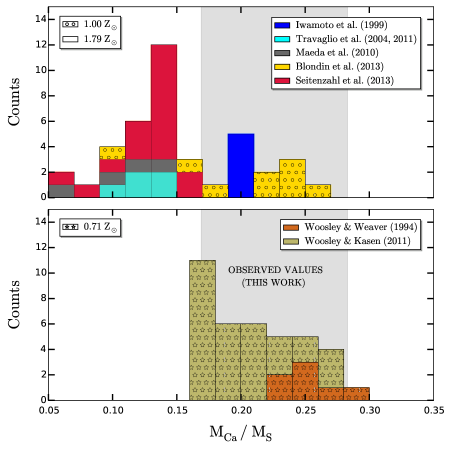
Because a grid of SN Ia explosion models is needed to translate our measured Ca/S mass ratios into equivalent progenitor metallicities, it is important to verify the sensitivity of this ratio to the details of explosive nucleosynthesis calculations. To this end, we compare our observed to the predictions of six MCh (Iwamoto et al., 1999; Travaglio et al., 2004; Maeda et al., 2010; Travaglio et al., 2011; Blondin et al., 2013; Seitenzahl et al., 2013) and two sub-MCh (Woosley & Weaver, 1994; Woosley & Kasen, 2011) SN Ia explosion model grids from the literature. Figure 5 shows that the multi-dimensional models, Travaglio et al. (2004, 2D and 3D), Maeda et al. (2010, 2D), Travaglio et al. (2011, 2D) and Seitenzahl et al. (2013, 3D) predict a Ca/S mass ratio that is substantially () lower than both the models in our grid and the observations, unlike the spherically symmetric calculations in 1D (Woosley & Weaver, 1994; Iwamoto et al., 1999; Woosley & Kasen, 2011; Blondin et al., 2013).
Though there are likely additional differences due to the methods used in these computations, we identify the 12C +16O reaction rate as a significant source of the spread seen in Figure 5. A precise determination of the cross-section for this reaction remains elusive. This is largely because the cross-section at stellar energies is in a non-resonance region, where the cross-section is determined by the interference between several broad resonances. In addition, high energy tails of subthreshold levels whose properties are challenging to determine directly can also complicate the extrapolation of the data into the Gamow range (e.g., Bucher et al., 2015; Fang et al., 2017). At temperatures 4109 K, where the 12C +16O rate is most influent, the Gamow peak of this reaction is 7.71.9 MeV. This rate impacts the Ca/S yield because of its relation with the abundance of alpha particles, .
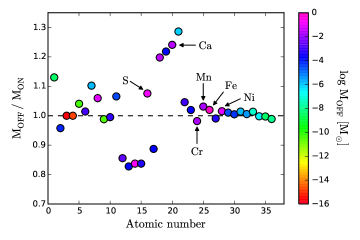
Given these theoretical uncertainties, the reaction was not included in the model grid from Yamaguchi et al. (2015) shown in Figures 2 and 3. However, the results from that paper, which are based on the Fe-peak elements (, ), remain valid. To prove this, we run an additional DDTc, 5.4-Z⊙ model where the reaction is included (using the rate given by Caughlan & Fowler 1988) and show the effect on the total mass yields in Figure 6. The Fe-peak yields are insensitive to the 12C +16O rate, but the Ca and S yields vary drastically. This could affect our inferred values given the small error bars in our measurements (see Section 2).
To study the effect of this reaction rate on the overall yield, we run additional MCh and sub-MCh models. The MCh are calculated analogously to the ones in Section 3.1, although with an increased central density . The sub-MCh are obtained with the methods used in Miles et al. (2016) and described in Townsley et al. (2016), applied in one dimension, and using the reaction networks provided by the Modules for Experiments in Stellar Astrophysics (MESA) for post-processing instead of Torch (Townsley et al., 2016). These two additional model grids give similar, though understandably not quite identical, yields for the same 12C +16O rate. We introduce several attenuation factors : 0, 0.7 and 0.9 for the DDTs, and 0, 0.7, 0.9 and 0.99 for the sub-MCh. We use the rate given by , where is the standard 12C +16O rate (Caughlan & Fowler, 1988), so corresponds to null and full suppression, respectively.
Why does varying the 12C +16O rate change the Ca/S mass ratio? First, consider the case where the 12C +16O rate is zero. At oxygen burning temperatures, oxygen could react with itself to mainly produce 16O(16O,)28Si. We will refer to this as the “alpha-poor” branch since only one -particle is produced. Alternatively, oxygen can photodisintegrate to produce carbon, 2(16O) + 2 2(12C) + 2. If this carbon only recombines with the emitted -particle to produce 16O, then this equilibrium loop is not interesting for our purposes here. The other option is for carbon to burn with itself to mainly produce 12C(12C,)20Ne. Photodisintegration of 20Ne then returns the nuclear flows to 16O via 20Ne(,)16O. The net flow of this oxygen cycle is 16O(16O,4)16O. We will refer to this as the “alpha-rich” branch since four -particles are produced. The alpha-poor and alpha-rich branches compete with each other. Which branch dominates depends on the thermodynamic conditions and reaction rates. If the alpha-poor branch wins, then the 32S and 40Ca abundances will be low. If the alpha-rich branch wins, then the 32S and 40Ca abundances will be high.
Now consider the case where the 12C +16O rate is nonzero. The 12C +16O branching ratios are not important because the main products from this reaction (24Mg 27Al, and 27Si) ultimately produce 28Si. That is, the net nuclear flow is 12C +16O 28Si. If 12C burns only by reactions with 16O, the reaction flow for oxygen photodisintegration is 16O + 12C +, then 12C +16O 28Si. This is the same single -particle yield as the alpha-poor branch (Woosley et al., 1971). Thus, the net effect of a nonzero 12C +16O rate is to assist the alpha-poor branch, to produce less -particles.
De et al. (2014) and Miles et al. (2016) showed that the Ca/S mass ratio in SN Ia ejecta scales as the square of the -particle abundance. Increasing the 12C +16O rate (decreasing ) suppresses the -particle abundance, which in turn decreases . There is less sensitivity to the 12C +16O rate at higher metallicity (more 22Ne) because the increased neutron richness opens additional channels for -particles, so that the action of the 12C +16O reaction to shift -particle flows toward the alpha-poor branch is less important.
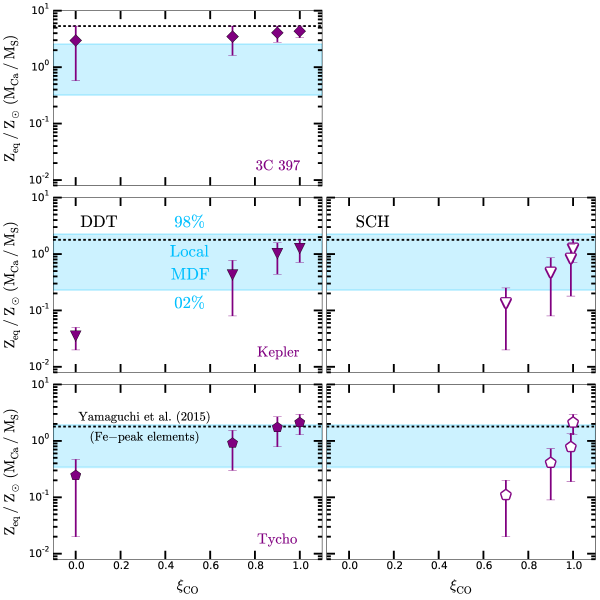
In Figure 7, we show how the various 12C +16O rate multipliers affect the determination of for 3C 397, Kepler and Tycho by analyzing vs and linearly interpolating within the model grids as done for Figure 4. We choose these remnants because our inferred estimates agree with previous measurements based on Fe-peak nuclei, which are not affected by the 12C +16O rate (see the discussion in Section 3.1). In order to recover values that are consistent with the ones found by Yamaguchi et al. (2015), the suppression factor has to be at least of the order of (attenuation 90%). We conclude that the 12C +16O rate is attenuated in nature, but we emphasize that a more in-depth analysis is required to get to the bottom of this newly identified problem in SN Ia nucleosynthesis. For the purposes of this work, we point out that the correspondence between values and equivalent progenitor metallicities in our Figures 2, 3 and 4 is tentative and might need to be revised in the future. This certainly complicates our analysis, but it does not invalidate our main conclusions that (1) the neutronization in SN Ia ejecta appears to be high, given the values of measured in G337.20.7 and 3C 397 and the dependence between and neutronization identified by De et al. (2014), and (2) because the Ca/S mass ratio in SNR N103B in the LMC is comparable to that of Milky-Way-type Ia SNRs, it seems unlikely that progenitor metallicity alone can be responsible for this high neutronization.
5 Conclusions
We have inferred the neutronization in the ejecta of five Type Ia SNRs (3C 397, N103B, G337.20.7, Kepler and Tycho) from their X-ray spectra, using a new method based on the sensitivity of the Ca/S yield to discussed in De et al. (2014). The neutronization inferred for N103B, in the LMC, is comparable to the values determined for Tycho and Kepler, in the Milky Way, which indicates that progenitor metallicity cannot be the only source of neutrons in SN Ia ejecta.
By comparing to a grid of SN Ia explosion models, we have translated our measured Ca/S mass ratios to equivalent progenitor metallicities, which can be compared to the MDFs in the Milky Way and the LMC. These comparisons rule out progenitor metallicity as the sole source of neutrons for 3C 397, G337.20.7, and N103B. This represents a conundrum for SN Ia progenitors. Since our measurements are not affected by n-NSE and progenitor metallicity is discarded, the only possible source of neutronization left that we know can affect the whole ejecta is C simmering. Recent models of simmering by Martínez-Rodríguez et al. (2016) indicate that the highest level of neutronization is , which is too low to explain the observations. This implies that either there is a fourth, as yet unidentified, source of neutronization in SN Ia progenitors, or that these simmering models do not capture the full phenomenology of C simmering. Lately, Piersanti et al. (2017) have suggested that the simmering contribution to is higher than that of Martínez-Rodríguez et al. (2016), but more work is needed to understand the differences between both analyses.
We have also identified an issue affecting most SN Ia nucleosynthesis calculations in the literature. The Ca/S mass ratio in the final yields is very sensitive to the precise value of the 12C +16O reaction rate (see Figure 6), with the most widely used rate value leading to Ca/S mass ratios that are too low to reproduce our measurements by a factor of 2 (shown in Figure 5). Given the excellent correspondence between the SN Ia model grid used in this work, where this reaction rate is not included, and our measurements, we conclude that the 12C +16O reaction rate must be suppressed in nature by a potentially large factor. A preliminary exploration of SN Ia nucleosynthesis calculations with varying degrees of suppression in the 12C +16O reaction, displayed in Figure 7, confirms this conclusion, but a more detailed analysis is needed to get to the bottom of this issue (e.g., Bucher et al., 2015; Fang et al., 2017). Until this study is completed, our estimates of must be considered tentative, and will need to be revised.
We emphasize that our main results are not sensitive to these details. The values of measured in our SNRs G337.20.7 and 3C 397 do require a high degree of neutronization in SN Ia ejecta, by virtue of the effect discovered by De et al. (2014). Most importantly, the fact that SNR N103B in the LMC shows a Ca/S mass ratio similar to those of Milky Way SNRs like Tycho strongly suggests that metallicity alone cannot be the origin of this high neutronization. Unless a new source of neutrons in SNe Ia is identified, the simplest explanation for this high neutronization is that a large fraction of SNe Ia in the local universe explode close to MCh after developing a large convective core through carbon simmering.
References
- Anders & Grevesse (1989) Anders, E., & Grevesse, N. 1989, Geochim. Cosmochim. Acta, 53, 197
- Andrews et al. (2016) Andrews, B. H., Weinberg, D. H., Schönrich, R., & Johnson, J. A. 2016, ArXiv e-prints, arXiv:1604.08613
- Arnaud (1996) Arnaud, K. A. 1996, in Astronomical Society of the Pacific Conference Series, Vol. 101, Astronomical Data Analysis Software and Systems V, ed. G. H. Jacoby & J. Barnes, 17
- Ashall et al. (2016) Ashall, C., Mazzali, P. A., Pian, E., & James, P. A. 2016, MNRAS, 463, 1891
- Asplund et al. (2009) Asplund, M., Grevesse, N., Sauval, A. J., & Scott, P. 2009, ARA&A, 47, 481
- Astropy Collaboration et al. (2013) Astropy Collaboration, Robitaille, T. P., Tollerud, E. J., et al. 2013, A&A, 558, A33
- Badenes et al. (2005) Badenes, C., Borkowski, K. J., & Bravo, E. 2005, ApJ, 624, 198
- Badenes et al. (2006) Badenes, C., Borkowski, K. J., Hughes, J. P., Hwang, U., & Bravo, E. 2006, ApJ, 645, 1373
- Badenes et al. (2003) Badenes, C., Bravo, E., Borkowski, K. J., & Domínguez, I. 2003, ApJ, 593, 358
- Badenes et al. (2008a) Badenes, C., Bravo, E., & Hughes, J. P. 2008a, ApJ, 680, L33
- Badenes et al. (2008b) Badenes, C., Hughes, J. P., Cassam-Chenaï, G., & Bravo, E. 2008b, ApJ, 680, 1149
- Betoule et al. (2014) Betoule, M., Kessler, R., Guy, J., et al. 2014, A&A, 568, A22
- Blackburn (1995) Blackburn, J. K. 1995, in Astronomical Society of the Pacific Conference Series, Vol. 77, Astronomical Data Analysis Software and Systems IV, ed. R. A. Shaw, H. E. Payne, & J. J. E. Hayes, 367
- Blondin et al. (2013) Blondin, S., Dessart, L., Hillier, D. J., & Khokhlov, A. M. 2013, MNRAS, 429, 2127
- Borkowski et al. (2001) Borkowski, K. J., Lyerly, W. J., & Reynolds, S. P. 2001, ApJ, 548, 820
- Brachwitz et al. (2000) Brachwitz, F., Dean, D. J., Hix, W. R., et al. 2000, ApJ, 536, 934
- Bravo (2013) Bravo, E. 2013, A&A, 550, A24
- Bravo et al. (2010) Bravo, E., Domínguez, I., Badenes, C., Piersanti, L., & Straniero, O. 2010, ApJ, 711, L66
- Bravo et al. (2016) Bravo, E., Gil-Pons, P., Gutiérrez, J. L., & Doherty, C. L. 2016, A&A, 589, A38
- Bravo & Martínez-Pinedo (2012) Bravo, E., & Martínez-Pinedo, G. 2012, Phys. Rev. C, 85, 055805
- Bucher et al. (2015) Bucher, B., Tang, X. D., Fang, X., et al. 2015, Physical Review Letters, 114, 251102
- Caughlan & Fowler (1988) Caughlan, G. R., & Fowler, W. A. 1988, Atomic Data and Nuclear Data Tables, 40, 283
- Chamulak et al. (2008) Chamulak, D. A., Brown, E. F., Timmes, F. X., & Dupczak, K. 2008, ApJ, 677, 160
- Choudhury et al. (2016) Choudhury, S., Subramaniam, A., & Cole, A. A. 2016, MNRAS, 455, 1855
- Clifford & Tayler (1965) Clifford, F. E., & Tayler, R. J. 1965, MmRAS, 69, 21
- De et al. (2014) De, S., Timmes, F. X., Brown, E. F., et al. 2014, ApJ, 787, 149
- Dubey et al. (2012) Dubey, A., Daley, C., ZuHone, J., et al. 2012, ApJS, 201, 27
- Fang et al. (2017) Fang, X., Tan, W. P., Beard, M., et al. 2017, submitted to Phys. Rev. C
- Foster et al. (2014) Foster, A., Smith, R. K., Brickhouse, N. S., et al. 2014, in AAS/High Energy Astrophysics Division, Vol. 14, AAS/High Energy Astrophysics Division, 115.06
- Foster et al. (2012) Foster, A. R., Ji, L., Smith, R. K., & Brickhouse, N. S. 2012, ApJ, 756, 128
- Fryxell et al. (2000) Fryxell, B., Olson, K., Ricker, P., et al. 2000, ApJS, 131, 273
- Gillessen et al. (2009) Gillessen, S., Eisenhauer, F., Trippe, S., et al. 2009, ApJ, 692, 1075
- Hachisu et al. (1996) Hachisu, I., Kato, M., & Nomoto, K. 1996, ApJ, 470, L97
- Han & Podsiadlowski (2004) Han, Z., & Podsiadlowski, P. 2004, MNRAS, 350, 1301
- Hartmann et al. (1985) Hartmann, D., Woosley, S. E., & El Eid, M. F. 1985, ApJ, 297, 837
- Hayden et al. (2015) Hayden, M. R., Bovy, J., Holtzman, J. A., et al. 2015, ApJ, 808, 132
- Hughes et al. (2000) Hughes, J. P., Rakowski, C. E., & Decourchelle, A. 2000, ApJ, 543, L61
- Hunter (2007) Hunter, J. D. 2007, Computing in Science and Engineering, 9, 90
- Iben & Tutukov (1984) Iben, Jr., I., & Tutukov, A. V. 1984, ApJS, 54, 335
- Iwamoto et al. (1999) Iwamoto, K., Brachwitz, F., Nomoto, K., et al. 1999, ApJS, 125, 439
- Joye & Mandel (2003) Joye, W. A., & Mandel, E. 2003, in Astronomical Society of the Pacific Conference Series, Vol. 295, Astronomical Data Analysis Software and Systems XII, ed. H. E. Payne, R. I. Jedrzejewski, & R. N. Hook, 489
- Khokhlov (1991) Khokhlov, A. M. 1991, A&A, 245, 114
- Kobayashi et al. (2006) Kobayashi, C., Umeda, H., Nomoto, K., Tominaga, N., & Ohkubo, T. 2006, ApJ, 653, 1145
- Krause et al. (2008) Krause, O., Tanaka, M., Usuda, T., et al. 2008, Nature, 456, 617
- Kushnir et al. (2013) Kushnir, D., Katz, B., Dong, S., Livne, E., & Fernández, R. 2013, ApJ, 778, L37
- Leahy & Ranasinghe (2016) Leahy, D. A., & Ranasinghe, S. 2016, ApJ, 817, 74
- Lewis et al. (2003) Lewis, K. T., Burrows, D. N., Hughes, J. P., et al. 2003, ApJ, 582, 770
- Maeda et al. (2010) Maeda, K., Röpke, F. K., Fink, M., et al. 2010, ApJ, 712, 624
- Maoz et al. (2014) Maoz, D., Mannucci, F., & Nelemans, G. 2014, ARA&A, 52, 107
- Martínez-Rodríguez et al. (2016) Martínez-Rodríguez, H., Piro, A. L., Schwab, J., & Badenes, C. 2016, ApJ, 825, 57
- Miles et al. (2016) Miles, B. J., van Rossum, D. R., Townsley, D. M., et al. 2016, ApJ, 824, 59
- Moreno-Raya et al. (2016) Moreno-Raya, M. E., Mollá, M., López-Sánchez, Á. R., et al. 2016, ApJ, 818, L19
- Nadyozhin & Yudin (2004) Nadyozhin, D. K., & Yudin, A. V. 2004, Astronomy Letters, 30, 634
- Nomoto et al. (1984) Nomoto, K., Thielemann, F.-K., & Yokoi, K. 1984, ApJ, 286, 644
- Park et al. (2013) Park, S., Badenes, C., Mori, K., et al. 2013, ApJ, 767, L10
- Patnaude et al. (2012) Patnaude, D. J., Badenes, C., Park, S., & Laming, J. M. 2012, ApJ, 756, 6
- Paxton et al. (2011) Paxton, B., Bildsten, L., Dotter, A., et al. 2011, ApJS, 192, 3
- Paxton et al. (2013) Paxton, B., Cantiello, M., Arras, P., et al. 2013, ApJS, 208, 4
- Paxton et al. (2015) Paxton, B., Marchant, P., Schwab, J., et al. 2015, ApJS, 220, 15
- Pérez & Granger (2007) Pérez, F., & Granger, B. E. 2007, Computing in Science and Engineering, 9, 21
- Perlmutter et al. (1999) Perlmutter, S., Aldering, G., Goldhaber, G., et al. 1999, ApJ, 517, 565
- Piersanti et al. (2017) Piersanti, L., Bravo, E., Cristallo, S., et al. 2017, ArXiv e-prints, arXiv:1701.06453
- Piro & Bildsten (2008) Piro, A. L., & Bildsten, L. 2008, ApJ, 673, 1009
- Piro & Chang (2008) Piro, A. L., & Chang, P. 2008, ApJ, 678, 1158
- Rakowski et al. (2006) Rakowski, C. E., Badenes, C., Gaensler, B. M., et al. 2006, ApJ, 646, 982
- Raskin et al. (2010) Raskin, C., Scannapieco, E., Rockefeller, G., et al. 2010, ApJ, 724, 111
- Raskin et al. (2009) Raskin, C., Timmes, F. X., Scannapieco, E., Diehl, S., & Fryer, C. 2009, MNRAS, 399, L156
- Rest et al. (2014) Rest, A., Scolnic, D., Foley, R. J., et al. 2014, ApJ, 795, 44
- Reynolds et al. (2007) Reynolds, S. P., Borkowski, K. J., Hwang, U., et al. 2007, ApJ, 668, L135
- Reynoso & Goss (1999) Reynoso, E. M., & Goss, W. M. 1999, AJ, 118, 926
- Riess et al. (1998) Riess, A. G., Filippenko, A. V., Challis, P., et al. 1998, AJ, 116, 1009
- Rosswog et al. (2009) Rosswog, S., Kasen, D., Guillochon, J., & Ramirez-Ruiz, E. 2009, ApJ, 705, L128
- Safi-Harb et al. (2005) Safi-Harb, S., Dubner, G., Petre, R., Holt, S. S., & Durouchoux, P. 2005, ApJ, 618, 321
- Sankrit et al. (2005) Sankrit, R., Blair, W. P., Delaney, T., et al. 2005, Advances in Space Research, 35, 1027
- Seitenzahl et al. (2008) Seitenzahl, I. R., Timmes, F. X., Marin-Laflèche, A., et al. 2008, ApJ, 685, L129
- Seitenzahl et al. (2013) Seitenzahl, I. R., Ciaraldi-Schoolmann, F., Röpke, F. K., et al. 2013, MNRAS, 429, 1156
- Sim et al. (2010) Sim, S. A., Röpke, F. K., Hillebrandt, W., et al. 2010, ApJ, 714, L52
- Someya et al. (2014) Someya, K., Bamba, A., & Ishida, M. 2014, PASJ, 66, 26
- Stehle et al. (2005) Stehle, M., Mazzali, P. A., Benetti, S., & Hillebrandt, W. 2005, MNRAS, 360, 1231
- Tanaka et al. (2011) Tanaka, M., Mazzali, P. A., Stanishev, V., et al. 2011, MNRAS, 410, 1725
- Thielemann et al. (1986) Thielemann, F.-K., Nomoto, K., & Yokoi, K. 1986, A&A, 158, 17
- Tian & Leahy (2011) Tian, W. W., & Leahy, D. A. 2011, ApJ, 729, L15
- Timmes et al. (2003) Timmes, F. X., Brown, E. F., & Truran, J. W. 2003, ApJ, 590, L83
- Townsley et al. (2016) Townsley, D. M., Miles, B. J., Timmes, F. X., Calder, A. C., & Brown, E. F. 2016, ApJS, 225, 3
- Travaglio et al. (2004) Travaglio, C., Hillebrandt, W., Reinecke, M., & Thielemann, F.-K. 2004, A&A, 425, 1029
- Travaglio et al. (2011) Travaglio, C., Röpke, F. K., Gallino, R., & Hillebrandt, W. 2011, ApJ, 739, 93
- Van Der Walt et al. (2011) Van Der Walt, S., Colbert, S. C., & Varoquaux, G. 2011, ArXiv e-prints, arXiv:1102.1523
- van Kerkwijk et al. (2010) van Kerkwijk, M. H., Chang, P., & Justham, S. 2010, ApJ, 722, L157
- Vink (2016) Vink, J. 2016, ArXiv e-prints, arXiv:1612.06905
- Wang & Han (2012) Wang, B., & Han, Z. 2012, New A Rev., 56, 122
- Williams et al. (2014) Williams, B. J., Borkowski, K. J., Reynolds, S. P., et al. 2014, ApJ, 790, 139
- Woosley et al. (1971) Woosley, S. E., Arnett, W. D., & Clayton, D. D. 1971, Physical Review Letters, 27, 213
- Woosley & Kasen (2011) Woosley, S. E., & Kasen, D. 2011, ApJ, 734, 38
- Woosley & Weaver (1994) Woosley, S. E., & Weaver, T. A. 1994, ApJ, 423, 371
- Woosley et al. (2004) Woosley, S. E., Wunsch, S., & Kuhlen, M. 2004, ApJ, 607, 921
- Wunsch & Woosley (2004) Wunsch, S., & Woosley, S. E. 2004, ApJ, 616, 1102
- Yamaguchi et al. (2014) Yamaguchi, H., Badenes, C., Petre, R., et al. 2014, ApJ, 785, L27
- Yamaguchi et al. (2015) Yamaguchi, H., Badenes, C., Foster, A. R., et al. 2015, ApJ, 801, L31