VLBI ecliptic plane survey: VEPS–1
Abstract
We present here the results of the first part of the VLBI Ecliptic Plane Survey (VEPS) program. The goal of the program is to find all compact sources within of the ecliptic plane which are suitable as calibrators for anticipated phase referencing observations of spacecraft and determine their positions with accuracy at the 1.5 nrad level. We run the program in two modes: the search mode and the refining mode. In the search mode, a complete sample of all sources brighter than 50 mJy at 5 GHz listed in the Parkes-MIT-NRAO (PMN) and Green Bank 6 cm (GB6) catalogs, except those previously detected with VLBI, is observed. In the refining mode, the positions of all ecliptic plane sources, including those found in the search mode, are improved. By October 2016, thirteen 24-hr sessions that targeted all sources brighter than 100 mJy have been observed and analyzed. Among 3320 observed target sources, 555 objects have been detected. We also conducted a number of follow-up VLBI experiments in the refining mode and improved the positions of 249 ecliptic plane sources.
1 Introduction
One of the most important emerging Very Long Baseline Interferometry (VLBI) applications is the phase referencing observations of spacecraft. Such observations are used, for example, to provide wind measurements of the atmosphere of Titan (Lebreton et al., 2005), to improve the Saturn ephemerides by the astrometry of Cassini with the Very Long Baseline Array (VLBA) (Jones et al., 2015), and to measure the lateral position of the European Space Agency’s Mars Express (MEX) spacecraft during its closest ever flyby of the Martian moon Phobos (Duev et al., 2016). At the moment, there is the Chang′e 3 lander on the Moon (Liu et al., 2014; Li et al., 2015; Zheng et al., 2015) and in the near future another lander, Chang′e 5, will be placed on the Moon. Phase referencing observations of the radio beacon onboard these landers will be used to study the Moon’s libration and its response to solid tides induced by the Earth and the Sun. Another important application is to observe Mars landers, such as the InSight mission (2018) and the first Chinese Mars mission (2020), for measuring the parameters of the Martian rotation.
Nodding observations of a spacecraft and nearby calibrator radio sources allow us to measure its position offset with a precision of up to several tenths of a nanoradian (nrad)1111 nrad 0.2 milliarcsec (mas). One nrad corresponds to 0.4 m on the Moon’s surface and 100 m at the Martian orbit. However, position offsets are useless for the scientific applications of spacecraft observations. The goal of these observations is to determine the absolute positions of a spacecraft. The error of the absolute position is the quadrature sum of the error of the calibrator’s absolute position and the error of the position offset. The latter error largely depends on the angular distance between the target and the calibrator. Hence, phase referencing observations of spacecraft require a dense grid of calibrators along the ecliptic plane with their absolute positions known with the highest possible accuracy.
We consider that a source is suitable as a calibrator if its correlated flux density on the longest baseline of the array is above the 30 mJy level. A 30 mJy source is detected reliably at two antennas with the System Equivalent Flux Density (SEFD) 600 Jy for 50 s at a 2 Gbps data rate. Sometimes, when the received signals from a spacecraft are very strong, we can use the spacecraft as a phase calibrator source, which allows us to use much lower recording data rate. In the past 15 years, over 19,000 sources were observed in a number of dedicated astrometric VLBI observing campaigns (Beasley et al., 2002; Fomalont et al., 2003; Petrov et al., 2005, 2006; Kovalev et al., 2007; Petrov et al., 2007; Immer et al., 2011; Petrov & Taylor, 2011b; Petrov et al., 2011c; Petrov et al., 2011d; Petrov, 2012, 2011a, 2013; Schinzel et al., 2015, 2017). A cumulative all-sky catalog of 12,651 sources called rfc_2016d (Petrov and Kovalev, in preparation) 222Radio Fundamental Catalogue http://astrogeo.org/rfc was derived from the analysis of these observations. In this catalog, the calibrator sources can be divided into three classes: the 1st class, with position errors of less than 1.5 nrad, suitable for determining the absolute position of a target with the use of differential astrometry, the 2nd class, with position errors of less than 10 nrad, suitable for differential astrometry, and the 3rd class, with position errors of less than 100 nrad, suitable for imaging. We select the threshold of 1.5 nrad for the 1st class calibrators, because, above this level of position error, random measurement noise dominates. Below that level, the main contribution comes from systematic errors caused by mismodeled atmospheric path delay, source structure, and the core-shift. Improvement of source position accuracy better than 1.5 nrad requires significantly more observing resources.
The number of the 1st class calibrators in the ecliptic plane is still not sufficient for the needs of space navigation or scientific applications. There are two reasons: 1) prior surveys were not deep enough and missed many suitable weaker sources. 2) the majority of these calibrators were derived from very few observations. Many of them are made with a single band and, therefore, their position estimates were affected by systematic errors caused by the ionosphere.
In 2015, we launched the VLBI Ecliptic Plane Survey (VEPS) program with an ambitious goal to find all suitable calibrators. Based on our previous experience with running large VLBI surveys, we anticipated a detection rate in the range of 15–30%. Keeping this consideration in mind, we run the program in two modes: the search mode and the refining mode. In the search mode, we observed all the targets with the minimum array configuration. The objective of this step is just to detect all the sources with correlated flux densities greater than 30 mJy, determine their coarse positions with an accuracy of 10–50 nrad, and evaluate their average correlated flux density. In the refining mode, we observe in a large network all the sources detected in the search mode, as well as previously known sources, with an integration time sufficient for deriving their positions with an accuracy better than 1.5 nrad and generating their images. The two-step approach optimizes resource usage by significantly reducing time spent for observing the sources with emission from a compact region that is too weak to be detected.
In the search mode, all sources from the single-dish Parkes-MIT-NRAO (PMN) (Griffith & Wright, 1993) and Green Bank 6 cm (GB6) (Gregory et al., 1996) catalogs within of the ecliptic plane brighter than 50 mJy at 4.85 GHz are to be observed. Both input catalogs are considered complete to that level of flux density. Observations in this mode are performed at the X-band (8.2–9.0 GHz) only and use a 3–4 station network. In the refining mode, observations are performed at the S/X (2.3/8.4 GHz) or C/X (4.3/7.6 GHz) dual bands simultaneously with the use of a large network such as the VLBA, or the International VLBI Service for Geodesy and Astrometry (IVS) network in a high sensitivity mode. Here, we present the first results of the program derived from observations of all sources brighter than 100 mJy in the search mode and a number of sources observed in the refining mode.
2 Source selection
We have selected all objects within of the ecliptic plane, with single dish flux densities brighter than 50 mJy at 5 GHz from the PMN and GB6 catalogs, except those that a) have been detected with VLBI before and b) were observed with VLBI in a high sensitivity mode (detection limit better than 20 mJy), but too weak to be detected. Contrary to many prior surveys, we did not preselect targets based on source spectral index, since almost all the sources with flat spectra have already been observed. The PMN catalog has two small zones, located at ecliptic longitude, which misses sources due to solar contamination when the sidelobes of the antenna encountered the Sun, so those data have been expunged from the survey (Griffith et al., 1995). We included in these zones 789 sources from the NRAO VLA Sky Survey (NVSS) catalog (Condon et al., 1998) that are brighter than 50 mJy at 1.4 GHz.
In total, there are 7807 target sources in our list. Of those, approximately 1/3 have flux densities above 100 mJy and 2/3 have flux densities in the range 50 to 100 mJy. These flux densities were measured with a single dish telescope or connected interferometers with beam size –. Emissions from scales of 5–50 nrad detectable with VLBI represent only a fraction of the total emission at arcminute scales. Therefore, a number of sources are expected to have correlated flux densities below the detection limit.
We organized observations in such a way that the stronger sources were observed first and weaker sources were observed later.
3 Observations
3.1 Observations in the search mode
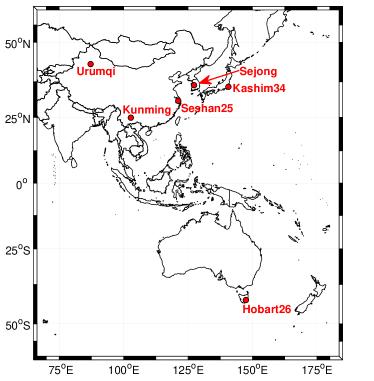
We began observations in the search mode in February 2015. The participating stations included the three core stations of the Chinese VLBI Network (CVN): seshan25, kunming, and urumqi. However, sometimes these stations were not available at the same time, or occasionally one of them had a risk of failure. In that case, one or two international stations joined. Depending on the participating stations, the longest baseline length in each session can be varied from 3200 km to 9800 km.
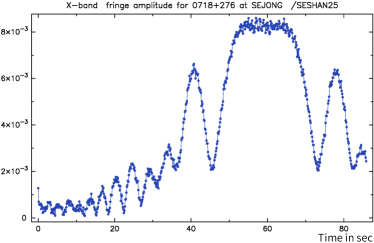
Figure 1 shows the geographical distribution of all participating stations. kashima34, sejong and hobart26 have contributed to past VEPS observations. They are relatively large antennas, and have good common visibility of the ecliptic zone. Before joining in the VEPS survey, we performed fringe tests to sejong, hobart26, and kashim34 in December 2014, July 2015, and January 2016, respectively.
Our observations were performed at a 2048 Mbps data rate with 16 Intermediate Frequency (IF) channels and 2-bit sampling. The first eight IFs of 32 MHz bandwidth were distributed in the range of [8.188, 8.444] GHz, and the remaining eight IFs of 32 MHz bandwidth were spread in the range of [8.700, 8.956] GHz. The data volume was around 16 TB for each station in one 24-hr session.
We used the Chinese VLBI Data Acquisition System (CDAS) for data acquisition at the Chinese stations, ADS3000+ at kashim34, and K5/VSSP32 for sejong. The maximum data rate of the K5/VSSP32 is limited to 1024 Mbps, so the data were sampled with 1 bit. For hobart26, the Digital Base-band Converter (DBBC) board was used. At the time, the firmware supported only 16 MHz-wide IFs, so we observed at 16 MHz-wide IFs instead and correlated them against the low parts of 32 MHz-wide IFs recorded at other stations.
Each target source was observed in two scans of 90 s length, with a gap between consecutive observations of the same source of at least 3 hr. The sequence of observations was optimized to minimize slewing time with the use of the astrometry VLBI scheduling software package sur_sked. Every 1 hr, four calibrators from the pool of 190 bright sources were inserted in the schedule. Two of them were observed at elevations below and two at elevations of or more above the horizon. They were also used for bandpass calibration, for antenna gain calibration, as ties for astrometric global solutions, and for improving the estimation of the atmosphere path delay in the zenithal direction.
| Date | Dur. | Code | Stationsaa Sh: Seshan25; Km: Kunming; Ur: Urumqi; Kv: Sejong; Kb: Kashim34; Ho: Hobart26. | # Targets |
|---|---|---|---|---|
| (YYYY-mm-dd) | (hrs) | |||
| 2015-02-13 | 24 | VEPS01 | ShKmUr | 293 |
| 2015-02-14 | 24 | VEPS02 | ShKmUr | 338 |
| 2015-04-23 | 24 | VEPS03 | UrKv | 300 |
| 2015-04-24 | 24 | VEPS04 | ShKmUrKv | 400 |
| 2015-08-10 | 25 | VEPS05 | ShKmKvHo | 252 |
| 2015-08-19 | 25 | VEPS06 | ShKmKvHo | 277 |
| 2016-03-02 | 24 | VEPS07 | ShKmUrKb | 333 |
| 2016-03-11 | 24 | VEPS08 | ShKmUrKb | 477 |
| 2016-05-13 | 24 | VEPS09 | ShUrHo | 291 |
| 2016-05-14 | 22 | VEPS10 | ShUrKv | 322 |
| 2016-07-06 | 24 | VEPS11 | ShUrKb | 307 |
| 2016-09-02 | 23 | VEPS12 | ShUr | 424 |
| 2016-09-03 | 23 | VEPS13 | ShKmUr | 344 |
By September 2016, 13 sessions had been observed. The summary of these observations is presented in Table 1. In general, the observations were successful, despite a number of failures. urumqi had a receiver problem in the first 12 hr in VEPS01. seshan25 and kunming made use of wrong B1950 source positions for antenna control in VEPS03. hobart26 had a timing problem after 9 hr in VEPS09. kunming data in VEPS012 were lost due to a hard disk failure. If a target source was not observed due to station failure, we reobserved it in the next VEPS sessions.
3.2 VLBA observations in the refining mode
We ran two absolute astrometry dual-band VLBA programs that targeted ecliptic plane compact radio sources: the dedicated survey of weak ecliptic plane calibrators with the VLBA, BS250 program in March–May 2016, and the VLBA Calibrator Survey 9 (VCS–9) in August 2015–September 2016.
The BS250 program had 111 target sources within of the ecliptic plane observed in four 8-hr segments. The targets were the weakest calibrators, with correlated flux densities at baseline projection lengths greater than 5000 km in the range [30, 50] mJy. Each target was observed in three scans of 180 s length. The target sources were scheduled in such a way that the minimum gap between their consecutive observations was at least 2 hr. Every 1.5 hr a block of four calibrators from the pool of bright sources was inserted in the schedule in such a way that two of them were observed at elevations below and two at elevations or more above the horizon, similar to the VLBI observations in the search mode. We used the same frequency setup for the BS250 as in the VCS-II program (Gordon et al., 2016): four IFs of 32 MHz bandwidth spread in the range of [2.22, 2.38] GHz and 12 IFs spread in the range of [8.43, 8.91] GHz recorded simultaneously at a 2 Gbps data rate. Of the 111 target sources, 37 were detected in the search mode of the VEPS program and the reminder were detected in other surveys.
The VCS–9 program has a goal of the densification of the grid of VLBI calibrators, and observed over 11,000 sources spread approximately uniformly over the sky at declinations above - in one scan of 60 s each. There is some overlap between the source lists of VCS–9 and VEPS. The position accuracy of the sources observed in VCS–9 is worse than those observed in the BS250 campaign, since its integration time was nine times less, but is still significantly higher than in the VEPS search mode. Therefore, we consider the VCS–9 program to be observations in the refining mode for the purposes of this study. By February 2017, about 1/2 of the VCS–9 observations had been processed, so we report here only the VCS–9 results available so far of the sources detected in the VEPS search mode. VCS–9 observed with the wide-band C-band receiver and recorded eight IFs, 32 MHz-wide, spread within [4.13, 4.61] GHz, and eight IFs spread within [7.39, 7.87] GHz simultaneously. Scheduling VCS–9 observations was done in a similar way to those of BS250, except only one scan per source was observed and the interval of time between calibrators was reduced to 1 hr. VCS–9 was observed in segments of 3.5–10 hr long.
3.3 IVS observations in the refining mode
The IVS runs a number of VLBI observing programs primarily for geodesy with occasional use for astrometry (e.g. Le Bail et al., 2016). As a subgroup of the IVS, the Asia-Oceania VLBI network (AOV), that includes facilities from five countries in the Asia-Oceania region: Australia, China, Japan, New Zealand and South Korea (Lovell et al., 2015), ran a number of experiments beginning in 2015. We made an attempt to improve the coordinates of some VEPS sources detected in the search mode and provide additional measurements of telescope position with the same experiments in two such 24-hr sessions, AOV010 in July and AUA012 in August 2016.
Both sessions included sensitive AOV antennas: parkes and hobart26 in Australia; seshan25, kunming and urumqi in China. In addition, tianma65 (Tianma 65m Radio Telescope, or TMRT) in China and tsukuba in Japan participated in AOV010. We conducted observations at a 1 Gbps data rate with 16 IFs of 16 MHz bandwidth and 2-bit sampling, which is the highest data rate that all of the participating stations were able to provide in 2016.
Since two geodetic stations, kashim11 and koganei could observe only within a narrow X-band (8.1–8.6 GHz), we adjusted the frequency sequence by balancing the uncertainty of the group delay and the amplitude of the highest side lobe in the delay resolution function. The following frequency sequence was used in the session AOV010: [8.19799, 8.21399, 8.23399, 8.25399, 8.33399, 8.41399, 8.51399, 8.53399, 8.55799, 8.57399] GHz. The amplitude of the highest side lobe is 0.52.
We used geodetic software sked (Gipson, 2016) for scheduling these experiments which is widely used in the preparation of many other IVS sessions. We set a group of weak sources as targets. Among them, 32 sources were previously detected in the VEPS search mode observations, with declinations in the range [-, -] and correlated flux densities in the range [30, 80] mJy. Besides that, a group of strong compact sources were selected automatically in order to provide a uniform sky coverage. We used the astrometric mode of sked for automatic scheduling, which is described in more details in Le Bail et al. (2016). After taking a few iterations by adjusting some control parameters of the sked, we were able to schedule 60% of the total number of observations for target sources, while keeping enough scans for small antennas to achieve the geodesy goals.
4 Data processing
4.1 Data correlation
We correlated the VEPS search mode observations and the IVS sessions with the DiFX software correlator (Deller et al., 2011), which was installed on a powerful hardware platform in 2014 (Shu et al., 2015) at the Sheshan Campus of the Shanghai Astronomical Observatory. The data from the Chinese domestic stations were recorded on disk packs and then shipped to Shanghai, while the data from international stations were transferred to Shanghai via a high speed network. The data volume for each station is approximately 16 TB, eight times bigger than that recorded in regular IVS geodetic sessions, so the data correlation of one VEPS session usually took more than 24 hr.
Correlation of mixed observing modes with different bandwidths or sampling bits can be challenging. Fortunately the DiFX can fully support the correlation of 1-bit sampled data from sejong against 2-bit sampled data from the other stations. For the correlation of 16 MHz bandwidth data from hobart26 against the 32 MHz bandwidth data from the other stations, the zoom mode was selected to pick up the overlapped frequency band. Moreover, it was optional to make correlations only on the 16 MHz bandwidth on the baselines to hobart26, while the other stations with 32 MHz bandwidth went through an independent correlation pass, the same as the usual correlation procedures. We selected an accumulation period of 0.125 s, and 512 spectral channels per IF. This setup provides a wide field of view that allowed us to detect a source within several arcminutes of their a priori position. In fact, we observed fields around the pointing direction rather than individual sources.
Correlation of the VLBA experiments was performed at the Socorro array control center using the same DiFX software correlator. The DiFX correlator output was converted into FITS-IDI format using the difx2fits program for further analysis.
4.2 Post-correlation analysis
The visibility data produced by the correlator were then processed using the VLBI data analysis software 333See http://astrogeo.org/pima. A detailed description of the analysis strategy and a comparison between the methods adopted in the past and those used for processing our data can be found in Petrov et al. (2011c). We ran the pipeline that includes a coarse fringe search, manual adjustment of phase calibration, generation of the auto-correlation and cross-correlation bandpass masks, computation of the complex bandpass calibration, a fine fringe search, amplitude calibration, amplitude normalization and computation of the total group delay. The group delays, fringe amplitudes and related information were written in databases for further analysis.
The databases were loaded into the VTD/Post-Solve software444See http://astrogeo.org/vtd for preliminary astrometric data analysis. At the beginning of the astrometric analysis, we discarded observations with a signal to noise ratio (SNR) of less than six, which corresponds to the probability of false detection around 0.001. The SNR is defined here as the ratio of the peak amplitude to the mean amplitude of the noise. In the beginning, we used a coarse parameter estimation model: we estimated only the positions of the sources not detected before with VLBI and a clock function that is represented by a linear spline with knots placed at equal intervals of 1 hr. After the elimination of outliers, we refined the model by adding an estimation of source positions and residual atmosphere path delay in the zenithal direction. Then we reduced the SNR limit gradually to 5.2. We discarded all new sources with less than two detections.
Then we updated the source positions, reran fringe fitting and repeated the procedure of astrometric data analysis. For those sources that were marked as outliers after the second step of iterations, we computed the expected group delay based on results of parameter estimation. Then we reran fringe fitting for these observations with a narrow fringe search window and repeated the astrometric analysis.
Databases cleaned for outliers were saved for the final astrometric analysis.
4.3 Astrometric analysis
We ran an astrometric analysis in the global mode, which is the usual approach for processing absolute astrometry VLBI surveys (Petrov et al., 2007). That means we used all VLBI experiments in geodesy and absolute astrometry acquired so far, and the new data. We ran two solutions. In solution A we used all geodesy data acquired until December 1, 2016, absolute astrometry VLBI data acquired until January 1, 2015 (before the start of the VEPS program) and the VEPS–1 data in the search mode. In solution B we used all dual-band VLBI data acquired until February, 2017, including the BS250 and VCS–9 campaigns, but excluding single-band group delays acquired in the search mode of the VEPS program.
We estimated source coordinates, station positions and velocities as global parameters; pole coordinates, UT1 angle, their rates, and daily nutation offsets for every observing session; clock function and residual zenith path delay in the atmosphere modeled with a B-spline of the first degree with a step of 60 and 20 min respectively. No-net-rotation constraints were applied to the estimates of the source coordinates in such a way that the net rotation of 212 sources marked as “defining” in the ICRF catalog (Ma et al., 1998) was zero with respect to their catalog positions. The data analysis procedure is very close to that used for deriving other VLBI catalogs, e.g. in Petrov (2013).
We added in quadrature a floor of 0.5 nrad to the position uncertainties computed with the law of error propagation in order to accommodate the contribution of unaccounted systematic errors. The value of the floor was found empirically from the set of trial solutions and comparisons of the source coordinate estimates from independent subsets of observations. The uncertainties inflated with the given floor are in a closer agreement with the differences in source coordinate estimates from VLBA observations.
Since VEPS search mode experiments were observed in the single band, we computed the ionosphere contribution from the total electron content (TEC) maps provided by the CODE analysis center for processing Global Navigation Satellite System data (Schaer, 1998) using the technique described in detail in Petrov et al. (2011c). Our previous extensive analysis of the residual contribution of the ionosphere at 8 GHz to the source coordinate estimates after applying the a priori path delays computed from TEC maps to the data reduction model does not exceed 7.5 nrad in quadrature in the worst case (Petrov et al., 2011d). Since uncertainties of source positions derived from VEPS search mode observations are greater than that, we just ignored the contribution due to errors in the TEC model.
4.4 Imaging analysis of VLBA observations
Using the results of fringe fitting, we applied the task splt to perform coherent averaging over time and frequency after phase rotation according to group delays and phase delay rates, apply calibration for system temperature, gain curves, bandpass renormalization, combine all visibilities of a given source, and write averaged visibilities and their weights into output binary files in the FITS format. The data were then suitable for imaging with the NRAO Astronomical Image Processing System (AIPS) and the Caltech difmap package (Shepherd et al., 1994).
We ran this procedure through all segments of the BS250 campaign. Some sources were observed in more than one segment and, since the observations took place within two months, we ignored possible source variability and merged the calibrated visibilities.
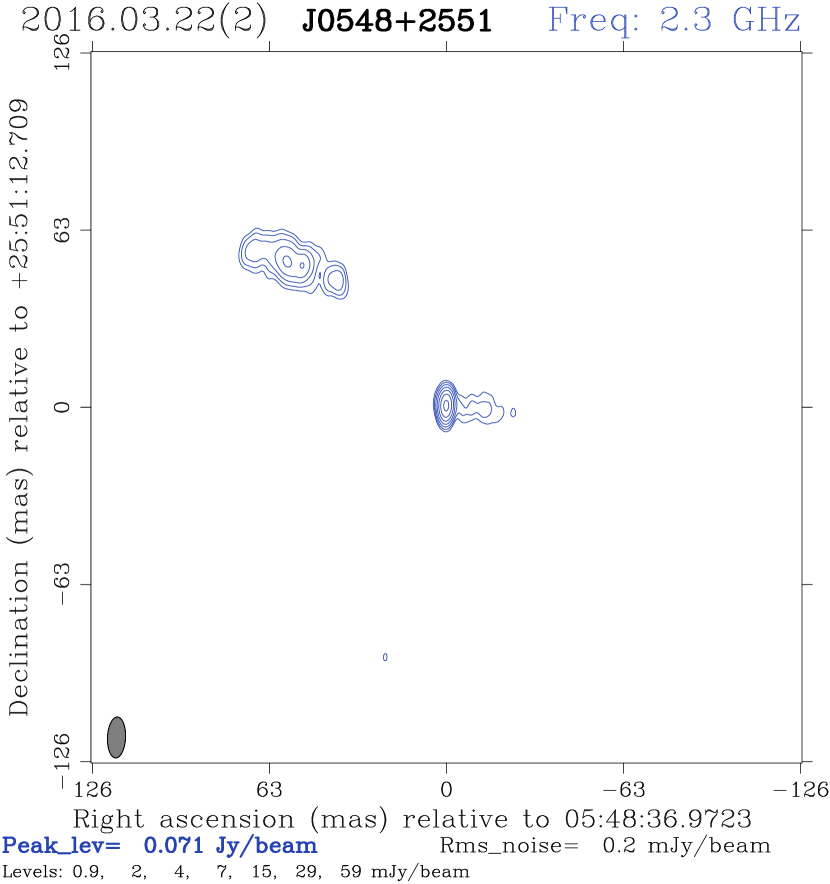
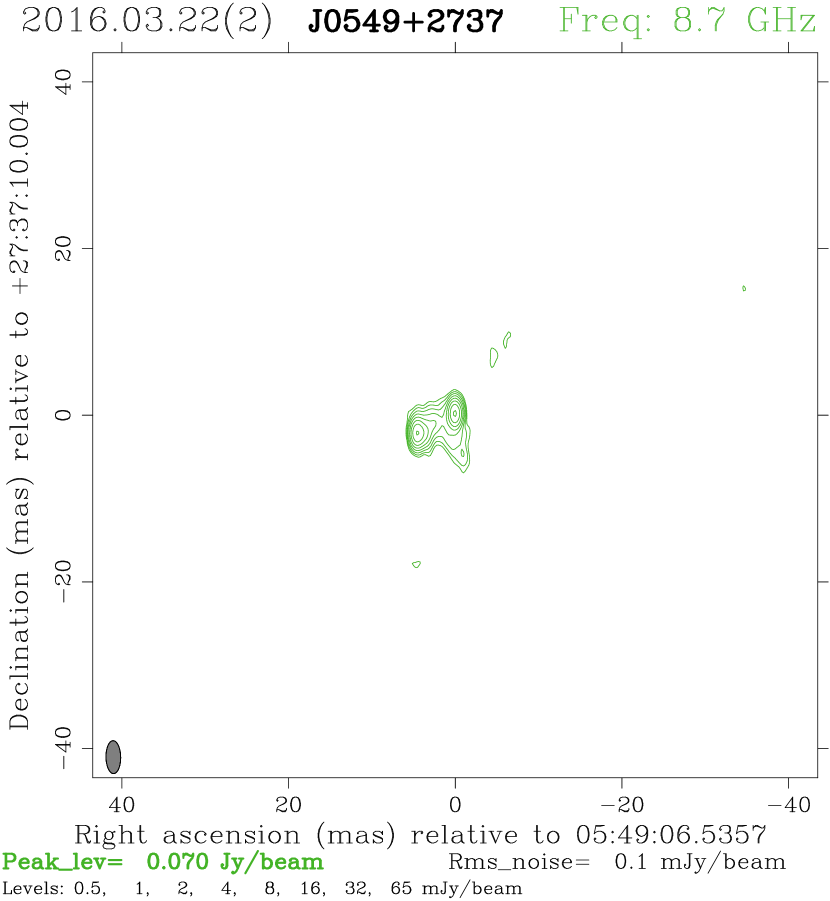
The visibilities coherently averaged over all spectral channels within an individual IF and over time with an integration time of 8 s. The resulting data were exported to difmap for imaging and calibrating the residual phase errors. We performed a traditional hybrid mapping procedure consisting of several iterations of cleaning (Högbom, 1974) and phase and amplitude self-calibration. We first self-calibrated the phases against a model of point-like sources using the startmod task. Then we performed phase self-calibration and mapping under uniform weighting, followed by natural weighting. Every source was first imaged with an automatic pipeline. The results were examined and those sources for which the automatic pipeline did not provide satisfactory results were reimaged manually. The main reason for manual reimaging was the necessity to remove outliers due to inaccurate on-off source flagging, and due to spikes in system temperature readings caused by radio frequency interference (RFI). Thus the data were edited and those parameters including clean boxes were set by hand in order to avoid the big sidelobes and get more correct morphology. Figure 2 shows some sample images. The final images in FITS format, as well as self-calibrated visibilities, are accessible from the project web site http://astrogeo.org/veps.
Images are necessary for planning phase referencing observations in order to predict the necessary integration time. We are going to reanalyze the data with the source structure contribution applied in the future in order to improve position accuracy and to tie the reported position to a particular source image feature.
4.5 Amplitude analysis in VEPS–1 experiments
Since the VEPS search mode sessions had too few observations per source, typically 2–6, imaging was not feasible. Instead, we used the non-imaging procedure developed in Petrov et al. (2011d) for computing the mean correlated flux density. Firstly, we calibrated the raw visibilities data for the a priori antenna gain and system temperature : . Secondly, we adjusted antenna gains using publicly available brightness distributions of the calibrator sources made with observations under other programs that can be found in the Astrogeo VLBI FITS Image Database555http://astrogeo.org/vlbi_images. Using images in the form of CLEAN components, we computed the predicted flux densities of the calibrator sources for every observation. Using logarithms of the flux densities of the calibrator sources derived from the calibrated visibilities and from known images, we computed the multiplicative gain corrections using least squares. These gain corrections were applied to the target sources and the correlated flux density estimates were corrected for errors in a priori gain calibration. This procedure is known to have errors of around 15% (Petrov et al., 2011d, 2012).
5 Results
| IAU source name | J2000.0 source coordinates | Position errors | |||||||
| F | B-name | J-name | Right ascension | Declination | Corr | # obs | |||
| h m s | mas | mas | Jy | ||||||
| (1) | (2) | (3) | (4) | (5) | (6) | (7) | (8) | (9) | (10) |
| 2358072 | J00010656 | 00 01 25.586899 | 06 56 24.93216 | 1.56 | 3.24 | 0.052 | 6 | 0.051 | |
| V | 2359038 | J00020331 | 00 02 30.622538 | 03 31 40.45732 | 4.14 | 10.57 | 0.239 | 5 | 0.022 |
| 0000044 | J00020411 | 00 02 41.255161 | 04 11 55.30522 | 2.27 | 3.94 | 0.596 | 6 | 0.023 | |
| 0000006 | J00020024 | 00 02 57.175395 | 00 24 47.27274 | 2.33 | 5.98 | 0.841 | 4 | 0.035 | |
| … | |||||||||
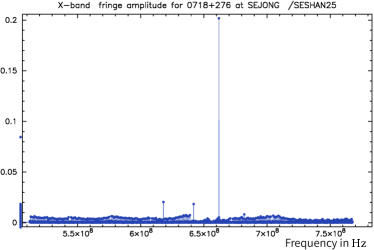
We found 520 sources in the VEPS–1 program with three or more good observations and 51 sources with two observations out of 3320 target sources observed. The minimum number of observations for the determination of source coordinates is two. However, if only two observations are used for deriving source positions and one of them is bad, i.e. either affected by the RFI or affected by a failure in the fringe fitting process, such an error will not be noticed but can shift the estimate of source position by a large amount, up to several arcminutes. Three good observations used in the least square solution provide the minimum redundancy and greatly reduce the probability that the source position is affected, to a non-negligible level, by an unnoticed failure in group delay determination. However, there were two experiments in the VEPS search mode that had usable data from only a single baseline because of station failures. Therefore, we examined all observations of the sources that had only two detections. We discarded observations that had a SNR 7, which is about 20% above the detection limit, and then manually screened fringe plots for abnormalities among the remaining observations. Usually, sources of RFIs are narrow-band and have a terrestrial origin. Therefore, their spectrum has sharp peaks and the fringe amplitude has strong dependence on time, since phase rotation that compensates for the Earth’s rotation was added during correlation. Figures 3–4 illustrate the dependence of fringe amplitude on frequency and time of observation affected by the RFI. This dependence is supposed to be flat for normal observations. Since in that case the peak of the fringe amplitude was exactly at 8.850 GHz, we conclude that the peak was caused by local interference generated by the VLBI hardware. We analyzed the pattern of fringe phase and fringe amplitudes and removed from the dataset the observations with similar pattern. If a source was observed in only two scans, the dataset has no redundancy and when we estimate source coordinates, unlike the case when there are three or more observations, the residuals will be very close to zero even for observations with group delay severely corrupted by the RFI. We kept 35 sources detected with only two observations with SNR and without abnormalities in their fringe plots, though there is a risk of large offset for the position estimates of a few sources.
The SEFD at stations urumqi, seshan25, kunming, and kashima in elevations 20– was in the range of 300–800 Jy. The detection limit at the baselines with these sensitive antennas was in the range of 13–18 mJy. The SEFD at hobart26 was in the range of 1300–1800 Jy and at sejong was in the range of 3000–5000 Jy. The detection limit at the baselines with hobart26 or sejong was in a range 30–60 mJy. All the sources, except 51 mentioned above, have at least three observations at sensitive baselines. Therefore, we conclude that we have detected all target sources with a correlated flux density greater than 20 mJy. The detection rate was 19% for the sources with galactic latitude and almost two times less, 8.5%, for the sources with galactic latitude .
| IAU source name | J2000.0 source coordinates | Position errors | Flux density estimates | |||||||||||
| F | B-name | J-name | Right ascension | Declination | Corr | #obs | ||||||||
| h m s | mas | mas | Jy | Jy | Jy | Jy | Jy | Jy | ||||||
| (1) | (2) | (3) | (4) | (5) | (6) | (7) | (8) | (9) | (10) | (11) | (12) | (13) | (14) | (15) |
| B | 2358080 | J00010746 | 00 01 18.024906 | 07 46 26.92254 | 0.28 | 0.58 | 0.069 | 89 | 0.180 | 0.073 | 0.214 | 0.111 | ||
| V | 2359038 | J00020331 | 00 02 30.622737 | 03 31 40.44165 | 1.84 | 5.01 | -0.029 | 19 | 0.022 | 0.023 | 0.026 | |||
| V | 0002018 | J00050132 | 00 05 07.071782 | 01 32 45.12985 | 0.65 | 1.60 | -0.157 | 35 | 0.042 | 0.026 | 0.056 | 0.025 | ||
| B | 0007016 | J00090157 | 00 09 58.657674 | 01 57 55.14930 | 0.24 | 0.47 | 0.050 | 161 | 0.092 | 0.039 | 0.153 | 0.042 | ||
| … | ||||||||||||||
Table 2 presents the VEPS–1 catalog of 555 target sources from the astrometric solution A. The first column contains a flag that shows whether a given source was observed in the VCS–9, the BS250 or the IVS campaigns, but whose positions were derived solely from VEPS search mode observations. The semimajor axis of the error ellipse ranges from 3.2 to 648 nrad, with median value of 20.7 nrad. For almost all the sources, the thermal errors dominate the systematic errors induced by the residual ionosphere. As a measure of source brightness, we use the median correlated flux density. The correlated flux density can vary by more than one order of magnitude for a resolved source with core-jet morphology, depending on the baseline vector projection. Therefore, the median flux density provides the upper limit of the unresolved flux density and should be used with care. The median flux density of the VEPS–1 catalog varies in the range of 0.013 to 0.34 Jy with the median 0.051 Jy.
Table 3 presents the positions of the 249 objects derived from the VLBA and IVS observations of the sources within of the ecliptic plane. Their coordinates were estimated in the solution B. It should be noted that 4 weak sources observed in VCS–9 have position errors larger than 70 nrad due to limited observations. The semimajor axis of the error ellipse for the remaining 245 sources ranges from 0.5 to 46 nrad, with the median value of 3.0 nrad, which is a factor of seven less than the position errors derived from the analysis of VEPS observations in the search mode. The last six columns contain estimates of flux densities at 8, 4, and 2.3 GHz, the total flux density computed by the integration of all CLEAN components in the image, and the unresolved flux density, defined as the median flux density at baseline projection lengths greater than 5000 km. The correlated flux density at a given baseline projection vector will be within the range of the unresolved and the total flux density. These flux density estimates were derived from source images. The images used for the generation of the estimates of flux densities are publicly available from the Astrogeo VLBI FITS image database.
6 Discussion
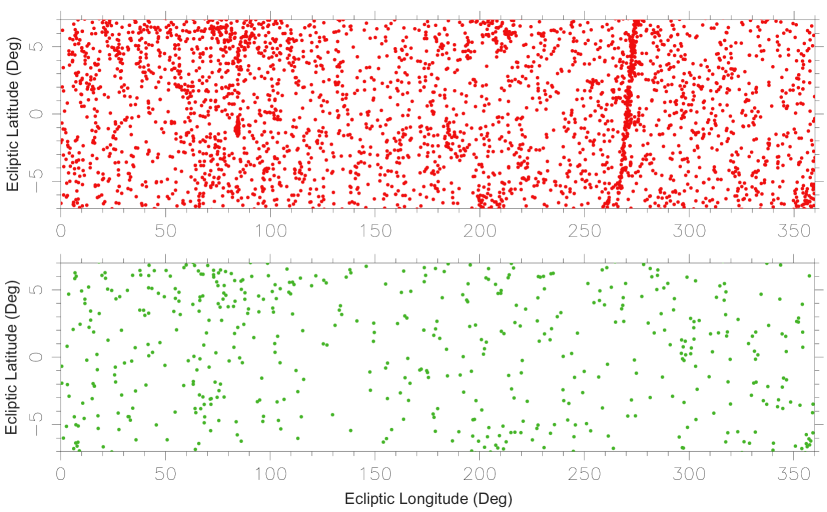
The distribution of the undetected and detected sources observed in the search mode is presented in Figure 5. All the target sources with single-dish flux densities at 5 GHz greater than 100 mJy have been observed, except for the zone within galactic latitude in the range of right ascensions of 17–19 hr. There are two reasons. Firstly, there are more targets near the galactic plane. The majority of them are galactic sources but we do not know beforehand which ones are galactic and which are extra-galactic objects. Secondly, the VEPS search mode observations have a shorter visible time for those low declination sources, so there are fewer chances to pick them up in the schedules. In order to increase the detection rate, we plan to observe that zone in a few 8-hr segments with tianma65, in addition to the regular CVN stations.
Statistics of VLBI detected sources within of the ecliptic plane are shown in Table 4. The number of known calibrators in the ecliptic plane grew by over 60% for two years and reached 1253 objects. At the same time, only 29% of the ecliptic calibrators have been determined with position uncertainties less than 1.5 nrad using S/X or C/X dual-band VLBI.
| 2015.0 | 2017.2 | |
|---|---|---|
| # calibrators of the 1st class | 187 | 365 |
| # calibrators of the 2nd class | 729 | 994 |
| # calibrators of the 3rd class | 768 | 1253 |
| # non-calibrators | 386 | 757 |
| Total # all sources | 1154 | 2010 |
Note. — A calibrator of the 1st class, the 2nd class and the 3rd class has flux density greater than 30 mJy and a position uncertainty less than 1.5 nrad, 10 nrad, and 100 nrad respectively.
Table 5 shows the statistics of the semimajor error ellipse axes of the position estimates of the sources that were observed in four modes. The position accuracy derived from the BS250 is 65% below the goal. Approximately a factor of two increase in on-source time is needed to reach the 1.5 nrad accuracy goal. But we should note that the target sources for the BS250 campaign were the weakest among the ecliptic plane calibrators.
| Mode | # Src | 50p | 80p |
|---|---|---|---|
| Search | 555 | 20.7 | 38.9 |
| IVS | 32 | 5.3 | 9.3 |
| VCS–9 | 109 | 5.2 | 8.1 |
| BS250 | 108 | 1.9 | 2.5 |
The accuracy of the source positions derived from IVS experiments AOV010 and AUA012 was worse than that of the VLBA experiments. On one hand, the VLBA has ten identical sensitive antennas which can form 45 baselines. As a comparison, a ten-station IVS network is inhomogeneous, with one or two big antennas and more small antennas. Such a configuration significantly reduces the number of baselines which can observe weak target sources. On the other hand, the VLBA using a 2 Gbps recording data rate could bring better results. Another reason is that the geodetic scheduling strategy is not very suitable for astrometry projects. The scheduling software sked has a tendency to split observations into subarrays, which is acceptable for geodesy when very strong sources are observed, but detrimental for the astrometry of weak targets. The software also tends to schedule two consecutive scans with a large antenna slew angle, which reduces the observation efficiency and results in fewer scans in one session. Hence, the scheduling strategy needs to be improved in future astrometric observations.
7 Concluding remarks
The VEPS program is underway to search for all suitable calibrator sources in the ecliptic plane with a 3–4 element VLBI network. Over 3000 target sources have been observed in the search mode in 13 sessions, for a total of 310 hr. We have detected 555 ecliptic plane sources with VLBI for the first time. The detection limit in the search mode was below 20 mJy, which is sufficient for the goal of phase referencing observations. These results demonstrate the validity of our approach. We have reobserved 249 sources with the VLBA and the IVS network, and improved their position estimates. However, these observations were not sufficient to reach the goal of 1.5 nrad position accuracy: only 29% of the ecliptic plane calibrators have position accuracies at that level.
In the next step, we plan to continue the observations of remaining target sources in the search mode, and improve positions of ecliptic calibrators to the 1.5 nrad level. We estimate that approximately 250 hr of observing time at the VLBA or IVS is needed to obtain the positions of all 1253 ecliptic plane calibrators to that level, and around 150 hr more for reobservations of anticipated 400 calibrators that will be found upon completion of the VEPS program in the search mode.
References
- Beasley et al. (2002) Beasley, A. J., Gordon, D., Peck, A. B., et al. 2002, ApJS, 141, 13
- Condon et al. (1998) Condon, J. J., Cotton, W. D., Greisen, E. W., et al. 1998, AJ, 115, 1693
- Deller et al. (2011) Deller, A. T., Brisken, W. F., Phillips, C. J., et al. 2011, PASP, 123, 275
- Duev et al. (2016) Duev, D. A., Pogrebenko, S. V., Cimò, G., et al. 2016, A&A, 593, A34
- Fomalont et al. (2003) Fomalont, E., Petrov, L., McMillan, D. S., et al. 2003, AJ, 126, 2562
- Gipson (2016) Gipson, J. M. 2016, accessible at http://lupus.gsfc.nasa.gov/files_user_manuals/sked/SkedManual_v2016Dec09.pdf
- Gordon et al. (2016) Gordon, D., Jacobs, C., Beasley, A., et al. 2016, AJ, 151, 154
- Gregory et al. (1996) Gregory, P. C., Scott, W. K., Douglas, K., et al. 1996, ApJS, 103, 427
- Griffith & Wright (1993) Griffith, M. R., Wright, A. E. 1993, AJ, 105, 1666
- Griffith et al. (1995) Griffith, M. R., Wright, A. E., Burke, B. F., et al. 1995, ApJS, 97, 347
- Högbom (1974) Högbom, J.A. 1974, A&AS, 15, 417
- Immer et al. (2011) Immer, K., Brunthaler, A., Reid, M. J., et al. 2011, ApJS, 194, 25
- Jones et al. (2015) Jones, D. L., Folkner, W. M., Jacobson, R. A, et al. 2015, AJ, 149, 28J
- Kovalev et al. (2007) Kovalev, Y. Y., Petrov, L., Fomalont, E., et al. 2007, AJ, 133, 1236
- Le Bail et al. (2016) Le Bail, K., Gipson, J. M., Gordon, D., et al. 2016, AJ, 151, 79
- Lebreton et al. (2005) Lebreton, J.-P., Witasse, O., Sollazzo, C., et al. 2005, Nature, 438, 758
- Li et al. (2015) Li, C., Liu, J., Ren, X., et al. 2015, SSRv, 190, 85
- Liu et al. (2014) Liu, Q. H., Zheng, X., Huang, Y., et al. 2014, Radio Science, 49, 1080
- Lovell et al. (2015) Lovell, J., Kawabata, R., Kurihara, S., et al. 2015, in Proceedings of the 22nd European VLBI Group for Geodesy and Astrometry Working Meeting, edited by R. Haas and F. Colomer, 117
- Ma et al. (1998) Ma, C., Arias, E. F., Eubanks, T. M., et al. 1998, AJ, 116, 516
- Petrov et al. (2005) Petrov, L., Kovalev, Y. Y., Fomalont, E., et al. 2005, AJ, 129, 1163
- Petrov et al. (2006) Petrov, L., Kovalev, Y. Y., Fomalont, E., et al. 2006, AJ, 131, 1872
- Petrov et al. (2007) Petrov, L., Kovalev, Y. Y., Fomalont, E., et al. 2007, AJ, 136, 580
- Petrov (2011a) Petrov, L., 2011a, AJ, 142, 105
- Petrov & Taylor (2011b) Petrov, L., Taylor, G., 2011b, AJ, 142, 89
- Petrov et al. (2011c) Petrov, L., Kovalev, Y. Y., Fomalont, E., et al. 2011c, AJ, 142, 35
- Petrov et al. (2011d) Petrov, L., Phillips, C., Bertarini, A., et al. 2011d, MNRAS, 414(3), 2528
- Petrov (2012) Petrov, L., 2012, MNRAS, 416, 1097–1105
- Petrov et al. (2012) Petrov, L., Lee, S.-S., Kim, J., et al. 2012, AJ, 144, 150
- Petrov (2013) Petrov, L., 2013, AJ, 146, 5
- Schaer (1998) Schaer, S. 1998, Ph.D. thesis, Univ. Bern; accessible at ftp://ftp.unibe.ch/aiub/papers/ionodiss.ps.gz
- Schinzel et al. (2015) Schinzel, F., Petrov, L, Taylor, G., et al. 2015, ApJS, 217, 4S
- Schinzel et al. (2017) Schinzel, F., Petrov, L, Taylor, G., et al. 2017, ApJ, 838, 139
- Shepherd et al. (1994) Shepherd, M. C., Pearson, T. J., & Taylor, G. B. 1994, BAAS, 26, 987
- Shu et al. (2015) Shu, F., Zheng, W., Jiang, W., et al. 2015, in International VLBI Service for Geodesy and Astrometry 2014 Annual Report, edited by K. D. Baver, D. Behrend, and K. L. Armstrong, NASA/TP-2015-217532, 171
- Zheng et al. (2015) Zheng, W., Tong, F., Zhang, J., et al. 2015, in Proceedings of the 22nd European VLBI Group for Geodesy and Astrometry Working Meeting, edited by R. Haas and F. Colomer, 268