Nitrogen Fractionation in protoplanetary disks from the / ratio
Abstract
Nitrogen fractionation is commonly used to assess the thermal history of Solar System volatiles. With ALMA it is for the first time possible to directly measure ratios in common molecules during assembly of planetary systems. We present ALMA observations of the and lines at angular resolution, toward a sample of six protoplanetary disks, selected to span a range of stellar and disk structure properties. Adopting a typical ratio of 70, we find comet-like ratios of in 5/6 of the disks (3 T Tauri and 2 Herbig Ae disks) and lack constraints for one of the T Tauri disks (IM Lup). There are no systematic differences between T Tauri and Herbig Ae disks, or between full and transition disks within the sample. In addition, no correlation is observed between disk-averaged D/H and ratios in the sample. One of the disks, V4046 Sgr, presents unusually bright HCN isotopologue emission, enabling us to model the radial profiles of and . We find tentative evidence of an increasing ratio with radius, indicating that selective photodissociation in the inner disk is important in setting the ratio during planet formation.
Subject headings:
astrochemistry – ISM: clouds – ISM: molecules – radiative transfer – radio lines: ISM1. Introduction
| Source | Beam | PA | Channel rmsa | Mom. zero rmsa | Beam | PA | Channel rmsa | Mom. zero rms |
| arcsec | mJy beam-1 | mJy km s-1 | arcsec | mJy beam-1 | mJy km s-1 | |||
| AS 209 | 4.3 | 7.6 | 3.4 | 6.5 | ||||
| IM Lup | 3.4 | 5.6 | 3.0 | 5.2 | ||||
| LkCa 15 | 3.2 | 6.3 | 2.9 | 5.7 | ||||
| V4046 Sgr | 3.4 | 10.4 | 3.2 | 9.4 | ||||
| MWC 480 | 3.3 | 7.0 | 3.1 | 6.7 | ||||
| HD 163296 | 2.6 | 6.9 | 2.4 | 6.4 | ||||
a Channel rms noise in 0.5 km s-1 channel width.
| Source | Distance | Spectral | Age | Disk Incl. | Disk PA | |||||
| pc | type | Myr | yr-1 | deg | deg | km s-1 | ||||
| T Tauri | ||||||||||
| AS 209 | 126 | K5 | 1.6 | 0.9 | 1.5 | 51 | 38 | 86 | 0.015 | 4.6 |
| IM Lup | 161 | M0 | 1 | 1.0 | 0.93 | 0.01 | 50 | 144.5 | 0.17 | 4.4 |
| LkCa 15 | 140 | K3 | 3-5 | 0.97 | 0.74 | 1.3 | 52 | 60 | 0.05-0.1 | 6.3 |
| V4046 Sgr | 72 | K5,K7 | 24 | 1.75 | 0.49,0.33 | 0.5 | 33.5 | 76 | 0.028 | 2.9 |
| Herbig Ae | ||||||||||
| MWC 480 | 142 | A4 | 7 | 1.65 | 11.5 | 126 | 37 | 148 | 0.11 | 5.1 |
| HD 163296 | 122 | A1 | 4 | 2.25 | 30 | 69 | 48.5 | 132 | 0.17 | 5.8 |
Note: Table reproduced from Huang et al. (2017), where a complete list of references is given.
The origin of Solar System organics is a fundamental and highly debated topic. It is unclear whether the organics in the different Solar System bodies were inherited from the cold and dense molecular parent cloud of our Sun, or if they are the result of chemical processing within the Solar nebula protoplanetary disk. The isotopic composition of present day organics may help to shed light on their origins, since isotopic fractionation chemistry is highly environment specific and can leave a permanent imprint. Comets are especially interesting in this context, since they should preserve the isotopic compositions in different molecules during the assembly of the Solar System.
Among the different methods used to trace the origin of molecules, the isotopic ratio is one of the most popular ones. Nitrogen isotopic ratios span at least an order of magnitude between different Solar System bodies. A low nitrogen fractionation (high ) is observed toward the Sun and Jupiter (; Marty et al., 2011), while a high fractionation is observed in the rocky planets, comets and meteorites (; Mumma & Charnley, 2011). The origin of these variations is not well understood, but it suggests that different Solar System bodies obtained their nitrogen from different nitrogen reservoirs (Mumma & Charnley, 2011). Based on observations of the Interstellar Medium (ISM), comets and chemical models, there are three major nitrogen reservoirs in dense interstellar and circumstellar media, N2, NH3 and HCN. These species have different fractionation pathways (e.g., Hily-Blant et al., 2013), and it is thus important to measure the ratio in molecules representative of these nitrogen reservoirs.
This study focuses on HCN. HCN is readily detected in the ISM (e.g., Liszt & Lucas, 2001; Hily-Blant et al., 2013), comets (e.g., Bockelée-Morvan et al., 2008) and protoplanetary disks (e.g., Thi et al., 2004; Öberg et al., 2010, 2011; Chapillon et al., 2012). While several studies have been made toward prestellar cores and protostars, the characterization of isotopic ratios in protoplanetary disks is rather new due to the intrinsic weak line emission. Guzmán et al. (2015) presented the first detection of and in the disk around Herbig Ae star MWC 480, and provided the first measurement of the in a disk. They found an isotopic ratio of , which is similar to what is observed in the cold ISM and in comets.
The low value in the MWC 480 disk implies either inheritance of HCN from the ISM, or the presence of an active fractionation chemistry in the disk. There are two potentially active fractionation channels in disks and in the ISM. The first is through isotope exchange reactions, such as
| (1) |
which favor the incorporation of 15N into molecules at low temperatures ( K). can later recombine with free electrons to produce . Observations of HCN and HNC fractionation toward protostars present a tentative trend of the with temperature, supporting this scenario (Wampfler et al., 2014). The second mechanism is selective photo-dissociation of 14N15N over 14N2, due to self-shielding of 14N2 (Heays et al., 2014). In the surface layers of protoplanetary disks, which are directly illuminated by the radiation field of the central star, the dominant formation pathways leading to HCN and are
| (2) |
| (3) |
Both mechanisms can reduce the HCN/ ratio in protoplanetary disks (Lyons et al., 2009; Heays et al., 2014). Distinguishing between these different origins of nitrogen fractionation levels in disks and between inheritance and in situ disk fractionation chemistry (and further in comets and planets) requires more disk measurements, and constraints on the radial profiles of the ratio in disks with different structures and around stars with different radiation fields. A constant ratio across disks would favor a scenario where disks inherit their organics from the natal cloud, while disk chemistry should result in a radial gradient, since the disk environment is dramatically different at different radii.
To begin to address this long-term goal, we present observations of and in a diverse sample of 6 protoplanetary disks. Because the HCN lines may be optically thick, we use the line as a proxy of HCN to derive the ratio. In section 2 we present the observations and describe the data reduction process. The disk-averaged isotopic flux ratios derived from the observations are presented in Section 3. In Section 4, we model the disk abundance profiles of and in V4046 Sgr, the source with the highest signal-to-noise ratio detection. In Section 5, we discuss the results and compare with observations in our Solar System and in the cold ISM. A summary is presented in Section 6.
2. Observations and data reduction
The and lines were observed with ALMA during Cycle 2 as part of project ADS/JAO.ALMA#2013.1.00226. The Band 6 observations included two spectral settings, at 1.1 and 1.4 mm. The correlator setup of the 1.1 mm and 1.4 mm settings were configured with 14 and 13 narrow spectral windows, respectively, targeting different molecular lines. The main targets of the observations were deuterated species, which are presented in Huang et al. (2017). They include an independent analysis of the data in the context of D/H fractionation. A focused study on the DCO+ emission in IM Lup was presented earlier by Öberg et al. (2015). The data in MWC 480 was also used for the study of CH3CN by Öberg et al. (2015). In addition, Guzmán et al. (2015) presented the and data in MWC 480. In this paper, we focus on the and lines for the full sample. For consistency, we present data reduction and imaged independently of the previous papers. For one of the sources, V4046 Sgr, we also use CO isotopologue data from the same survey.
The observations are described in detail by Huang et al. (2017). In short, the Band 6 observations were carried-out between 2014 and 2015 with baseline lengths spanning between 18 and 650 m. The total on-source time was 20 min, on average. A quasar was observed to calibrate amplitude and phase temporal variations. To calibrate the frequency bandpass a quasar was observed. The absolute flux scale was derived by observing Titan for about half the observations, or a quasar. The HCN isotopologue lines were covered by two spectral windows of 59 MHz bandwidth and 61 kHz channel width in the 1.1 mm spectral setting. The CO isotopologue lines were covered by three spectral windows in the 1.4 mm spectral setting, with the same bandwidth and channel width.
The data calibration was performed by the ALMA staff using standard procedures. We took advantage of the bright continuum emission of the sources to improve the signal-to-noise ratio, by further self-calibrating the HCN isotopologue data. The self-calibration solutions were derived on individual spectral windows when possible (AS 209, LkCa 15, MWC 480 and V4046 Sgr) and on averaged spectral windows for the weaker sources (IM Lup and HD 163296), and then applied to each spectral window. The continuum was then subtracted from the visibilities to produce the spectral line cubes. The clean images were obtained by deconvolving the visibilities in CASA, using the CLEAN algorithm with Briggs weighting. The HCN isotopologue data was regridded to a spectral resolution of for the full sample. The robust parameter was set to 1.0 for , except for IM Lup where we used a value of 2.0. For the robust parameter was set to 2.0 to improve the signal-to-noise ratio, except for V4046 Sgr and MWC 480 for which a value of 1.0 was used because of the bright line emission. To help the cleaning process we created elliptical masks, same for all channels, centered on the dust continuum centroid, using the disk inclination and position angle listed in Table 2. The mask radius was chosen to cover the stronger line emission in all channels, or to cover the dust continuum emission if the line was not
| Source | c | |||
| AS 209 | ||||
| IM Lup | - | - | ||
| LkCa 15 | ||||
| V4046 Sgr | ||||
| MWC 480 | ||||
| HD 163296 |
a The uncertainties do not include absolute flux calibration errors. b Computed assuming LTE and K. c Adopting and an associated uncertainty of 30%. d upper limits.
detected. The resulting beam, channel rms and moment zero rms values are listed in Table 1. For the CO isotopologues the robust parameter was set to 0.5, and a Keplerian mask was used to help the cleaning process, created by selecting emission consistent with the expected Keplerian rotation of the disk in each channel.
3. Sample statistics
| Line | Frequency | |||
|---|---|---|---|---|
| GHz | K | |||
| 259.0118 | 24.86 | 21 | ||
| 258.1571 | 24.78 | 7 |
The stellar and disk properties of the sample are summarized in Table 2. The sample includes 4 T Tauri stars and 2 Herbig Ae stars. The stellar masses range between 0.9 (AS 209) and 2.3 (HD 163296), corresponding to luminosities that span an order of magnitude. Two of the sources, namely LkCa 15 and V4046 Sgr, are transitional disks, with inner holes resolved at millimeter wavelengths. The sample is biased toward large disks, with a known rich molecular emission. However, given the very different physical properties, in particular the gas temperature, the source selection allows us to determine the disk averaged ratio in HCN in a diverse sample of disks.
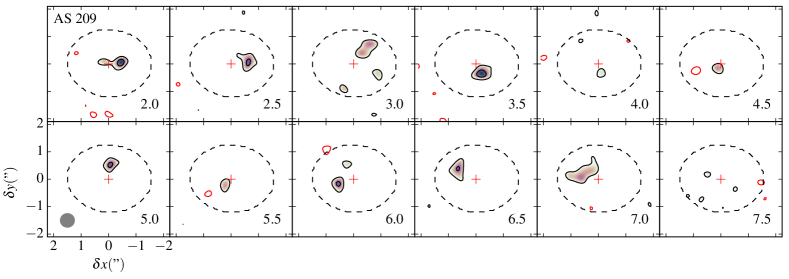
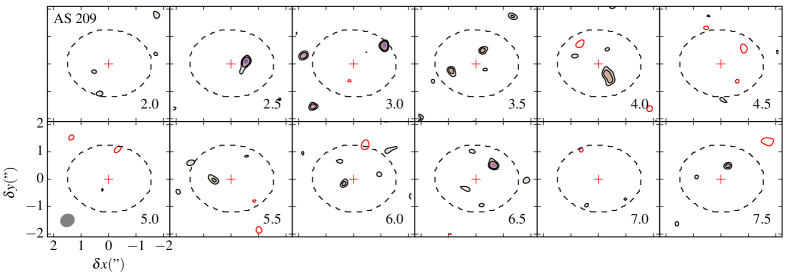
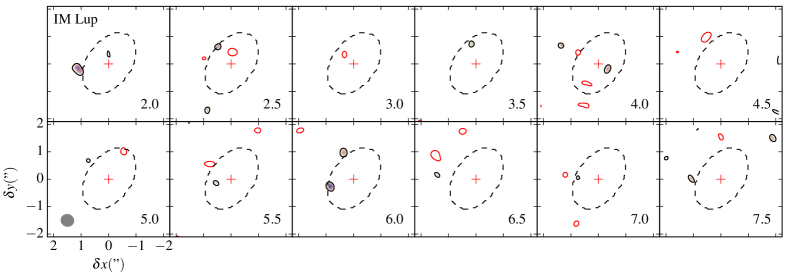
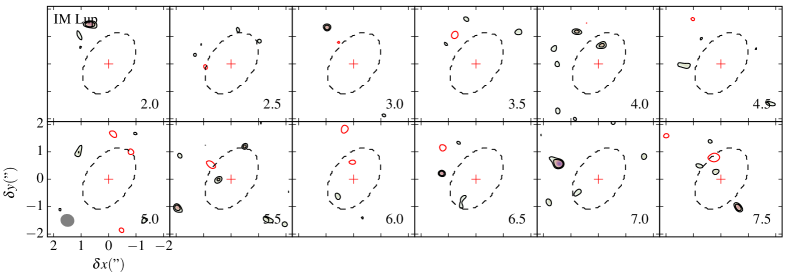
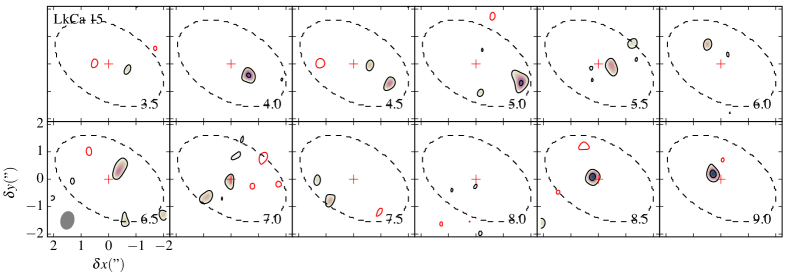
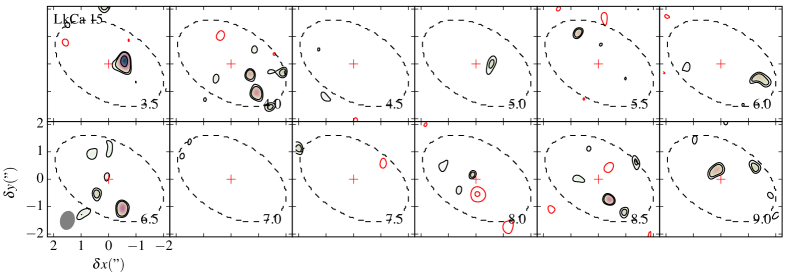
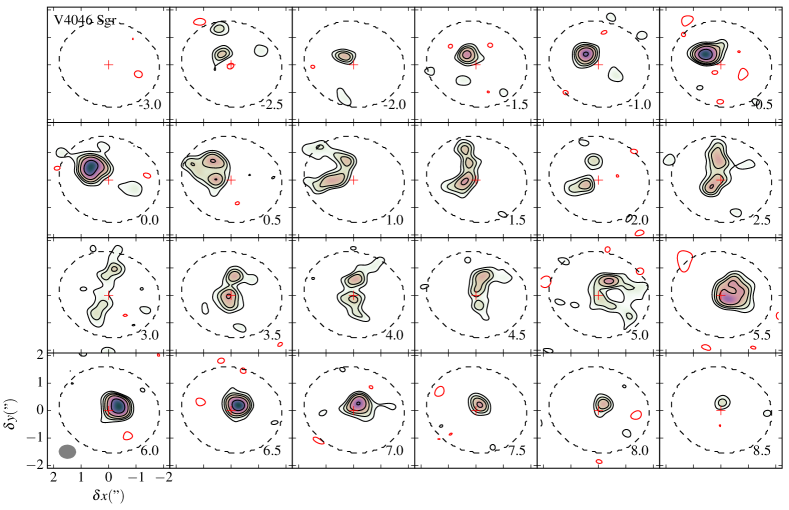
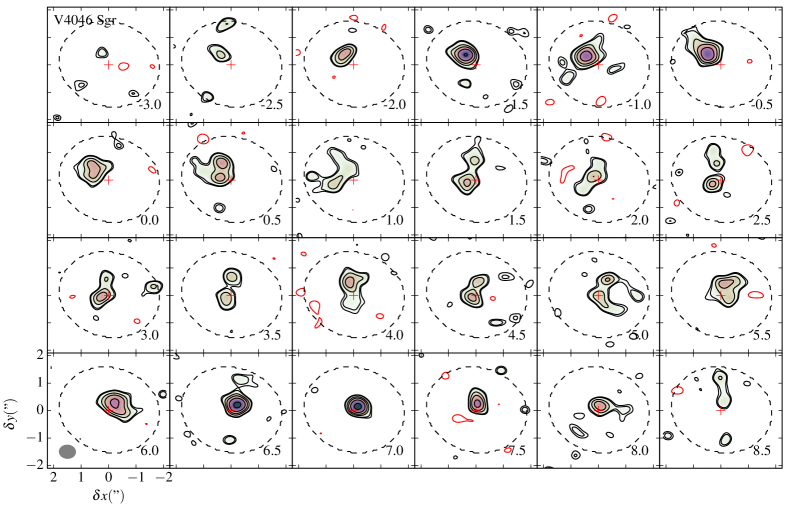
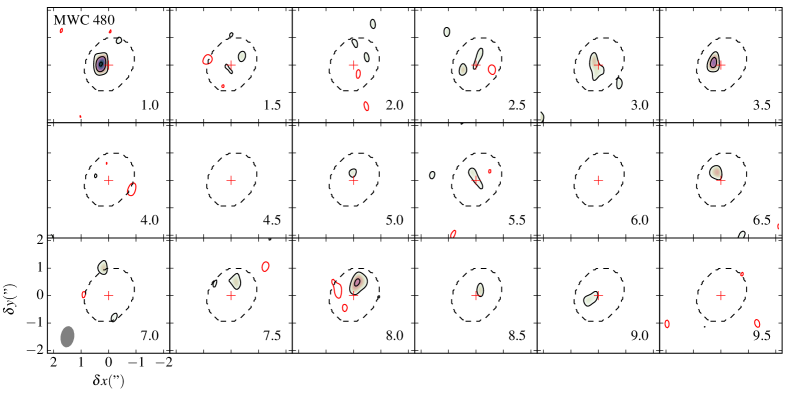
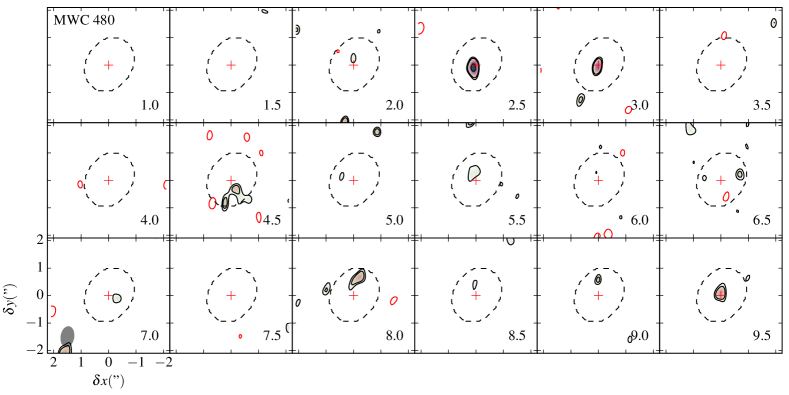
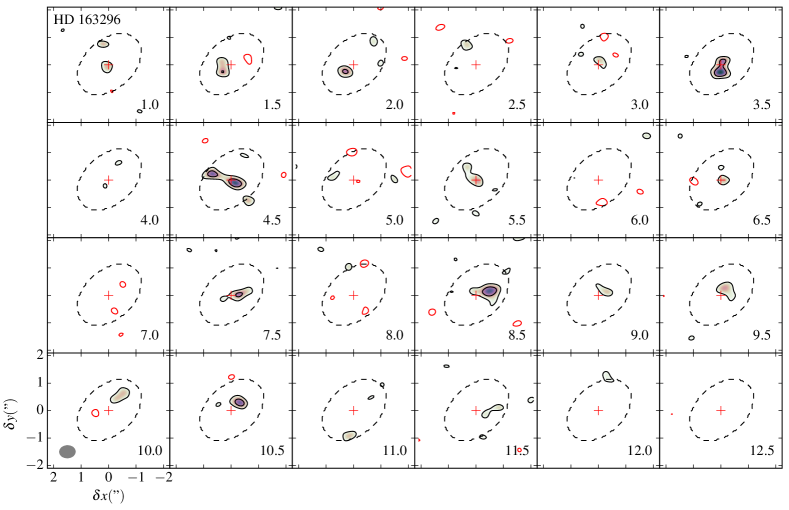
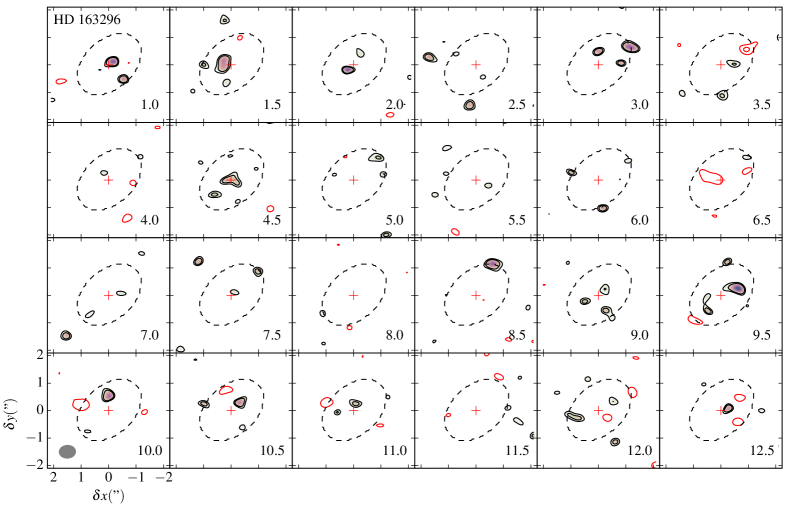
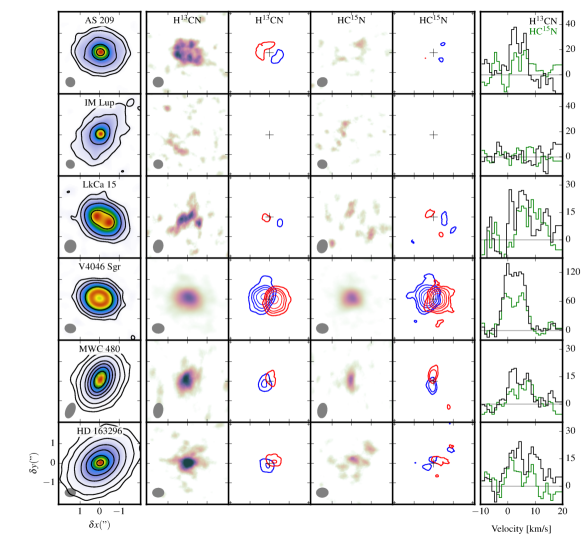
Figure 1 shows the observations for the full sample of disks. The dust continuum images are shown in the left column. The 1.1 mm continuum images were produced by averaging 1.1 mm line free spectral windows. The four middle panels display the and velocity integrated maps, for the full line (color images) and for two velocity ranges, the blue and red shifted parts of the line, to demonstrate the Keplerian rotation of the disk (blue and red contours). The right column of the figure shows the disk integrated line profiles of the and lines. The spectra were extracted using the same elliptical masks used to clean the data. Figs. A.1 to A.6 show channels maps of the and lines in each source, with the elliptical masks overlaid on top.
The lines are classified as detected if emission consistent with the expected Keplerian rotation of the disk is observed in at least three channels at a level. From the inspection of the channel maps we find that is clearly detected toward all disks except for the T Tauri disk IM Lup. is clearly detected toward V4046 Sgr, MWC 480 and HD 163296, weakly detected toward AS 209 and LkCa 15, and not detected toward IM Lup. We note that for the two disks with weak line emission, while emission is detected in 3 or more individual channels, the emission is almost washed out in the integrated intensity maps.
The emission is generally compact compared to the extent of the dust disk. It appears centrally peaked toward MWC 480 and V4046 Sgr, and possibly toward HD 163296, but presents clear rings toward the remaining two sources: LkCa 15 and AS 209. The latter is unexpected, since AS 209 is not a transition disk. The line shows a similar behavior, although the signal-to-noise ratio is lower.
We extracted the disk integrated fluxes from the unclipped moment zero maps using the same elliptical mask created to clean the data and extract the spectra. The uncertainty in the flux was estimated by simulating integrated flux measurements from signal free regions using the same elliptical mask but centered at random positions. The integrated disk fluxes and their associated uncertainties are listed in Table 3.
We use the extracted line flux ratios to estimate the abundance ratios of the two isotopologues. This is a reasonable first approximation when comparing HCN isotopologes, as the and line emission is expected to be optically thin, arise in the same region and this region is dense enough for the molecular rotational population to be in LTE (Pavlyuchenkov et al., 2007). We compute the abundance ratio in the LTE case and for K. For MWC 480, we obtain a lower ratio () than the value of reported in Guzmán et al. (2015), although both values are consistent within the errors. This is due to the different method implemented in this paper to extract the fluxes. The resulting abundance ratios span from 1.2 to 2.2 with an average of 1.8. Given the almost identical upper energies, Einstein coefficients and the ratio (partition function over upper state degeneracy) for the transition (see Table 4), the abundance ratios are almost identical to the flux ratios. We note that a higher excitation temperature of 100 K changes the inferred abundances by less than 1%.
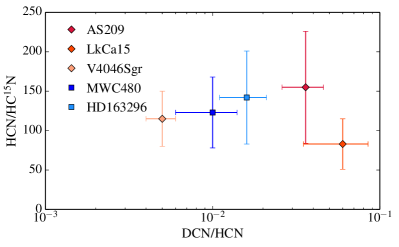
In order to derive the nitrogen fractionation in HCN, we adopt an isotopic ratio of . Because the C isotopic ratio depends on the physical conditions of the gas (e.g., Roueff et al., 2015) we include a 30% uncertainty in this value to convert the / ratio into a ratio. The inferred ratios span from 83 to 156 with an average of 124. All disks present low cometary-like ratios. The resulting / abundance ratios and the inferred flux ratios are listed in Table 3. Fig. 2 shows the nitrogen fractionation ratios for the full sample and compares it with DCN/HCN ratios derived by Huang et al. (2017). There is no indication of a correlation between the disk averaged nitrogen and hydrogen fractionation in these disks, as might have been expected if both originated from a cold fractionation pathway (see also section 5.3). We note that the spread in is small compared to the errors and we cannot rule out that there is a trend that is washed out by the noise.
4. The / profile in V4046 Sgr
HCN isotopologue emission observed toward V4046 Sgr is sufficiently bright to provide constraints on the and abundance profiles. In this section, we model the emission profile of the observed lines in order to retrieve the underlying abundance ratio across the disk.
4.1. Disk physical structure
In order to investigate possible variations of the abundance ratio across the disk a detailed model of the line emission is needed. We build a parametric model to describe the physical structure of the disk based on the model described in Rosenfeld et al. (2013), which was constructed to reproduce the emission of the dust continuum and the CO isotopologues. We first parametrize the dust surface density as
| (4) |
where is a normalization factor, is a characteristic radius, is the power-law index of the viscosity, and is the radius of the inner cavity. We include two dust populations, one for the atmosphere and another for the midplane grains. The dust volume density is computed assuming a vertical Gaussian distribution of each dust grain population:
| (5) |
The midplane grains, which are larger than the atmospheric ones, comprise the bulk of the dust mass (, ). The atmospheric dust grains are vertically Gaussian distributed with a scale height:
| (6) |
and the midplane dust grains are concentrated closer to the midplane, with a scale height that is half of that of the atmospheric grains.
| (7) |
With the dust density described above, the radiative transfer code RADMC-3D (Dullemond, 2012) was then used to compute the dust temperature throughout the disk. The dust absorption and scattering opacities, which are needed to solve the thermal balance, were computed using the OpacityTool111https://dianaproject.wp.st-andrews.ac.uk/data-results-downloads/fortran-package/ from the DIANA project (Woitke et al., 2016). The code assumes a mixture of amorphous laboratory silicates with amorphous carbon and 25% porosity for the grain composition. The grain size distribution follows a power-law of index . The minimum grain size was set to 5 nm, and the maximum size was set to 10 m and 1 cm, for the atmosphere and midplane grain populations, respectively.
| Scale height | 0.4 AU | |
| 1.25 | ||
| Dust surface density | 0.226 g cm-2 | |
| 1 | ||
| 75 AU | ||
| 3 AU | ||
| Gas temperature | 200 K | |
| 0.8 | ||
| 2 |
The gas temperature is parametrized as
| (8) |
following Dartois et al. (2003). Here, the atmospheric temperature is given by a power-law (), and the midplane temperature is fixed to the dust temperature (). The fiducial scale height at which the gas temperature is allowed to vary vertically, , is fixed to , where is the hydrostatic gas scale height evaluated at the midplane, .
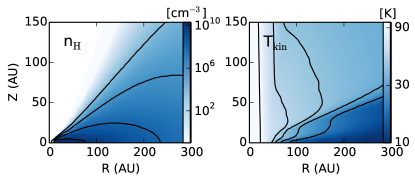
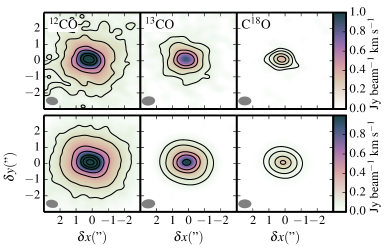
Once the gas temperature is obtained, the hydrostatic equation is solved to derive the gas density across the disk. For this we assume a vertically integrated gas-to-dust ratio at each radii of 100. The adopted parameters for the model are listed in Table 5. The resulting gas density and temperature structures are shown in Figure 3. This model reproduces the main features of the 12CO, 13CO and C18O emission (see Fig. 4) well enough for the purpose of this study, assuming standard isotopic ratios. In this model, the CO abundance is kept constant throughout the disk, except in the cold midplane ( K) where the abundance is reduced by a factor of due to freeze-out onto dust grains, and in the disk atmosphere where the CO abundance is reduced by a factor due to photodissociation.
4.2. Abundance fitting
The molecular abundances for and were defined as power-laws,
| (9) |
where is the abundance with respect to total hydrogen at AU and is a power-law index. We also include an outer cut-off radius . This parametrization is a common approach when modeling molecular abundances in disks (e.g. Qi et al., 2008, 2013).
In order to find the model that best reproduces the HCN isotopologue observations and the associated uncertainties, we use a Bayesian approach. In short, we first create a synthetic observation of the line emission for each species separately. Taking advantage of the bright HCN isotopologue emission in V4046 Sgr, we produced observed visibilities and cleaned cubes at a higher spectral resolution of for the line modeling and include include 60 channels. We use the vis_sample Python package222https://pypi.python.org/pypi/vis_sample to compute the Fourier Transform of the synthetic model and obtain visibilities that are correctly re-projected on the points of the observations. The likelihood function is then computed in the plane, by computing the weighted difference between model and observations, for the real and imaginary parts of the complex visibility. We sample the posterior distribution with the MCMC method implemented in the emcee package by Foreman-Mackey et al. (2013).
We include two free parameters in the line modeling, that is , , which are associated with the molecular abundances of and . The outer radius, , was fixed to 100 AU (chosen by the extension of the emission in the moment-zero map), but we checked that a larger radius of 200 AU gave the same result. The disk physical structure, that is the gas density and temperature, are fixed in the line fitting. We adopt the disk inclination, position angle, stellar mass (including both stars) and systemic velocity listed in Table 2. The level populations were computed using RADMC and assuming the gas is under LTE. We checked that non-LTE effects are not important for these lines using the non-LTE radiative transfer code LIME (Brinch & Hogerheijde, 2010) to re-calculate the level populations for the best-fit model. When generating a new sample, we included a flat prior for the power-law index , and for the molecular abundance .
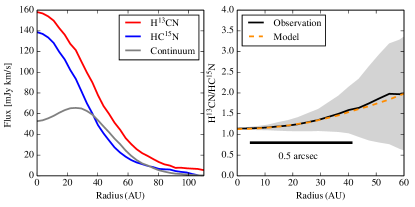
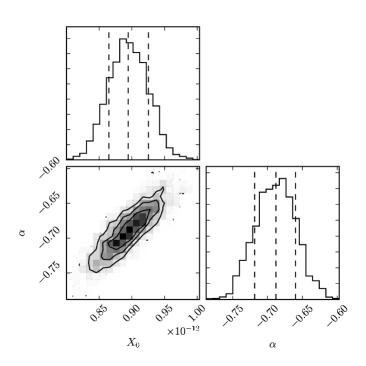
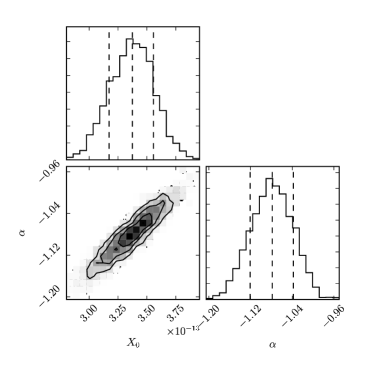
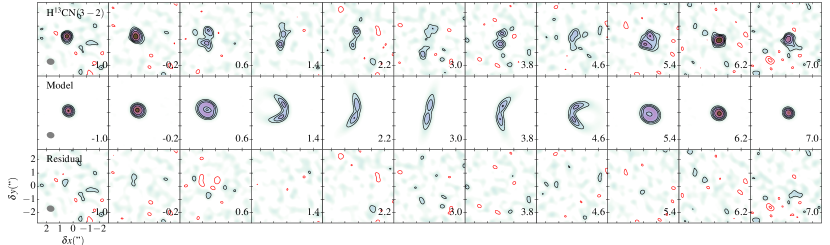
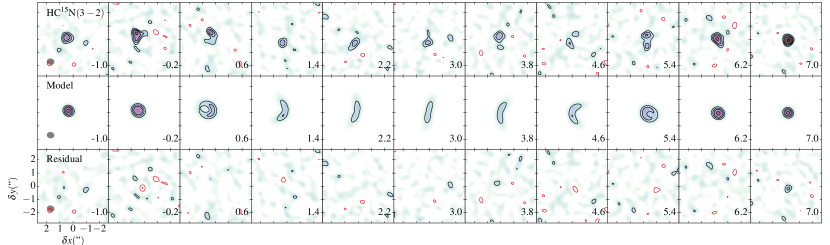
The best-fit model corresponds to and for , and and for . Our model suggests an increasing ratio as a function of radius, i.e. higher fractionation in the inner disk compared to the outer disk. Fig. 5 shows the deprojected radial profiles of the dust continuum and HCN isotopologue emission in V4046 Sgr (left panel) as well as the observed and modeled flux ratio (right panel). We note that beyond 60 AU, the ratio is highly uncertain because the signal-to-noise ratio becomes too low, in particular for . Figure 6 shows the posterior probability distribution for the fitted parameters. Fig. 7 shows the residuals between our best-fit model and the data for selected channels. Our simple model is able to well reproduce the observations.
The inferred abundance ratio at 10 and 50 AU are and , respectively. Assuming , we infer an abundance ratio of and , at 10 and 50 AU respectively. We note that the derived disk integrated HCN/ flux ratio of falls in between the inferred abundance ratios at 10 and 50 AU. Given the consistent nitrogen fractionation levels inferred from the observations and line modeling in V4046 Sgr, we expect the observed ratio in the other sources to be representative of their abundance ratio in the comet forming region.
5. Discussion
5.1. Disk-averaged nitrogen fractionation in protoplanetary disks
We have shown that HCN isotopologues are abundant in disks. Both and are detected toward 5/6 disks in our sample – the one exception being the disk around T Tauri star IM Lup. The disk around IM Lup is very massive (), very cold and also very young (e.g., Cleeves et al., 2016) compared to the rest of the disks in the sample. The non-detection of was surprising considering that IM Lup is quite bright in the main HCN isotopologue (Öberg et al., 2011). Given the observed HCN flux density of 3.5 Jy , we could expect a flux density of 50 mJy if HCN is optically thin and . This is consistent with the observed upper limit of mJy .
The inferred disk-averaged nitrogen fractionation ratios range from to . Despite the different physical conditions of the disks in the sample, the observed ratios are consistent with sampling a constant disk-averaged fractionation level. In particular, we find no difference in the nitrogen fractionation level between disks around T Tauri and Herbig Ae stars, which have an order of magnitude difference in the stellar radiation field. No difference in the disk-averaged is observed between full and transitional disks, either. The age of the star does not seem to play an important role either – we target young (1 Myr) and old ( Myr) sources – suggesting either that the is inherited from the parent cloud and is not modified in the disk, or the disk chemistry sets the global, disk averaged nitrogen fractionation level early ( Myr) in the protoplanetary disk life.
Although we do not observe differences in the nitrogen fractionation ratio between the sources, the data suggest that there may be a difference in the nitrogen abundance between the disks around stars V4046 Sgr, MWC 480 and HD 163206, and the disks around T Tauri stars AS 209 and LkCa 15. The old disk around the binary T Tauri stars V4046 Sgr and the two Herbig Ae stars in the sample are enriched in HCN compared to the young T Tauri stars. Disk models have shown that dust migration and carbon and oxygen depletion (mainly due to CO and H2O freeze-out) can increase the column density of cyanides by up to two orders of magnitude in the outer disk (Du et al., 2015). Future observations toward a larger sample of disks will show if this corresponds to an evolutionary trend.
5.2. Comparison between nitrogen fractionation in disks, Solar System and ISM
Fig. 8 shows the observed ratios in different Solar System bodies, the cold ISM and in the diffuse medium. There are large variations in the ratio among different Solar system bodies, in particular between the rocky and gaseous bodies. The Sun has the highest value in this comparison (), measured by the Genesis mission that sampled solar wind ions, N+ among them (Marty et al., 2011). An almost identical value was found in the atmosphere of Jupiter through the NH3 observations carried-out by the Cassini spacecraft (Fouchet et al., 2004). Both measurements are expected to trace the lack of nitrogen fractionation in N2, the main nitrogen reservoir of the protosolar nebula. The 15N-depleted Solar value is thus considered to be representative of the conditions of the gas when the Sun formed. All the other Solar system bodies are enriched in 15N compared to the Sun. A value of is found in the Earth’s atmosphere, measured in N2. The has also been measured in several comets. An isotopic ratio of was found in C/1995 O1 (Hale-Bopp) and 17P/Holmes, value which was consistent for both HCN and CN (Bockelée-Morvan et al., 2008). Observations of 18 comets from both the Oort cloud and the Kuiper Belt all show consistently low HCN ratios (Mumma & Charnley, 2011).
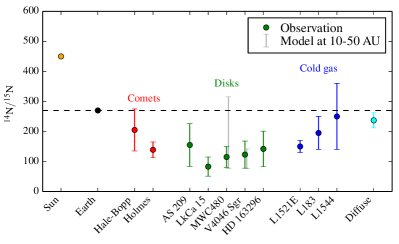
The cold interstellar medium is also enriched in 15N. Hily-Blant et al. (2013) measured the toward two prestellar cores, L183 and L1544, and found values of and , respectively. The in CN was later measured toward L1544 resulting in a surprisingly high CN/C15N ratio of (Hily-Blant et al., 2013b). The authors were able to reproduce the observed difference in CN and HCN with chemical models of cold gas. The fact that CN and HCN present similar fractionation levels in comets, could be explained if CN is produced in the coma from photo-dissociation of HCN (Hily-Blant et al., 2013b). Ikeda et al. (2002) also found a low HCN ratio of toward the prestellar core L1521E.
Finally, the averaged 15N enrichment observed for HCN in protoplanetary disks are similar to comets and the cold ISM. While the similar nitrogen fractionation ratios found in the cold ISM, comets and disks is consistent with an inheritance scenario for the origin of organics in the Solar System, as we discuss in the next section, the increasing ratio in the disk of V4046 Sgr suggests that in situ disk chemistry also contributes to the observed fractionation patterns.
5.3. Resolved nitrogen fractionation chemistry in disks
The bright emission of the HCN isotopologues in V4046 Sgr allows us to trace the profile across a disk for the first time. In general, there are three possibilities for what could be observed: a flat, decreasing or increasing as a function of disk radius. If and are inherited from the prestellar gas and no further chemical processing occurs in the disk, then a constant ratio is expected across the disk. On the other hand, if the nitrogen chemistry is altered by in-situ chemical fractionation in the disk then a varying is expected. In this case, if chemical fractionation dominates the nitrogen fractionation then a low is expected to occur in the outer disk, where the gas temperature is low (i.e., a decreasing with radius). In contrast, if selective photodissociation is the dominant pathway to fractionate HCN, then an increasing profile would be observed because this pathway is most important in regions exposed to UV photons, i.e. the inner disk which is illuminated by the central star.
The observations toward V4046 Sgr show that both and are best reproduced by a decreasing abundance profile. However, the inferred emission profile is slightly steeper than that of , pointing to a higher fractionation in the inner disk than in the outer disk. The varying observed in V4046 Sgr shows that there is an active nitrogen fractionation in the disk, that changes the original fractionation pattern. The fact that is lower in the inner disk suggests that selective photodissociation is indeed an important pathway to fractionate HCN in the inner disk. Higher signal-to-noise ratio observations are needed to determine if there is also an active N fractionation chemistry in the outer disk.
There is additional evidence that cold ion-molecule fractionation does not alone regulate the ratio in disks. Huang et al. (2017) measured the D/H isotopic ratio in DCO+ and HCN toward the same sample of disks. They found enhanced D/H ratios compared to the elemental ratio in the local ISM () in all disks, with DCN/HCN ratios ranging from 0.005-0.08. If the cold pathway dominates the fractionation for both species in these disks we could expect a correlation between the D/H and ratios. However, we do not see such correlation in the sample (see Fig. 2).
5.4. Future directions
We have shown that the ratio increases with radius in the disk around T Tauri stars V4046 Sgr. However, the angular resolution of the current data ( corresponding to AU at 73 pc) prevents us from resolving variations at smaller scales and the low signal-to-noise ratio prevents us from constraining the chemistry beyond 60 AU. Future observations at higher angular resolution should allow us to measure the radial dependence of at Solar System scales, and determine how the fractionation ratio changes from the inner ( AU) to the outer ( AU) disk.
High-angular resolution observations toward more disks are needed to determine whether an increasing is a general characteristic of disks or unique to V4046 Sgr. A larger sample is also needed to draw more general conclusions on the dominant fractionation pathways in disks, and how the pattern depends on the physical conditions of the disk. In this respect, new chemical models that include all nitrogen fractionation pathways (selective photodissociation and cold isotope exchange reactions) as well as inheritance from the parent cloud are key to interpret the observations. In addition, it is desirable to include the fractionation of both carbon and nitrogen in the models, since most measurements in both disks and cold ISM rely on observations of the 13C isotopologues to measure the contribution of the main isotopologues.
In contrast to HCN, hydrides (e.g., N2H+ and NH3) are found to be 15N-depleted in the ISM. Toward L1544, Bizzocchi et al. (2013) found a nitrogen isotopic ratio in N2H+ of 1000. Toward the class 0 protostar B1b, Daniel et al. (2013) found ratios of for NH3 and an upper limit of for N2H+. Hily-Blant et al. (2013) proposed that the difference in nitrogen fractionation between cyanides and hydrides in the cold ISM is the result of their different chemical origins: HCN derives from atomic N, while NH3 and N2H+ derive from molecular nitrogen. This hypothesis, however, is challenged by the recent measurement of the in NH2, a photodissociation product of NH3 in cometary coma, toward comet C/2012 S1 (ISON), where a fractionation ratio of was found (Shinnaka et al., 2014). A similarly low value () was found previously by Rousselot et al. (2014) based on the averaged spectrum of 12 comets. Toward comet ISON, CN and HCN were also found to be highly enriched in 15N (). As explained by Shinnaka et al. (2014), one possibility to obtain similar HCN and NH3 fractionation levels in comets, despite very different fractionation levels in the cold ISM, is through grain surface chemistry. Indeed, the ISM values represent the in the gas-phase, while cometary values represent the in the ices. It is also possible that the measured cometary values is not representative of the composition of the nucleus. Measurements of the isotopic ratio in NH3 and N2H+ in disks would provide additional clues to answer these questions. In particular, if the cyanide/hydride dichotomy observed in the cold ISM holds for disks as well.
Finally, more observations toward comets targeting different molecular parent species (i.e., species tracing the cometary nucleus and not daughter species which are produced in the coma) will be important to compare with observations in the ISM and disks, and to elucidate the origins of 15N enhancements, and ultimately the origins of organics, across the Solar System.
6. Conclusions
We have presented ALMA observations at angular resolution of the HCN isotopologues in a diverse sample of six protoplanetary disks. The sample contains 4 T Tauri and 2 Herbig Ae stars, which sample an order of magnitude in radiation fields. Both and are detected toward all the sources, except for IM Lup, which is the most massive and coldest disk, and likely the youngest, in the sample. Adopting a standard ratio of 70 (with a 30% uncertainty), we infer disk-averaged ratios of for the sources. Despite the different physical conditions of the disks, in HCN is similar for all sources. No differences are observed between T Tauri and Herbig Ae stars, or between the full disks and the transitional disks, which feature large dust cavities. Also, no correlation is observed between disk-averaged D/H and ratios in the sample. The observed disk-averaged ratios are similar to what is observed in comets and in the cold ISM, which is consistent with the inheritance scenario for the origin of organics in the Solar System. However, chemical processing within the protoplanetary disk phase based on these ratios alone cannot be ruled out. Indeed, in the one disk where we could resolve the ratio as a function of radius we find a slightly steeper profile for , i.e. an increasing ratio with radius. The higher nitrogen fractionation level in the inner disk compared to the outer disk suggest that selective photodissociation is an important fractionation pathway in the inner disk.
References
- Du et al. (2015) Du, F., Bergin, E. A., & Hogerheijde, M. R. 2015, ApJ, 807, L32
-
Bizzocchi et al. (2013)
Bizzocchi, L., Caselli, P., Leonardo, E., & Dore, L. 2013, A&A, 555, A109
-
Bockelée-Morvan et al. (2008)
Bockelée-Morvan, D., Biver, N., Jehin, E., et al. 2008, ApJ, 679,
L49
-
Brinch & Hogerheijde (2010)
Brinch, C.,
& Hogerheijde, M. R. 2010, A&A, 523, A25
-
Chapillon et al. (2012)
Chapillon, E., Guilloteau, S., Dutrey, A., Piétu, V., & Guélin, M. 2012, A&A, 537, A60
- Cleeves et al. (2016) Cleeves, L. I., Öberg, K. I., Wilner, D. J., et al. 2016, arXiv:1610.00715
-
Daniel et al. (2013)
Daniel, F., Gérin, M., Roueff, E., et al. 2013, A&A, 560, A3
-
Dartois et al. (2003)
Dartois, E., Dutrey, A.,
& Guilloteau, S. 2003, A&A, 399, 773
-
Dullemond (2012)
Dullemond, C. P. 2012, Astrophysics Source Code Library, ascl:1202.015
- Foreman-Mackey et al. (2013) Foreman-Mackey, D., Hogg, D. W., Lang, D., & Goodman, J. 2013, PASP, 125, 306
-
Fouchet et al. (2004)
Fouchet, T., Irwin, P. G. J., Parrish, P., et al. 2004, Icarus, 172, 50
-
Guzmán et al. (2015)
Guzmán, V. V., Öberg, K. I., Loomis, R., & Qi, C. 2015, ApJ, 814, 53
-
Heays et al. (2014)
Heays, A. N., Visser, R.,
Gredel, R., et al. 2014, A&A, 562, A61
-
Hily-Blant et al. (2013)
Hily-Blant, P.,
Bonal, L., Faure, A., & Quirico, E. 2013, Icarus, 223, 582
-
Hily-Blant et al. (2013b)
Hily-Blant, P., Pineau des Forêts, G., Faure, A., Le Gal, R., & Padovani, M. 2013, A&A, 557, A65
-
Huang et al. (2017)
Huang, J., Oberg, K. I., Qi, C., et al. 2017, arXiv:1701.01735
-
Ikeda et al. (2002)
Ikeda, M., Hirota, T., & Yamamoto, S. 2002, ApJ, 575, 250
- Lyons et al. (2009) Lyons, J. R., Bergin, E. A., Ciesla, F. J., et al. 2009, Geochim. Cosmochim. Acta, 73, 4998
-
Lucas & Liszt (1998)
Lucas, R., & Liszt,
H. 1998, A&A, 337, 246
-
Liszt & Lucas (2001)
Liszt, H., & Lucas, R. 2001, A&A, 370, 576
-
Marty et al. (2011)
Marty, B., Chaussidon, M.,
Wiens, R. C., Jurewicz, A. J. G., & Burnett, D. S. 2011, Science,
332, 1533
-
Mumma & Charnley (2011)
Mumma, M. J., & Charnley, S. B. 2011, ARA&A, 49, 471
- Öberg et al. (2015) Öberg, K. I., Furuya, K., Loomis, R., et al. 2015, ApJ, 810, 112
- Öberg et al. (2015) Öberg, K. I., Guzmán, V. V., Furuya, K., et al. 2015, Nature, 520, 198
-
Öberg et al. (2010)
Öberg, K. I., Qi,
C., Fogel, J. K. J., et al. 2010, ApJ, 720, 480
-
Öberg et al. (2011)
Öberg, K. I., Qi,
C., Fogel, J. K. J., et al. 2011, ApJ, 734, 98
-
Pavlyuchenkov et al. (2007)
Pavlyuchenkov, Y., Semenov, D., Henning, T., et al. 2007, ApJ, 669, 1262
& Guilloteau, S. 2007, A&A, 467, 163
- Rosenfeld et al. (2013) Rosenfeld, K. A., Andrews, S. M., Wilner, D. J., Kastner, J. H., & McClure, M. K. 2013, ApJ, 775, 136
-
Roueff et al. (2015)
Roueff, E., Loison, J. C., & Hickson, K. M. 2015, A&A, 576, A99
- Rousselot et al. (2014) Rousselot, P., Pirali, O., Jehin, E., et al. 2014, ApJ, 780, L17
- Shinnaka et al. (2014) Shinnaka, Y., Kawakita, H., Kobayashi, H., Nagashima, M., & Boice, D. C. 2014, ApJ, 782, L16
-
Thi et al. (2004)
Thi, W.-F., van Zadelhoff, G.-J., & van Dishoeck, E. F. 2004, A&A, 425, 955
-
Qi et al. (2013)
Qi, C., Öberg, K. I., & Wilner, D. J. 2013, ApJ, 765, 34
-
Qi et al. (2008)
Qi, C., Wilner, D. J., Aikawa, Y., Blake, G. A., & Hogerheijde, M. R. 2008, ApJ, 681, 1396-1407
- Wampfler et al. (2014) Wampfler, S. F., Jørgensen, J. K., Bizzarro, M., & Bisschop, S. E. 2014, A&A, 572, A24
- Woitke et al. (2016) Woitke, P., Min, M., Pinte, C., et al. 2016, A&A, 586, A103
Appendix A Channel maps