Formation and assembly history of stellar components in galaxies as a function of stellar and halo mass
Abstract
Galaxy mass assembly is an end product of structure formation in the CDM cosmology. As an extension of Lee & Yi (2013), we investigate the assembly history of stellar components in galaxies as a function of halo environments and stellar mass using semi-analytic approaches. In our fiducial model, halo mass intrinsically determines the formation and assembly of the stellar mass. Overall, the ex situ fraction slowly increases in central galaxies with increasing halo mass but sharply increases for . A similar trend is also found in satellite galaxies, which implies that mergers are essential to build stellar masses above . We also examine the time evolution of the contribution of mass growth channels. Mergers become the primary channel in the mass growth of central galaxies when their host halo mass begins to exceed . However, satellite galaxies seldom reach the merger-dominant phase despite their reduced star formation activities due to environmental effects.
Subject headings:
galaxies: evolution – galaxies: elliptical and lenticular, cD – galaxies: formation – galaxies: stellar content1. Introduction
Modern theories for galaxy formation and evolution suggest that galaxies are formed in highly over-dense regions, namely haloes, while cosmological structures are built up via smooth matter accretion or the coalescence of haloes. Thus, some galaxies are eventually involved in hierarchical mergers in the process of structure formation. Galaxy mergers play a pivotal role in the evolution of galaxies by disturbing the kinematics of the stellar and gaseous components, which induces morphology transformation, size growth, star formation, and active galactic nuclei (AGNs) activities (e.g. Kauffmann & Haehnelt, 2000; Springel et al., 2005; Daddi et al., 2005; Trujillo et al., 2006; Croton et al., 2006; Schawinski et al., 2006; Cox et al., 2008; Naab et al., 2009; Hopkins et al., 2010; van Dokkum et al., 2010; Oser et al., 2012; Ji et al., 2014; Kaviraj, 2014a, b; Kaviraj et al., 2014). Therefore, galaxies, especially massive ones, are the end products of structure formation in the CDM cosmology.
Many puzzles in the evolution of galaxies are still waiting to be addressed, and there is no clear consensus even on seemingly simple issues of the assembly history of stellar masses in galaxies in a quantitative aspect. Much effort has been made to systematically investigate these issues in a cosmological context. Semi-analytic models (SAMs) for galaxy formation and evolution have been used to explore the formation and assembly history of stellar components of galaxies in cosmological volumes by taking advantage of their computing efficiency. Empirical downsizing effects (e.g. Cowie et al., 1996; Glazebrook et al., 2004; Cimatti et al., 2004) are reasonably reproduced in SAMs based on the CDM cosmology in which galaxies are born earlier on shorter timescales in denser environments and larger ones are built up through gradual mergers. (e.g. De Lucia et al., 2006; De Lucia & Blaizot, 2007; Guo & White, 2008; Jiménez et al., 2011; Lee & Yi, 2013). De Lucia & Blaizot (2007) demonstrated that brightest cluster galaxies (BCGs) can have very high fractions of ex situ components () in terms of total stellar mass. Jiménez et al. (2011) examined the assembly history of model galaxies in two clusters, and found that BCGs acquire of their final mass via mergers, and the fractions monotonically decrease with increasing absolute magnitudes of galaxies. Lee & Yi (2013, hereafter LY13) provide a quantitative prediction of the ex situ fractions of a complete set of galaxies in a cosmological volume as a function of the final stellar mass: 20%, 40%, and 70% for 10.75, 11.25, and 11.75 galaxies at , respectively. According to them, in the main progenitors of local massive galaxies ( at ) galaxy mergers become the leading channel in mass growth at . For comparison, there is no such transition in smaller galaxies ( at ).
Rapid advances in computing power have enabled us to carry out hydrodynamic simulations with reliable resolution for numerous haloes in cosmological volumes. Oser et al. (2010) investigated the stellar assembly history of massive galaxies by using zoom-in simulations of 39 haloes. They showed that only of the stars in massive galaxies ( at ) are formed in situ, and the rest fall into the galaxies via mergers. The galaxies in the zoomed simulations performed by Lackner et al. (2012) have ex situ fractions of those in Oser et al. (2010) in similarly massive galaxies. The simulations in the two studies were run without AGN feedback. The effect of AGN feedback on stellar mass growth was investigated using zoomed simulations by Dubois et al. (2013). AGN feedback effectively suppresses the in situ star formation in massive galaxies, resulting in a 30% higher ex situ fraction than in non-AGN cases. In their zoomed simulations, Hirschmann et al. (2015) showed that galactic winds play a role similar to the AGN feedback in mass growth.
Hydrodynamic simulations for entire cosmological volumes with moderate resolution have become available recently (e.g. Vogelsberger et al., 2014; Schaye et al., 2015). Rodriguez-Gomez et al. (2016) examined the contribution of mergers to the galaxy mass assembly history by using a complete set of galaxies identified in a cosmological volume of the Illustris simulation (Vogelsberger et al., 2014; Genel et al., 2014). The ex situ fractions of the galaxies in the volume are in good agreement with LY13, i.e., for and for at . They also found that the ex situ components are less concentrated than in situ components and half of them flow into galaxies via major mergers in the overall mass range ( at ).
The aforementioned studies looked into the histories of galaxy assembly primarily as functions of stellar mass. However, the properties of galaxies are governed by halo evolution in the CDM cosmology, as implied by the strong correlation between the stellar and halo masses (e.g Moster et al., 2010; Behroozi et al., 2010, 2013). Furthermore, recent deep imaging observations revealed that a considerable fraction () of bright () early-type galaxies have post-merger signatures in both isolated and dense environments (van Dokkum, 2005; Sheen et al., 2012). Post-merger signatures in satellite galaxies were expected to be rare due to the high peculiar velocities in dense environments. Yi et al. (2013) argued that the post merger features of non-central galaxies in dense environments may have been pre-processed before becoming satellites. These studies point out that the galaxy assembly history should be traced along with the evolution of environments.
The number of neighboring galaxies is widely used to quantify the environments around galaxies in empirical studies, and this is closely connected to the host halo mass (see Muldrew et al., 2012, and references therein). Thus, host halo mass can be used as a reasonable proxy of the environments of galaxies. Large cosmological volume simulations are needed to cover a variety of environments. LY13 investigated the origin of stellar components only as a function of stellar mass without separating them into centrals and satellites. The size of the cosmological volume LY13 used was Mpc on a side with collisionless particles, and less than 30 cluster-scale haloes () being found in the volume. Up-to-date hydrodynamic cosmological simulations cover a scale of volumes similar to LY13 , which are not large enough to harvest many cluster-scale haloes. Therefore, semi-analytic approaches are still effective for investigating galaxy evolution in larger cosmological volumes. As a follow-up of LY13, this study aims to separately scrutinize the mass assembly history of central and satellite galaxies as a function of halo and stellar mass using our own SAM.
2. Model
We use ySAM(LY13) in this investigation and provide a summary of it in this section.
2.1. Halo catalogue
To obtain a sufficient number of haloes in , we performed a cosmological volume simulation with collisionless particles in a 284Mpc (Mpc) periodic cube using the cosmological simulation code Gadget-2 (Springel, 2005). The initial condition of the simulation was generated using MPgrafic (Prunet & Pichon, 2013), a parallel version of Grafic-1 (Bertschinger, 1995). We adopted a set of cosmological parameters derived from the seven-year Wilkinson Microwave Anisotropy Probe observations by Komatsu et al. (2011), , , and . A total of 125 snapshots were printed out from the volume run, and Subfind (Springel et al., 2001) was used to search for sub-structures in the friends-of-friends groups of the snapshots. The final halo catalogue consists of 118 time steps from to .
| Parameter | Description | Fiducial value | Tuning range |
|---|---|---|---|
| Fraction of stellar mass in satellites scattered by mergers | 0.4 | 0.2-0.5 | |
| Star formation efficiency of cold gas disks | 0.075 | 0.02-0.10 | |
| Efficiency of SN feedback | 1.5 | 0.5-2 | |
| SN feedback power-law slope | 2.9 | 2-3 | |
| Characteristic velocity of SN feedback (km s-1) | 250 | 150-250 | |
| Cold gas accretion efficiency onto SMBHs induced by mergers | 0.035 | 0.01-0.04 | |
| Efficiency of radio mode AGN feedback | |||
| Radio mode AGN feedback power-law slope | 2.3 | 2-3 | |
| Characteristic velocity of radio mode AGN feedback (km s-1) | 150 | 150-250 |
-
•
Note: 1 Murante et al. (2004). 2 Eq. 16 in Croton et al. (2006). Since this prescription allows cold gas disks to form stars when their surface densities exceed critical values, this efficiency is higher than that (0.02) of the original prescription of ySAM (Eq. 5 in LY13) in which star formation rates are in proportion to the total amount of cold gas. 3 Eq. 12 in Somerville et al. (2008). The characteristic velocity fixed at 200 km s-1 in the equation was adjusted in this study. 4 Eq. 2 in Kauffmann & Haehnelt (2000). 5 Eq. 10 in Croton et al. (2006). The characteristic velocity and the power fixed at 200 km s-1 and 3 in the equation were adjusted in this study.
2.2. Halo merger trees
Halo merger trees are the essential backbones of SAMs, and are composed of single or multiple branches. In this study, the branch linking the most massive progenitor among all the progenitors of a halo at each time step is defined as the main branch of a halo merger tree (see De Lucia & Blaizot, 2007). These trees are constructed from the halo catalogue using the tree building code ySAMtm (Jung et al., 2014), which traces the most likely descendant or progenitor of a halo by comparing the identifications of particles bound to the haloes in two snapshots. ySAMtm has been updated to provide the number fraction of bound particles exchanged between haloes. We assume that the same fraction of hot gas and diffuse stellar components are transferred along with the collisionless particle exchanges between haloes.
2.3. Semi-analytic model
ySAM allows a halo to form a galaxy in its central region (White & Rees, 1978). In principle, a halo has one galaxy regardless of whether it is a host or sub. Satellite galaxies are treated as the centrals of subhaloes. ySAM performs tree cleaning and repairing processes before planting galaxies onto raw halo merger trees that possibly have problematic branches (Muldrew et al., 2011; Elahi et al., 2013; Onions et al., 2013; Srisawat et al., 2013). Halo finding codes sometimes fail to identify haloes embedded in dense environments or close to the mass resolution limit, which eventually results in fragmented trees. ySAM removes any host halo branches that disappear without descendants before and subhalo branches that are identified to be newly formed with no progenitor. ySAM analytically calculates the orbits and mass of the subhaloes that merge into host haloes in the raw merger trees before reaching the central regions of their hosts (see Lee & Yi, 2013; Lee et al., 2014). We adopt the prescriptions for gas cooling proposed by White & Frenk (1991). The prescription for quiescent star formation was updated from the original prescription in ySAM. Star formation in a disk is permitted when the surface density of a cold gas disk is larger than a critical density (Croton et al., 2006). We use the prescriptions for supernova feedback and merger-induced starbursts proposed by Somerville et al. (2008). Quasar and radio mode feedback is implemented into ySAM as proposed by Kauffmann & Haehnelt (2000) and Croton et al. (2006). We also trace the mass loss and chemical enrichment history of individual stellar populations in galaxies. Further details can be found in LY13.
2.4. Model calibrations
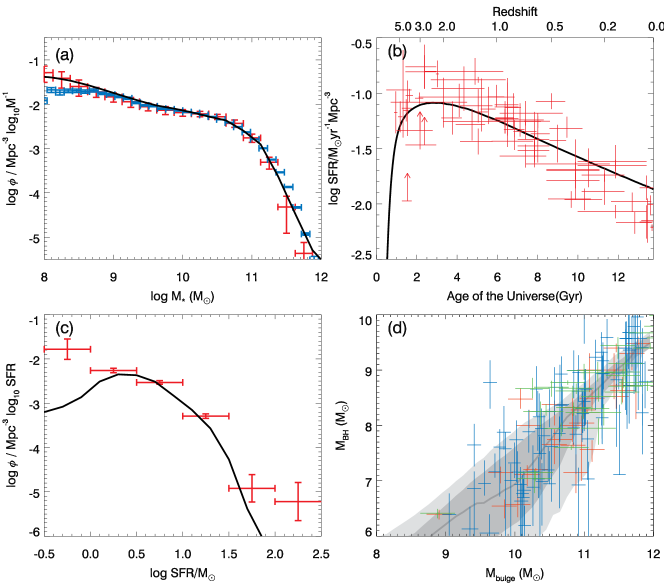
ySAM was calibrated for the cosmological volume described in §2.1 by tuning the set of free parameters listed in Table 1. More parameters are used in the prescriptions of ySAM (see LY13, and references therein). Most of them are, however, fixed and we have mainly adjusted the listed free parameters that regulate feedback and star formation efficiency. Figure 1 shows the fitting of our fiducial model. The galaxy stellar mass function (GSMF) is adopted as the primary calibration point for ySAM. The panel (a) in Figure 1 displays two empirical GSMFs along with our fiducial model at . The GSMF marked by blue symbols comes from Panter et al. (2007), and the red symbols are a composite GSMF of Baldry et al. (2008), Li & White (2009), and Baldry et al. (2012). The two empirical GSMFs are in good agreement overall, even though that of Panter et al. (2007) has a slightly higher massive end (). Our fiducial model is located in between these two GSMFs. The panel (b) in Figure 1 shows the evolution of the global star formation density (GSFD) over the cosmic time. The empirical GSFD that was compiled and modified by Panter et al. (2007) is marked by red crosses. In panel (c), one can see the star formation rate functions (SFRFs) of the empirical data (Gruppioni et al., 2015) and our fiducial model at for . The GSFD and SFRF are not calibration points in our model, but are used to cross-check whether our model reproduces reliable star formation histories.
A tight correlation between the mass of supermassive black holes (SMBHs) and bulge stellar mass has been discovered (Magorrian et al., 1998; Marconi & Hunt, 2003; Häring & Rix, 2004; Hu, 2009; Sani et al., 2011). This relation was used as the secondary calibration point in our model. Three different observations with error bars and of the fiducial model are shown in panel (d) of Figure 1. The red, blue, and green crosses indicate the empirical relation derived by Häring & Rix (2004), Kormendy & Bender (2013), and McConnell & Ma (2013), respectively. The distribution of our model is within the observational scatter. A notable feature is that the distribution of the model at is much narrower than that in the low mass range. This is because the main channel that builds up bulges at the massive end is galaxy mergers, which also feed the SMBHs by injecting gas into very central regions or by inducing SMBH mergers in our model. Dry mergers strengthen the relationship in the later stages of the evolution of massive galaxies. On the other hand, disk instability becomes significant in the growth of (pseudo) bulges for less massive galaxies along with mergers. This results in a less tight relation at , as suggested by the empirical studies (see Kormendy & Ho, 2013). This model is used as a fiducial model in this study.
3. Results
All of the galaxies in ySAM are born as the central galaxy of each halo. Thus, the final galaxy of a halo merger tree composed of N branches evolves with a maximum of N-1 galaxy mergers. The galaxies that grow along the main branches of the halo merger trees are called the main or direct progenitors of the final galaxies. The stars formed in the main progenitors are classified as in situ components, and those that are formed outside and then come into the main branches are labelled as ex situ components. In this definition, the stellar mass of the galaxy is the sum of the mass of the two components, i.e., , following a conventional nomenclature (e.g. Oser et al., 2010; Lee & Yi, 2013; Rodriguez-Gomez et al., 2016). We simply assume that the formation of in situ components is a self-assembly process. A host halo that habors N subhaloes has one central galaxy and a maximum of N satellite galaxies.
3.1. Formation and assembly history of stellar mass
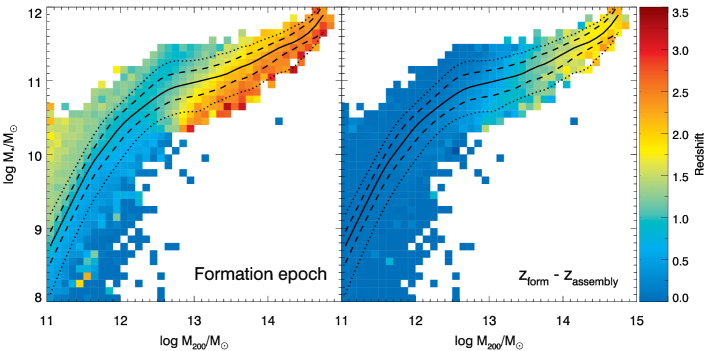
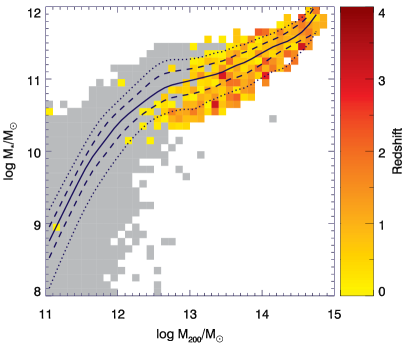
We quantify the star formation history of a galaxy by finding the redshifts by which half of the stellar populations found in the final galaxies have been formed. The assembly time of a galaxy is defined as the epoch at which the stellar mass of the main progenitor reaches half of the final mass. The equivalence is made only when galaxies evolve along single-branch merger trees. Figure 2 shows the distributions of and of the central galaxies in the stellar-to-halo mass plane at . The solid, dashed, and dotted lines mark the median, 16-84th percentile distribution, and 2.5-97.5th percentile distribution of . The downsizing trend is clearly shown as a function of the halo mass. This figure implies that the empirical downsizing trend in which more massive galaxies have older stellar ages originates from the dependence of on the halo mass and stellar-to-halo mass relation. The formation time of very massive galaxies ( at ) is found at , in agreement with Thomas et al. (2010) who derived the half mass formation time of early type galaxies using the Sloan Digital Sky Survey.
LY13 found an upsizing trend in the assembly time of stellar mass, which is directly opposite to the downsizing nature of formation time. This result is consistent with recent observations. Bundy et al. (2009) found from the GOODS field that the pair fraction of red massive spheroidals is higher than that of smaller galaxies at . They expected that the pairs would eventually merge with each other, and form massive early types. Matsuoka & Kawara (2010) showed that the number density of massive galaxies increases faster than that of less massive galaxies for . The majority of the massive galaxies appear to be quenched. Consequently, mergers are their most likely mass growth channel during the period of time. In our fiducial model, the centrals of more massive haloes have younger assembly times, which results in the increase of with increasing halo mass (the right panel of Figure 2). In summary, more massive galaxies are older in terms of formation ages but relatively younger in terms of assembly ages (De Lucia et al., 2006; De Lucia & Blaizot, 2007; Guo & White, 2008; Jiménez et al., 2011; Lee & Yi, 2013; Lee et al., 2014), and this trend originates from the halo mass assembly.
3.2. Origin of stellar components
3.2.1 Ex situ fractions in the stellar-to-halo mass plane
We quantified the overall contribution of galaxy mergers to stellar mass growth by measuring the fraction of ex situ components in galaxies, i.e., . Figure 3 shows the distribution of central and satellite galaxies in the stellar-to-host halo mass plane at . The distribution of the centrals has a strong correlation with , but its dependency on is not clear. This result suggests once again that the increase in with increasing demonstrated by previous studies (e.g. Oser et al., 2010; Lackner et al., 2012; Lee & Yi, 2013; Rodriguez-Gomez et al., 2016) may be a derivative of the and the stellar to halo mass relations.
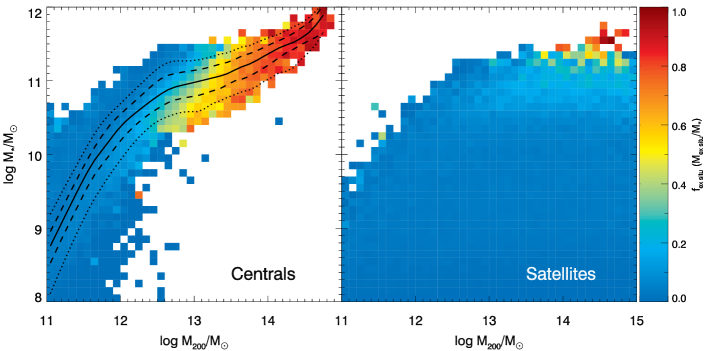
The stellar-to-halo mass relation of satellites is broken up as haloes are stripped during orbital motion in dense environments (e.g. Boylan-Kolchin et al., 2008). Therefore, the distribution of satellites in the right panel of Figure 3 is plotted as a function of their host halo mass. As the stellar-to-halo mass relation is shuffled, no correlation was found between the distribution of satellites and their host halo mass. However, the correlation between and the mass of satellites appears to be clearer than that of centrals. When they are in the same halo, satellite galaxies are generally less massive than centrals mainly because of low mass growth rates after becoming satellites. Tidal or ram pressure stripping effectively removes gas reservoirs in satellites, eventually quenching star formation activities (Gunn & Gott, 1972; Abadi et al., 1999; Quilis et al., 2000; Chung et al., 2007; Tonnesen & Bryan, 2009; Yagi et al., 2010; Kimm et al., 2011; Steinhauser et al., 2012). In addition, there is little opportunity to increase their mass via mergers.
We trace the mass growth histories of central galaxies in the stellar-to-halo mass plane. Figure 4 shows the mean mass evolution tracks of the main progenitors of galaxies binned by final mass. Since we defined , the mass growth rate of a galaxy at an epoch is . The black solid lines represent phase and the dotted lines represent the opposite. The color code of the filled circles indicates redshifts. It can be seen that halo mass regulates which channel is dominant in mass growth. The central galaxies of the most massive haloes () enter the merger-dominant phase at while those at only reach this phase until . This plot shows that galaxies migrate to the merger-dominant phase when their host halo mass begins to exceed . As mentioned above, more mergers in the centrals of larger haloes cause earlier quenching and higher ex situ fractions. Galaxies residing in haloes below increase their stellar mass in directly proportion to the increase in their halo mass. For example, central galaxies at experience 1.4 dex of halo mass growth between and their stellar mass increases to almost the same scale during the same period of time. On the other hand, halo mass growth does not accompany the same rate of stellar mass growth in the most massive group. This is because star formation is suppressed by strong feedback and not all of the stellar mass is concentrated in the central regions. Stars in massive haloes are located in satellite galaxies or intra-cluster (Feldmeier et al., 2002; Gonzalez et al., 2005) as well as in the central galaxies of massive haloes.
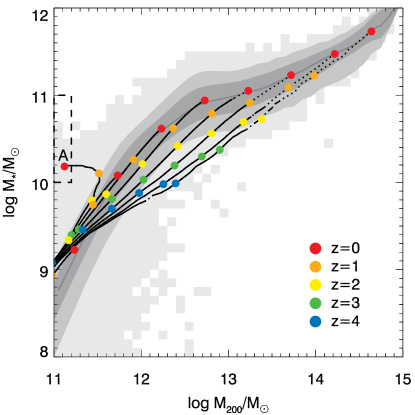
The peak of the stellar-to-halo mass fraction is found at as (Moster et al., 2010; Behroozi et al., 2010, 2013). However, the galaxies in the dashed box have notably large fractions. Their number fraction is actually negligible, far outside the 97.5th percentile distribution of . Only 87 galaxies are found in the box out of the plus galaxies at at . We look into how the galaxies gain that particularly large ratio. As the averaged evolution track of the galaxies in the box marked by A indicates, they undergo severe halo stripping at . They barely increase their stellar mass during the period of time because of gas loss. Besides, the degree of halo stripping is not harsh enough to significantly strip stellar components in central regions (Smith et al., 2016). All of the central galaxies are typically located in dense environments where tidal force exerted by neighbouring massive haloes disturbs small systems.
3.2.2 Ex situ fractions at a given stellar and halo mass
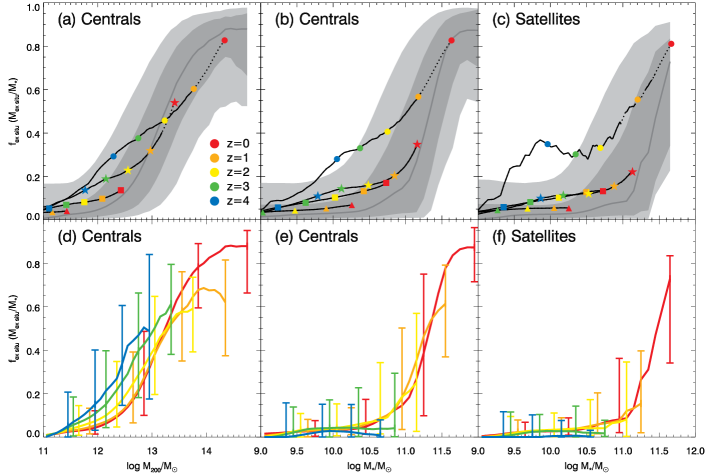
The marginal distribution of in terms of or is plotted in Figure 5. The grey shading displays the percentile distribution of . Panel (a) demonstrates the gradual increase of of the centrals with increasing . However, in panel (b) the of the central galaxies stays below 0.1 at and rises sharply in . This is because galaxies with at are hosted by haloes in the wide mass range of . The relation between the stellar and halo masses causes the large dispersion of around . The satellites show a slightly lower relation than centrals, but the overall trend is similar, as shown in panel (c). Specifically, the of the most massive satellites is comparable to that of the centrals. This suggests that mergers are essential to form massive galaxies. Such massive galaxies were centrals until recently, and have only just became satellites.
The black solid and dotted lines with colored symbols in the upper panels of Figure 5 show the averaged evolution tracks of the main progenitors in the planes. The color code and line styles are the same as those in Figure 4. The galaxies are binned by 1 dex from or 0.5 dex from at . The main progenitors of the galaxies in the different mass bins are marked by different symbols. Panel (a) illustrates that galaxies that become merger-dominant before are finally hosted by haloes of . In panels (b) and (c), the transition takes place only in the most massive groups of both centrals and satellites. Stochastic effects cause the uneven tracks of the most massive satellites in panel (c).
LY13 provided a quantitative prediction of the mean as a function of the final stellar mass without separating galaxies into central and satellites: 20%, 40%, and 70% for the galaxies in 10.5-11, 11-11.5, and 11.5-12 at , respectively. The red filled circles, stars, and squares, in panels (b) and (c) of Figure 5 indicate the mean of the three groups binned by the final stellar mass. Because the majority of the galaxies in the three groups are centrals, the relation of the centrals is comparable to that of LY13. The relation and the large dispersion at are in good agreement with LY13 and Rodriguez-Gomez et al. (2016).
The bottom panels of Figure 5 demonstrate the evolution of the relation at . The different redshifts are indicated by the color codes used in panel (a). At a given halo mass, the central galaxies have a higher at higher redshifts. This is because the haloes that show up at higher redshifts are located in relatively denser environments than those having the same mass at lower redshifts. Therefore, low mass haloes at likely have growth histories radically different from local low mass haloes. On the other hand, high redshift galaxies have a low median in panels (e) and (f). The most massive haloes are always rare and their centrals have stellar masses with larger dispersions at higher redshifts. In other words, the stellar-to-halo mass relation is less tight at higher redshifts. The ex situ fraction begins to rapidly increase at , which implies that galaxy mergers are essential to build up galaxies above . On the contrary, galaxies similar in mass to the Milky Way () would increase their stellar mass mostly from in situ star formation, regardless of whether they are centrals or satellites.
3.3. Evolution history of the two mass growth channels
3.3.1 Specific mass growth histories of the main progenitors
The previous sections show that the leading mass growth channels change over time, depending on the halo or stellar mass. In order to examine the time evolution of the contribution of mergers and in situ star formation to stellar mass growth, we measure the specific stellar mass accretion rate (SSAR) in the same way that the specific star formation rate (SSFR) is defined. In this study, accretion indicates the infall of stellar components into galaxies only via mergers.
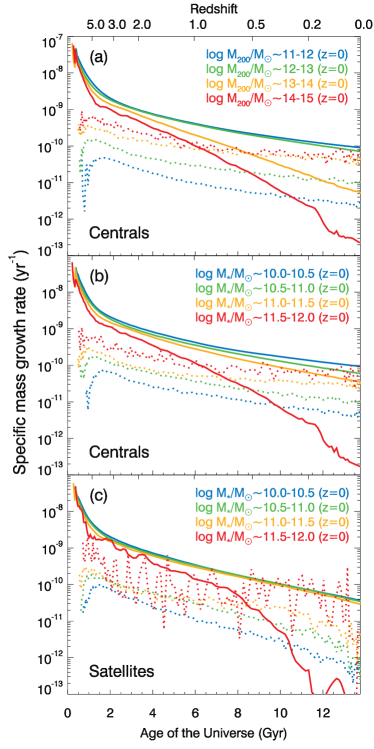
Figure 6 shows the SSFRs and SSARs of the main progenitors of galaxies grouped by final mass and status. In all the panels, the SSFRs are lower in more massive galaxies, while the opposite is true for SSARs, which gently and consistently decrease. However, the SSFRs rapidly decline by after which the decay rates decelerate. In all the panels, the two channels decrease similarly in the third and fourth most massive groups at . However, bigger groups experience a sharp decay in the SSFRs. As discussed in §3.2.1, galaxies enter a merger-dominant phase when their host halo mass increases above in our model. Central galaxies in larger haloes are effectively quenched by more frequent AGN activities and acquire more stellar mass via more mergers. These two phenomena give rise to a transition of dominant mass growth channels. Mergers become the primary process in mass growth until z=0 for the main progenitors of central galaxies with haloes of .
The main progenitors of the most massive centrals in panel (b) enter the merger-dominant phase at . The SSAR of the second most massive group, however, does not meet its SSFR at all. Galaxies in this group are finally hosted by haloes in a wide mass range of . Some of the galaxies residing in haloes above the group scales () finally settle into the merger-dominant phase, as shown in panel (a). However, the majority of the second massive group are the centrals of the smaller haloes (). Thus, the main progenitors of the second most massive galaxies marginally stay in the SSARSSFR phase by . This result is consistent with Woo et al. (2013), who found a strong correlation between the quenched fractions of central galaxies and their host halo mass. AGN feedback and decreasing cooling efficiency naturally result in the trend found in ySAM.
The evolution trend of the specific mass growth rates of satellites in panel (c) appears to be almost the same as that of the centrals in panel (b) in early epochs. This is primarily because they all used to be centrals at high redshifts. As they gradually become satellites with decreasing redshifts, their specific growth rates are suppressed. Because the satellites barely merge with each other, their SSARs are lower than those of the centrals. Environmental effects, such as tidal and ram pressure stripping, suppress star formation activities in satellites by blowing away gas reservoirs. However, AGN feedback is inactive in satellites due to little gas accretion. Therefore, the most and second most massive satellites eventually have slightly lower SSFRs than those of the centrals. The main progenitors of the most massive satellites exhibit behavior similar to those of the most massive centrals. This is mostly because they only recently became satellites. However, the SSARs of the other groups do not even come close to their SSFRs.
The transition epochs of the two mass growth channels as a function of the final stellar mass are in good agreement with previous studies that were based on semi-analytic approaches (e.g. Lee & Yi, 2013) and hydrodynamics (e.g. Oser et al., 2010; Rodriguez-Gomez et al., 2016). In Figure 7, the redshift transitions between the two channels are plotted in the stellar-to-halo mass plane. The grey shading indicates the mass ranges of the galaxies that stay in the star-formation-dominant phase through on average in each mass bin. The transitions are found in galaxies that end up in haloes with , as panel (a) of Figure 6 demonstrates. This suggests that the halo mass evolution plays a key role in the two-phase scenario of massive galaxy formation in which in situ star formation rapidly increases the galaxy stellar mass at early epochs and mergers gradually build it up by (Oser et al., 2010).
3.3.2 Specific mass growth rates at each epoch
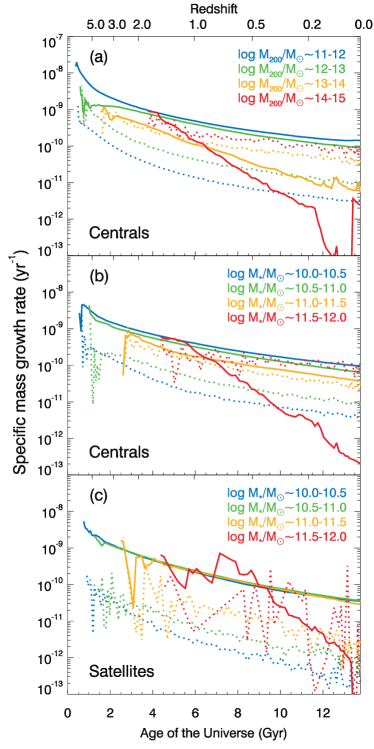
The specific mass growth rates of the main progenitors in the previous section indicate how the galaxies chosen at have evolved over time. Thus, Figure 6 is plotted based on a theoretical viewpoint. However, observations take a snapshot of the galaxies located at various redshifts . In that sense, Figure 8 displays the specific mass growth rates of galaxies binned by mass at each epoch. The more massive galaxies or the centrals of more massive haloes have higher SSARs and lower SSFRs. At a fixed stellar mass, the SSFRs decay by two orders of magnitude during cosmic time, as shown in previous studies (Rodighiero et al., 2010; Karim et al., 2011; Sparre et al., 2015; Furlong et al., 2015).
Cluster-scale haloes () and very massive galaxies () begin to appear at in the co-moving volume of this study. The SSFRs of the most massive groups are comparable to those of less massive groups for a while after emerging in all the panels. The SSFRs are sufficiently high at the moment to increase the stellar mass by a factor of two within a billion years. In our model, galaxies in the most massive ranges at early epochs have been built up by very active star formation, along with galaxy mergers. Rapid halo mass growth leads to violent baryonic accretion into the central regions, eventually inducing very high star formation activities. However, the most massive groups quickly experience a rapid drop in the SSFRs in all the panels.
The central galaxies of the haloes in of panel (a) are in the merger-dominant phase most of the time after they appear in all the panels. The differences between the SSFRs and the SSARs increase in the massive halo groups as cold gas is depleted and cooling is further suppressed by feedback. In the middle panel, the two mass growth channels are almost equally important for the second massive group of centrals () all the time. In this panel, 0.5 dex more massive central galaxies have SSARs 0.5 dex higher at . Consequently, a ten times larger stellar mass falls into 0.5 dex more massive galaxies via mergers. Star formation contributes an order of magnitude more to mass growth than mergers in .
The specific mass growth rates of satellites (panel (c)) are always lower than those of centrals. Environmental effects cause overall low SSFRs. Since satellite galaxies are hardly involved in mergers with other satellites, their SSARs are at least an order of magnitude lower than those of the centrals. Therefore, mergers do not become primary mass growth channels in all groups. In our model, galaxy mergers between satellites mainly occur in sub groups that belong to host haloes that are not yet virialized. Once the sub groups are dynamically dissociated in dense environments, their member galaxies only fall into the central regions of their host haloes in our model.
4. Summary and Conclusion
LY13 examined the assembly history of stellar components in galaxies as a function of final stellar mass using semi-analytic approaches. Here we expand LY13 in a cosmological context by investigating it in terms of extended parameter spaces using a larger cosmological volume simulation. The size and resolution of the volume were designed to cover a wide range of halo masses . The fiducial model of this study was calibrated to fit a set of empirical data. We labelled the stars formed along the main branches of halo merger trees as in situ components and the rest of the stars falling into galaxies via mergers as ex situ components.
The CDM cosmology predicts earlier formation of primordial structures in denser environments and their hierarchical assembly over time. In this framework, the formation and assembly of galaxies are expected to correlate with the evolution of halo environments. In our model, we found that centrals of more massive haloes have older formation times and higher ex situ fractions. The marginal distribution of the ex situ fractions at gradually increases with increasing halo mass. The ex situ components become the majority in the stellar mass of the central galaxies in . However, the distribution of ex situ fractions sharply rises in terms of stellar mass with large dispersion in . This is because the central galaxies at are hosted by a wide range of halo mass . As a result, they have similar masses despite their diverse evolution tracks.
Satellite galaxies have slightly lower ex situ fractions than centrals but the overall trend is similar. Like massive centrals, massive satellites acquired a considerable fraction of their stellar mass via mergers mainly when they were centrals and have only recently become satellites. The marginal distribution of the ex situ fractions evolves with decreasing redshifts. The centrals of the most massive haloes already reach at . The ex situ fraction rapidly increases as the galaxy stellar mass begins to exceed . This can be interpreted to suggest that galaxy mergers are essential for building up galaxies above , whether they end up becoming centrals or satellites.
We examined the time evolution of the specific star formation rates (SSFRs) and specific stellar mass accretion rates (SSARs). First, we traced the specific growth rates of the main progenitors of the galaxies grouped by final halo or stellar mass. The SSFRs of the main progenitors are always lower in more massive groups while the SSARs behave in the opposite manner. In very early epochs, the SSFRs far exceed the SSARs in all galaxies, but this dominance rapidly decreases over time. Furthermore, the SSFRs decay even faster for more massive galaxies, which results in a crossing of the two mass growth channels in some cases. The transition takes place in the main progenitors of the central galaxies that finally reside in the haloes of . In our model, this is the mass range where the two phase scenario for massive early types (Oser et al., 2010) is valid. With the aforementioned results, this suggests that the correlation between the stellar mass and the empirical galaxy formation time (e.g. Cowie et al., 1996), and the fraction of ex situ components proposed by theoretical studies (e.g. Oser et al., 2010; Lackner et al., 2012; Lee & Yi, 2013; Rodriguez-Gomez et al., 2016) may be merely the projection of their intrinsic halo mass dependence upon the stellar-to-halo mass relation. When we looked into the SSAR and SSFR evolution of galaxies in an empirical sense, i.e. binning them by given mass ranges at each epoch with no use of progenitor-descendant relations, we found that mergers are a major channel for mass growth at all times in the centrals of or the centrals of haloes with . However, in satellites, mergers are secondary or even negligible.
This study displayed a strong correlation between the formation and assembly of galaxies and halo mass which only represents local environments. In large scales, however, weaker correlations have been found. Croton & Farrar (2008) compared the empirical luminosity function of void galaxies with their SAM, concluding that large-scale environments do not significantly affect galaxy properties but halo mass assembly is a decisive factor in galaxy evolution. Jung et al. (2014) also presented a similar result using ySAM that galaxy growth rates are largely insensitive to large-scale environments. So, in sum, the evolution of local halo environments plays a leading role in the formation and assembly of galaxy stellar mass. Central galaxies in dense environments grow with vigorous gas inflow at early epochs and the steady mergers of small structures over time. Some galaxies achieve even in low density environments with active in situ star formation, but they come up against a steep barrier to growing further without mergers. Once galaxies are relegated to satellite status, in situ star formation becomes the dominant channel for increasing mass despite the gradual suppression of star formation activities due to environmental effects.
Galaxy formation models are, of course, incomplete as yet and are unable to precisely describe the formation of stellar mass (e.g. Sparre et al., 2015; Furlong et al., 2015; Knebe et al., 2015; Song et al., 2016). Nonetheless, the success of the concordance CDM cosmology gives credibility to the efforts to understand galaxy mass assembly, which is regarded as a consequential process of structure formation in the cosmological framework. This study demonstrates that similarly massive galaxies have a variety of evolution histories, depending on their halo environments. Meanwhile, empirical studies have found a considerable number of luminous galaxies in low density environments as well as dense environments (e.g. Croton et al., 2005; Khim et al., 2015). Motivated by these results, we will carry out a comparison study for massive galaxies that end up with similar properties but reside in different local halo environments.
acknowledgments
We thank Rory Smith for his constructive comments and proofreading. We acknowledge the support from the National Research Foundation of Korea (NRF-2014R1A2A1A01003730). Numerical simulations were performed using the KISTI supercomputer under the programme of KSC-2014-G2-003. S.K.Y. acted as the corresponding author. This work was performed under the collaboration between Yonsei University Observatory and Korea Astronomy and Space Science Institute.
References
- Abadi et al. (1999) Abadi, M. G., Moore, B., & Bower, R. G. 1999, MNRAS, 308, 947
- Baldry et al. (2008) Baldry, I. K., Glazebrook, K., & Driver, S. P. 2008, MNRAS, 388, 945
- Baldry et al. (2012) Baldry, I. K., Driver, S. P., Loveday, J., et al. 2012, MNRAS, 421, 621
- Behroozi et al. (2010) Behroozi, P. S., Conroy, C., & Wechsler, R. H. 2010, ApJ, 717, 379
- Behroozi et al. (2013) Behroozi, P. S., Wechsler, R. H., & Conroy, C. 2013, ApJ, 770, 57
- Bertschinger (1995) Bertschinger, E. 1995, ArXiv Astrophysics e-prints
- Boylan-Kolchin et al. (2008) Boylan-Kolchin, M., Ma, C.-P., & Quataert, E. 2008, MNRAS, 383, 93
- Bundy et al. (2009) Bundy, K., Fukugita, M., Ellis, R. S., et al. 2009, ApJ, 697, 1369
- Chung et al. (2007) Chung, A., van Gorkom, J. H., Kenney, J. D. P., & Vollmer, B. 2007, ApJ, 659, L115
- Cimatti et al. (2004) Cimatti, A., Daddi, E., Renzini, A., et al. 2004, Nature, 430, 184
- Cowie et al. (1996) Cowie, L. L., Songaila, A., Hu, E. M., & Cohen, J. G. 1996, AJ, 112, 839
- Cox et al. (2008) Cox, T. J., Jonsson, P., Somerville, R. S., Primack, J. R., & Dekel, A. 2008, MNRAS, 384, 386
- Croton & Farrar (2008) Croton, D. J., & Farrar, G. R. 2008, MNRAS, 386, 2285
- Croton et al. (2005) Croton, D. J., Farrar, G. R., Norberg, P., et al. 2005, MNRAS, 356, 1155
- Croton et al. (2006) Croton, D. J., Springel, V., White, S. D. M., et al. 2006, MNRAS, 365, 11
- Daddi et al. (2005) Daddi, E., Renzini, A., Pirzkal, N., et al. 2005, ApJ, 626, 680
- De Lucia & Blaizot (2007) De Lucia, G., & Blaizot, J. 2007, MNRAS, 375, 2
- De Lucia et al. (2006) De Lucia, G., Springel, V., White, S. D. M., Croton, D., & Kauffmann, G. 2006, MNRAS, 366, 499
- Dubois et al. (2013) Dubois, Y., Pichon, C., Devriendt, J., et al. 2013, MNRAS, 428, 2885
- Elahi et al. (2013) Elahi, P. J., Han, J., Lux, H., et al. 2013, MNRAS, 433, 1537
- Feldmeier et al. (2002) Feldmeier, J. J., Mihos, J. C., Morrison, H. L., Rodney, S. A., & Harding, P. 2002, ApJ, 575, 779
- Furlong et al. (2015) Furlong, M., Bower, R. G., Theuns, T., et al. 2015, MNRAS, 450, 4486
- Genel et al. (2014) Genel, S., Vogelsberger, M., Springel, V., et al. 2014, MNRAS, 445, 175
- Glazebrook et al. (2004) Glazebrook, K., Abraham, R. G., McCarthy, P. J., et al. 2004, Nature, 430, 181
- Gonzalez et al. (2005) Gonzalez, A. H., Zabludoff, A. I., & Zaritsky, D. 2005, ApJ, 618, 195
- Gruppioni et al. (2015) Gruppioni, C., Calura, F., Pozzi, F., et al. 2015, MNRAS, 451, 3419
- Gunn & Gott (1972) Gunn, J. E., & Gott, III, J. R. 1972, ApJ, 176, 1
- Guo & White (2008) Guo, Q., & White, S. D. M. 2008, MNRAS, 384, 2
- Häring & Rix (2004) Häring, N., & Rix, H.-W. 2004, ApJ, 604, L89
- Hirschmann et al. (2015) Hirschmann, M., Naab, T., Ostriker, J. P., et al. 2015, MNRAS, 449, 528
- Hopkins et al. (2010) Hopkins, P. F., Bundy, K., Croton, D., et al. 2010, ApJ, 715, 202
- Hu (2009) Hu, J. 2009, ArXiv e-prints
- Ji et al. (2014) Ji, I., Peirani, S., & Yi, S. K. 2014, A&A, 566, A97
- Jiménez et al. (2011) Jiménez, N., Cora, S. A., Bassino, L. P., Tecce, T. E., & Smith Castelli, A. V. 2011, MNRAS, 417, 785
- Jung et al. (2014) Jung, I., Lee, J., & Yi, S. K. 2014, ApJ, 794, 74
- Karim et al. (2011) Karim, A., Schinnerer, E., Martínez-Sansigre, A., et al. 2011, ApJ, 730, 61
- Kauffmann & Haehnelt (2000) Kauffmann, G., & Haehnelt, M. 2000, MNRAS, 311, 576
- Kaviraj (2014a) Kaviraj, S. 2014a, MNRAS, 440, 2944
- Kaviraj (2014b) —. 2014b, MNRAS, 437, L41
- Kaviraj et al. (2014) Kaviraj, S., Huertas-Company, M., Cohen, S., et al. 2014, MNRAS, 443, 1861
- Khim et al. (2015) Khim, H.-g., Park, J., Seo, S.-W., et al. 2015, ApJS, 220, 3
- Kimm et al. (2011) Kimm, T., Yi, S. K., & Khochfar, S. 2011, ApJ, 729, 11
- Knebe et al. (2015) Knebe, A., Pearce, F. R., Thomas, P. A., et al. 2015, MNRAS, 451, 4029
- Komatsu et al. (2011) Komatsu, E., Smith, K. M., Dunkley, J., et al. 2011, ApJS, 192, 18
- Kormendy & Bender (2013) Kormendy, J., & Bender, R. 2013, ApJ, 769, L5
- Kormendy & Ho (2013) Kormendy, J., & Ho, L. C. 2013, ARA&A, 51, 511
- Lackner et al. (2012) Lackner, C. N., Cen, R., Ostriker, J. P., & Joung, M. R. 2012, MNRAS, 425, 641
- Lee & Yi (2013) Lee, J., & Yi, S. K. 2013, ApJ, 766, 38
- Lee et al. (2014) Lee, J., Yi, S. K., Elahi, P. J., et al. 2014, MNRAS, 445, 4197
- Li & White (2009) Li, C., & White, S. D. M. 2009, MNRAS, 398, 2177
- Magorrian et al. (1998) Magorrian, J., Tremaine, S., Richstone, D., et al. 1998, AJ, 115, 2285
- Marconi & Hunt (2003) Marconi, A., & Hunt, L. K. 2003, ApJ, 589, L21
- Matsuoka & Kawara (2010) Matsuoka, Y., & Kawara, K. 2010, MNRAS, 405, 100
- McConnell & Ma (2013) McConnell, N. J., & Ma, C.-P. 2013, ApJ, 764, 184
- Moster et al. (2010) Moster, B. P., Somerville, R. S., Maulbetsch, C., et al. 2010, ApJ, 710, 903
- Muldrew et al. (2011) Muldrew, S. I., Pearce, F. R., & Power, C. 2011, MNRAS, 410, 2617
- Muldrew et al. (2012) Muldrew, S. I., Croton, D. J., Skibba, R. A., et al. 2012, MNRAS, 419, 2670
- Murante et al. (2004) Murante, G., Arnaboldi, M., Gerhard, O., et al. 2004, ApJ, 607, L83
- Naab et al. (2009) Naab, T., Johansson, P. H., & Ostriker, J. P. 2009, ApJ, 699, L178
- Onions et al. (2013) Onions, J., Ascasibar, Y., Behroozi, P., et al. 2013, MNRAS, 429, 2739
- Oser et al. (2012) Oser, L., Naab, T., Ostriker, J. P., & Johansson, P. H. 2012, ApJ, 744, 63
- Oser et al. (2010) Oser, L., Ostriker, J. P., Naab, T., Johansson, P. H., & Burkert, A. 2010, ApJ, 725, 2312
- Panter et al. (2007) Panter, B., Jimenez, R., Heavens, A. F., & Charlot, S. 2007, MNRAS, 378, 1550
- Prunet & Pichon (2013) Prunet, S., & Pichon, C. 2013, MPgrafic: A parallel MPI version of Grafic-1, Astrophysics Source Code Library
- Quilis et al. (2000) Quilis, V., Moore, B., & Bower, R. 2000, Science, 288, 1617
- Rodighiero et al. (2010) Rodighiero, G., Cimatti, A., Gruppioni, C., et al. 2010, A&A, 518, L25
- Rodriguez-Gomez et al. (2016) Rodriguez-Gomez, V., Pillepich, A., Sales, L. V., et al. 2016, MNRAS, 458, 2371
- Sani et al. (2011) Sani, E., Marconi, A., Hunt, L. K., & Risaliti, G. 2011, MNRAS, 413, 1479
- Schawinski et al. (2006) Schawinski, K., Khochfar, S., Kaviraj, S., et al. 2006, Nature, 442, 888
- Schaye et al. (2015) Schaye, J., Crain, R. A., Bower, R. G., et al. 2015, MNRAS, 446, 521
- Sheen et al. (2012) Sheen, Y.-K., Yi, S. K., Ree, C. H., & Lee, J. 2012, ApJS, 202, 8
- Smith et al. (2016) Smith, R., Choi, H., Lee, J., et al. 2016, ApJ, 833, 109
- Somerville et al. (2008) Somerville, R. S., Hopkins, P. F., Cox, T. J., Robertson, B. E., & Hernquist, L. 2008, MNRAS, 391, 481
- Song et al. (2016) Song, M., Finkelstein, S. L., Ashby, M. L. N., et al. 2016, ApJ, 825, 5
- Sparre et al. (2015) Sparre, M., Hayward, C. C., Springel, V., et al. 2015, MNRAS, 447, 3548
- Springel (2005) Springel, V. 2005, MNRAS, 364, 1105
- Springel et al. (2005) Springel, V., Di Matteo, T., & Hernquist, L. 2005, MNRAS, 361, 776
- Springel et al. (2001) Springel, V., Yoshida, N., & White, S. D. M. 2001, New A, 6, 79
- Srisawat et al. (2013) Srisawat, C., Knebe, A., Pearce, F. R., et al. 2013, MNRAS, 436, 150
- Steinhauser et al. (2012) Steinhauser, D., Haider, M., Kapferer, W., & Schindler, S. 2012, A&A, 544, A54
- Thomas et al. (2010) Thomas, D., Maraston, C., Schawinski, K., Sarzi, M., & Silk, J. 2010, MNRAS, 404, 1775
- Tonnesen & Bryan (2009) Tonnesen, S., & Bryan, G. L. 2009, ApJ, 694, 789
- Trujillo et al. (2006) Trujillo, I., Förster Schreiber, N. M., Rudnick, G., et al. 2006, ApJ, 650, 18
- van Dokkum (2005) van Dokkum, P. G. 2005, AJ, 130, 2647
- van Dokkum et al. (2010) van Dokkum, P. G., Whitaker, K. E., Brammer, G., et al. 2010, ApJ, 709, 1018
- Vogelsberger et al. (2014) Vogelsberger, M., Genel, S., Springel, V., et al. 2014, MNRAS, 444, 1518
- White & Frenk (1991) White, S. D. M., & Frenk, C. S. 1991, ApJ, 379, 52
- White & Rees (1978) White, S. D. M., & Rees, M. J. 1978, MNRAS, 183, 341
- Woo et al. (2013) Woo, J., Dekel, A., Faber, S. M., et al. 2013, MNRAS, 428, 3306
- Yagi et al. (2010) Yagi, M., Yoshida, M., Komiyama, Y., et al. 2010, AJ, 140, 1814
- Yi et al. (2013) Yi, S. K., Lee, J., Jung, I., Ji, I., & Sheen, Y.-K. 2013, A&A, 554, A122