What we recently learnt about Crab: structure of the wind, the shock, flares and reconnection
Abstract
We can probe observationally and reproduce theoretically the most detailed properties of the Crab Nebula nearest to the pulsar - The Inner Knot. The tiny knot is indeed a bright spot on the surface of a quasi-stationary magnetic relativistic shock that efficiently accelerates particles. It required that the part of the wind that produces the Inner Knot has low magnetization; thus, it is not a site of gamma-ray flares.
We develop a model of particle acceleration during explosive reconnection events in relativistic highly magnetized plasma and apply the model to explain the Crab gamma-ray flares. Particles are efficiently accelerated by charge-starved DC-type electric fields during initial stages of magnetic flux merges. Thus, magnetic reconnection is an important, and possibly dominant process of particle acceleration in high energy astrophysical sources.
Astronomy consists of two parts: the Crab Nebula and all the rest.
Attributed to I.S. Shklovsky
1 Introduction
Understanding the nature of the Crab Nebula was one of the major achievements of Iosif Shklovsky (Shklovskii, I.S., On the Nature of the Crab Nebula s Optical Emission, Doklady Akad. Nauk SSSR 90, 983 (1953), in Russian; translated with commentary in Lang & Gingerich, 1979). One might argue that the idea that the continuum emission is generated by a population of relativistic electrons via synchrotron emission gave birth to a new field - relativistic astrophysics. Only few years before Shklovsky’ paper Minkowski wrote ”The only physically justified assumption is that the continuous spectrum is produced by free-free and free-bound transitions” (Minkowski, 1942).
The Crab pulsar and its pulsar wind nebula (PWN) remain the prime targets for high energy astrophysical research. In many ways, the Crab Nebula is the paragon of astrophysical high energy source - many of the current models of Active Galactic Nuclei and Gamma Ray Bursts are based on what we have learned from the studies of the Crab. The recent detection of flares from the Crab Nebula by AGILE and Fermi satellites (Tavani et al., 2011; Abdo et al., 2011) have brought this object into the “focal point” once again. Their extreme properties seem impossible to explain within the standard theories of non-thermal particle acceleration and require their overhaul with important implications to high energy astrophysics in general (e.g. Lyutikov, 2010; Clausen-Brown & Lyutikov, 2012; Cerutti et al., 2012a; Bühler & Blandford, 2014; Lyutikov et al., 2016b)
2 Crab Inner knot
In the MHD models of the Crab Nebula, the super-fast-magnetosonic relativistic wind of the Crab pulsar terminates at a reverse shock (Rees & Gunn, 1974; Kennel & Coroniti, 1984). However, finding the shock in the images of the Crab Nebula has not been a straight-forward matter - there seem to be no sharp feature which can be undoubtedly identified with the shock surface. In their seminal paper, Kennel & Coroniti (1984) discuss the under-luminous region hosting the Crab pulsar and surrounded by the optical wisps as an indicator of the shock presence. After the discovery of the inner X-ray ring by Chandra (Weisskopf et al., 2000; Hester et al., 2002), the ring is often referred to as the termination shock and yet this feature looks much more like a collection of knots than a smooth surface.
The wind from an oblique rotator should have the so-called striped zone where the orientation of magnetic field alternated on the scale of the pulsar period. The magnetic energy associated with these stripes can be dissipated at the termination shock and converted into the energy of the wind particles (Lyubarsky, 2003; Sironi & Spitkovsky, 2011).
Given the highly anisotropic nature of the wind, the termination shock is squashed along the polar direction, Fig. 1 and can be highly oblique with respect to the upstream flow (Lyubarsky, 2002). Downstream of the shock, the flow can still be relativistic and its emission subject to strong Doppler beaming.
The computer simulations of the Crab nebula and its radiation (Komissarov & Lyubarsky, 2004) (see also more advanced more advanced 2D (Camus et al., 2009) and 3D (Porth et al., 2014) simulations) revealed the presence of a very bright compact feature in the synthetic synchrotron maps, highly reminiscent of the HST knot 1 of the Crab Nebula located very close to the pulsar (also called the inner knot, Hester et al., 1995). (In these simulations, the termination shock was treated as source of synchrotron electrons with power-law energy spectrum, which then were carried out into the nebula by the shocked wind plasma.)
Recently, a targeted multi-wavelength study of the Crab’s inner knot has been conducted by Rudy et al. (2015) in order to check if it shows any activity correlated with the gamma-ray flares. Although no such correlation has been found, the optical data reveal the structure and temporal evolution of the knot with unprecedented detail.
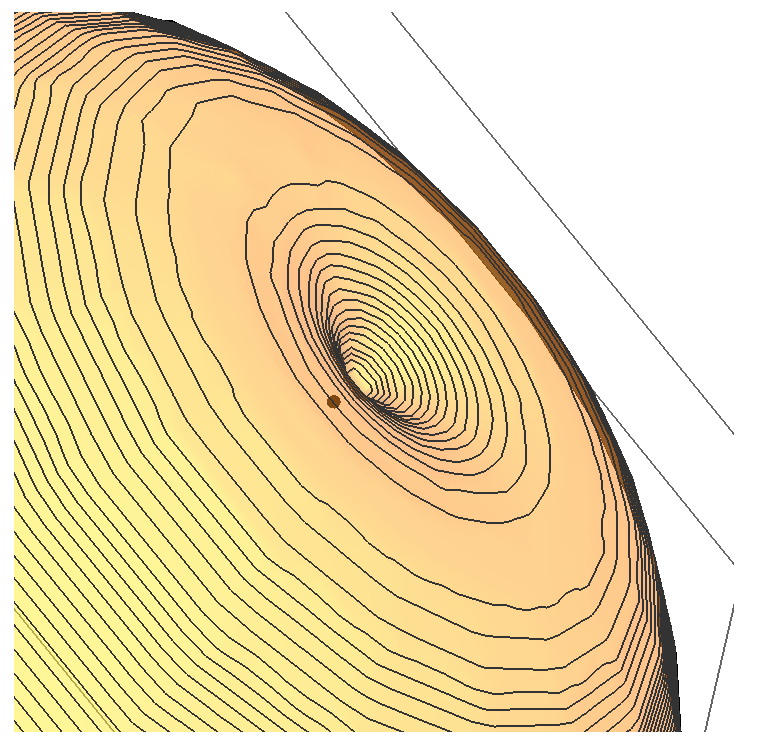
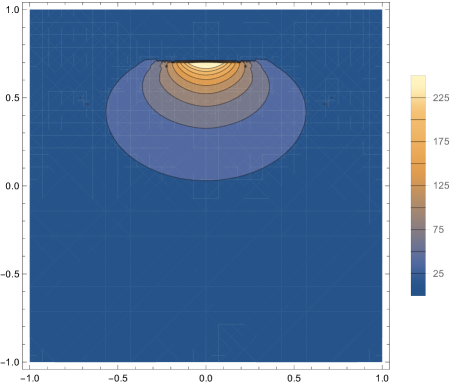
Lyutikov et al. (2016a) investigated if the data are consistent with the MHD-shock model of the knot using simple analytical and semi-analytical tools. In particular, they combined the theoretical shape of the shock with the oblique shock jumps in order to obtain the Doppler-beaming of the post shock emission and use this to determine the location, the shape and the brightness distribution of the knot. The model, Fig. 2, successfully explains a number of its observed properties:

-
Location: The knot is located on the same side of the pulsar as the Crab jet, along the symmetry axis of the inner nebula, and on the opposite side as the brighter section of the Crab torus. This is a direct consequence of the termination shock geometry and the Doppler-boosting.
-
Size: The knot size is comparable to its separation from the pulsar. This also follows from the shock geometry and the Doppler-beaming. The anisotropy of the proper synchrotron emissivity, which vanishes along the magnetic field direction in combination with the relativistic aberration of light is another significant factor. Only models with low magnetization of the post-shock flow, with the effective magnetization parameter of the wind agree with the observations.
-
Elongation: The knot is elongated in the direction perpendicular to the symmetry axis. This is because the knot emission comes from the region where the shock surface is almost parallel to the line of sight.
-
Polarization: The knot polarization degree is high, and the electric vector is aligned with the symmetry axis. This come due to the fact that the post-shock magnetic field is highly ordered in the vicinity of the termination shock and azimuthal. In the model, the relativistic aberration of light leads to a noticeable rotation of the polarization vector along the knot and this prediction could be tested in future polarization observations. Accordingly, the polarization degree of the integral knot emission depends on the integration area - the bigger the area the smaller the degree is.
-
Luminosity: Taking into account Doppler beaming, the observed radiative efficiency of the inner knot is consistent with efficient particle acceleration at the termination shock and the knot’s magnetic field of one milli-Gauss strength, which is a reasonable value for the inner Crab Nebula.
-
Variability: The knot flux is anti-correlated with its separation from the pulsar. In the numerical simulations, the termination shock is found to be highly unsteady, changing its size and shape. As the shock moves away from the pulsar, so does the knot region, which leads to lower magnetic field and hence lower emissivity. Another outcome of the shock variability in the MHD simulations is the emission of wisps and hence one expects both the processes to occur on the same time-scale, which is consistent with the observations.
-
Relation to Crab -ray flares: The model requires that the sector of the wind that produces the inner knot has low magnetization . Thus, it is not a region where flares originate since flares require highly magnetized medium, §3.
Our results may have a number of important implications to the astrophysics of relativistic plasma in general and that of PWN in particular. They show that the termination shock of the relativistic wind from the Crab pulsar is a reality and that this shock is a location of efficient particle acceleration. The strong Doppler-beaming of the emission from the shock explains why this shock has been so elusive. Only the emission from a small patch on the shock surface, the inner knot, is strongly Doppler-boosted and hence prominent. For most of the shock, its emission is beamed away from the Earth and hence difficult to observe.
The shock model of the inner knot allows us to constrain the parameters of the wind from the Crab pulsar. Taken directly, the model requires the wind to be particle-dominated, , at least at the polar latitudes of . However, in the case of a striped wind, its termination shock can mimic that of a low flow even when the actual wind magnetization is extremely high (Lyubarsky, 2003). In this context, the magnetic inclination angle of the Crab pulsar should be above , which means that most of the Poynting flux of the Crab wind is converted into particles, if not in the wind itself then at its termination shock (Komissarov, 2013). This is in agreement with the results of numerical simulations, which can reproduce the observed properties of the inner Crab Nebula extremely well in models with moderate wind magnetization (Porth et al., 2014). However, the polar region of a pulsar wind is free of stripes and can still inject highly magnetized plasma into its PWN.
3 Crab gamma-ray flares
The detection of flares from Crab Nebula by AGILE and Fermi satellites (Tavani et al., 2011; Abdo et al., 2011; Buehler et al., 2012) is one of the most astounding discoveries in high energy astrophysics. The unusually short durations, high luminosities, and high photon energies of the Crab Nebula gamma-ray flares require reconsideration of our basic assumptions about the physical processes responsible for acceleration of the highest-energy emitting particles in the Crab Nebula, and, possibly in other high-energy astrophysical sources.
The Crab flares are characterized by an increase of gamma-ray flux above 100 MeV by a factor of few or more on the day time-scale. This energy corresponds to the high end of the Crab’s synchrotron spectrum. Most interestingly, in the other energy bands nothing unusual has been observed during the flares so far (Weisskopf et al., 2013). This suggests that the physical processes behind the flares lead to a dramatic increase of the highest energy population of relativistic electrons in the nebula, whereas lower energy population remains largely unaffected. The short duration of flares indicate explosive and highly localised events.
Most importantly, the peak of the flare spectrum approaches and even exceeds the maximal rest-frame synchrotron photon energy (de Jager et al., 1996; Lyutikov, 2010; Clausen-Brown & Lyutikov, 2012). Balancing the synchrotron energy losses in the magnetic field against the energy gain via acceleration in the electric field of strength leads to the upper limit of the synchrotron photon energy
The high conductivity of astrophysical plasma ensures that for typical accelerating electric field . The fact that the flare spectrum extends beyond this limit pushes towards unity, which implies energy gain on the scale of the gyration period. This practically excludes stochastic acceleration mechanisms in general and the shock acceleration in particular. In principle, strong Doppler boosting could somewhat reduce this constraint but the lack of observational evidence for ultra-relativistic macroscopic motion inside the nebula makes this unlikely.
A widely discussed alternative to the shock acceleration mechanism is the particle acceleration accompanying magnetic reconnection. It is well known that magnetic reconnection can lead to explosive release of magnetic energy, e.g. in solar flares. However, properties of plasma in the Crab Nebula, as well as magnetospheres of pulsars and magnetars, pulsar winds, AGN and GRB jets and other targets of relativistic astrophysics, are very different from those of more conventional Solar and laboratory plasmas (Lyutikov & Lazarian, 2013). In particular, the energy density of magnetic field can exceed not only the thermal energy density but also the rest mass-energy density of plasma particles. In order to quantify such a strong magnetization, it is convenient to use the relativistic magnetization parameter
| (1) |
where is the relativistic enthalpy, which includes the rest mass-energy density of plasma. In traditional plasmas this parameter is very small but in relativistic astrophysics is quite common. This parameter is uniquely related to the Alfvén speed via
We developed a model of particle acceleration in explosive reconnection events in relativistic magnetically-dominated plasmas and apply it to explain gamma-ray flares from the Crab Nebula (Lyutikov et al., 2016b). The model relies on development of current-driven instabilities on macroscopic scales (not related to plasma skin depths), driven by large-scales magnetic stresses (of the type “parallel currents attract”). Using analytical and numerical methods (fluid and particle-in-cell simulations), we study a number of model problems involving merger of both current-carrying and zero total current magnetic flux tubes in relativistic magnetically-dominated plasma: (i) we extend Syrovatsky’s classical model of explosive -point collapse to magnetically-dominated plasmas; (ii) we consider instability of two-dimensional force-free system of magnetic islands/flux tubes (2D “ABC” structures); (iii) we consider merger of two zero total poloidal current magnetic flux tubes. In all cases regimes of spontaneous and driven evolution are investigated.
3.1 Large scale dynamics of PWNe - formation of current-carrying flux tubes
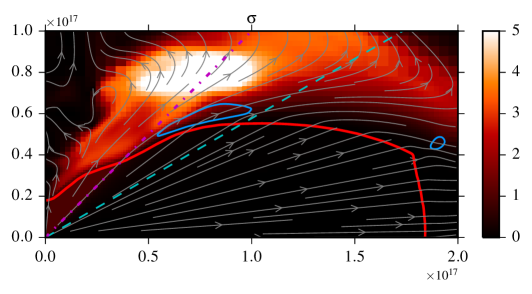
The powerful Crab flares require that energy from a macroscopic scale is made available to the acceleration process. As we will discuss in the following, current-driven MHD instabilities like the coalescence of parallel currents and the ”X-point collapse” can be a viable way to achieve this. One of the key questions is then how a violently unstable and highly magnetized configuration is setup in the first place. To locate potential sites for the flaring region, we need to identify regions of high sigma and analyze the flow structure in these candidate flaring regions. Here we use the result of simulations by Porth et al. (2014). Although the scales required for the “daily” flare duration are not resolved by the simulation (its resolution is light-days), it is instructive to correlate the high-sigma region (that forms as a consequence of flow-expansion) with the current distribution in the simulations.
Importantly, highly magnetized regions in the bulk of the nebula can be achieved via flow expansion at intermediate latitude regions starting with only mildly magnetized wind. In Fig. 1 we show the magnetization in the -plane from simulations of (Porth et al., 2014). One can clearly see that the magnetization rises well above the maximal injected value of . The highest value of in the snapshot is achieved at the point where radial expansion reverses and forms the plume-like polar flow.
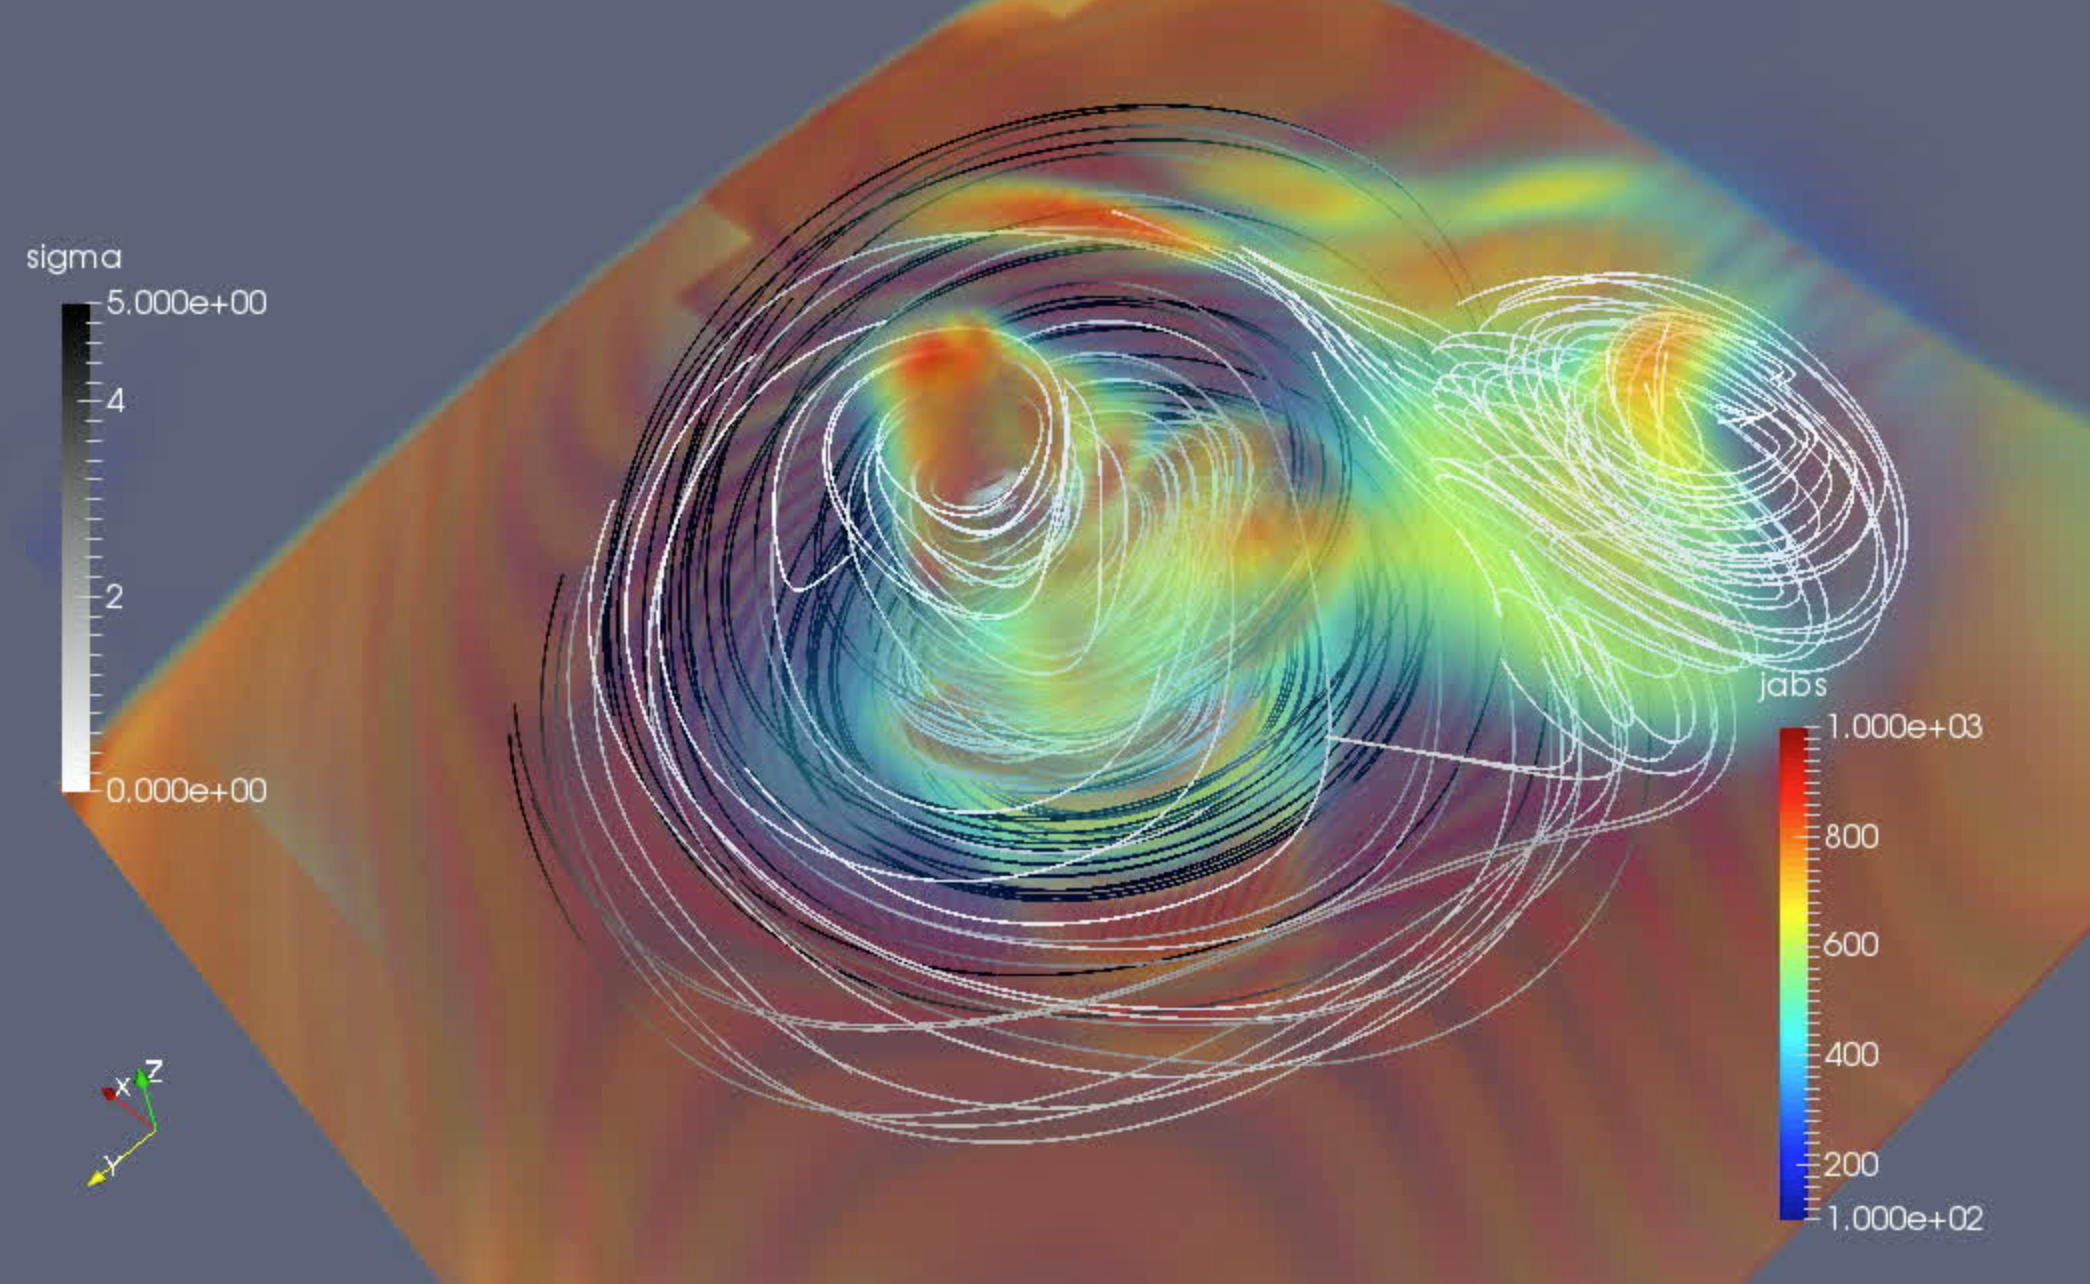
To better understand the geometry of the current and magnetic field, we display a representative volume rendering of the polar region in Fig. 3. In the rendering, one can see the violently unstable polar beam embedded into the more regular high- region comprised of toroidal field lines. The plume forms downstream of this structure and is also strongly perturbed. A part of the disrupted plume approaches the termination shock as a flux-tube. The presence of such a configuration where two flux tubes can come together very close to the high sigma region lets us speculate that Crab flares might originate when the right geometry (e.g. parallel flux tubes) coincides with high magnetization as present in the nebula even for moderate wind magnetization. For higher magnetizations of the polar beam, the mechanism described by Lyubarsky (2012) could directly act also without first having to rely on enhancement of via flow expansion. Extrapolating from the moderate sigma simulations where the polar beam is highly unstable and forms a filamented current, this seems feasible at the very least.
As an initial pre-flare state of plasma we consider a 2D force-fee lattice of magnetic flux tubes
| (2) |
This constitutes a lattice of force-free magnetic islands separated by X-points in equilibrium. Islands have alternating out-of-the-plane poloidal fields and alternating toroidal fields. Each magnetic flux tube carries a magnetic flux , energy per unit length , helicity per unit length and axial current . Helicity of both types of flux tubes is of the same sign. Previously, this configuration (called ABC) has been considered by Parker (1983) in the context of Solar magnetic fields
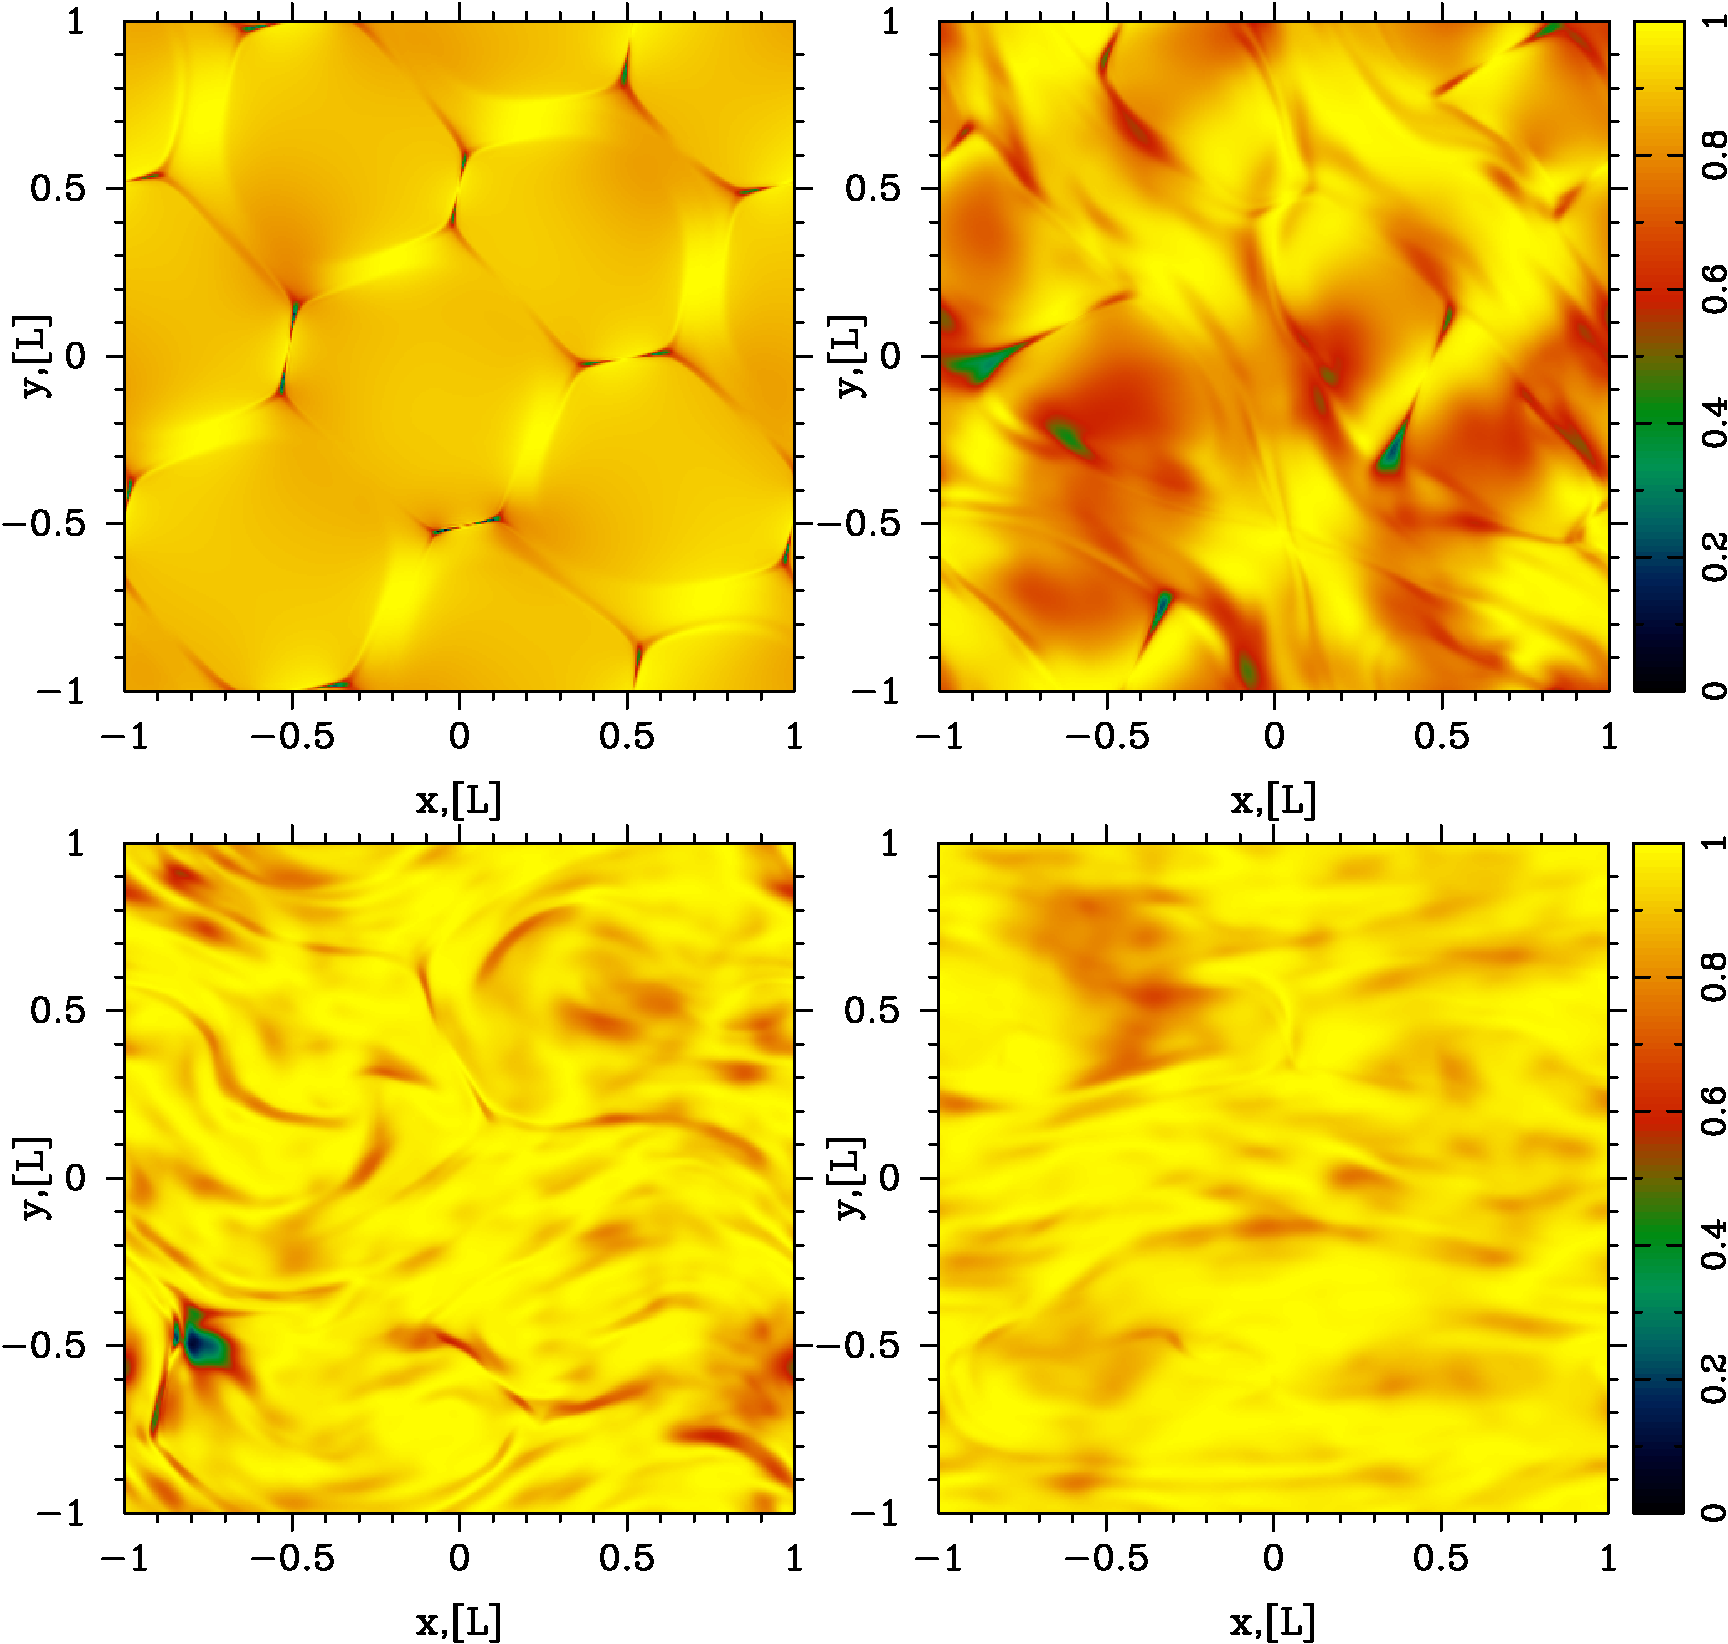
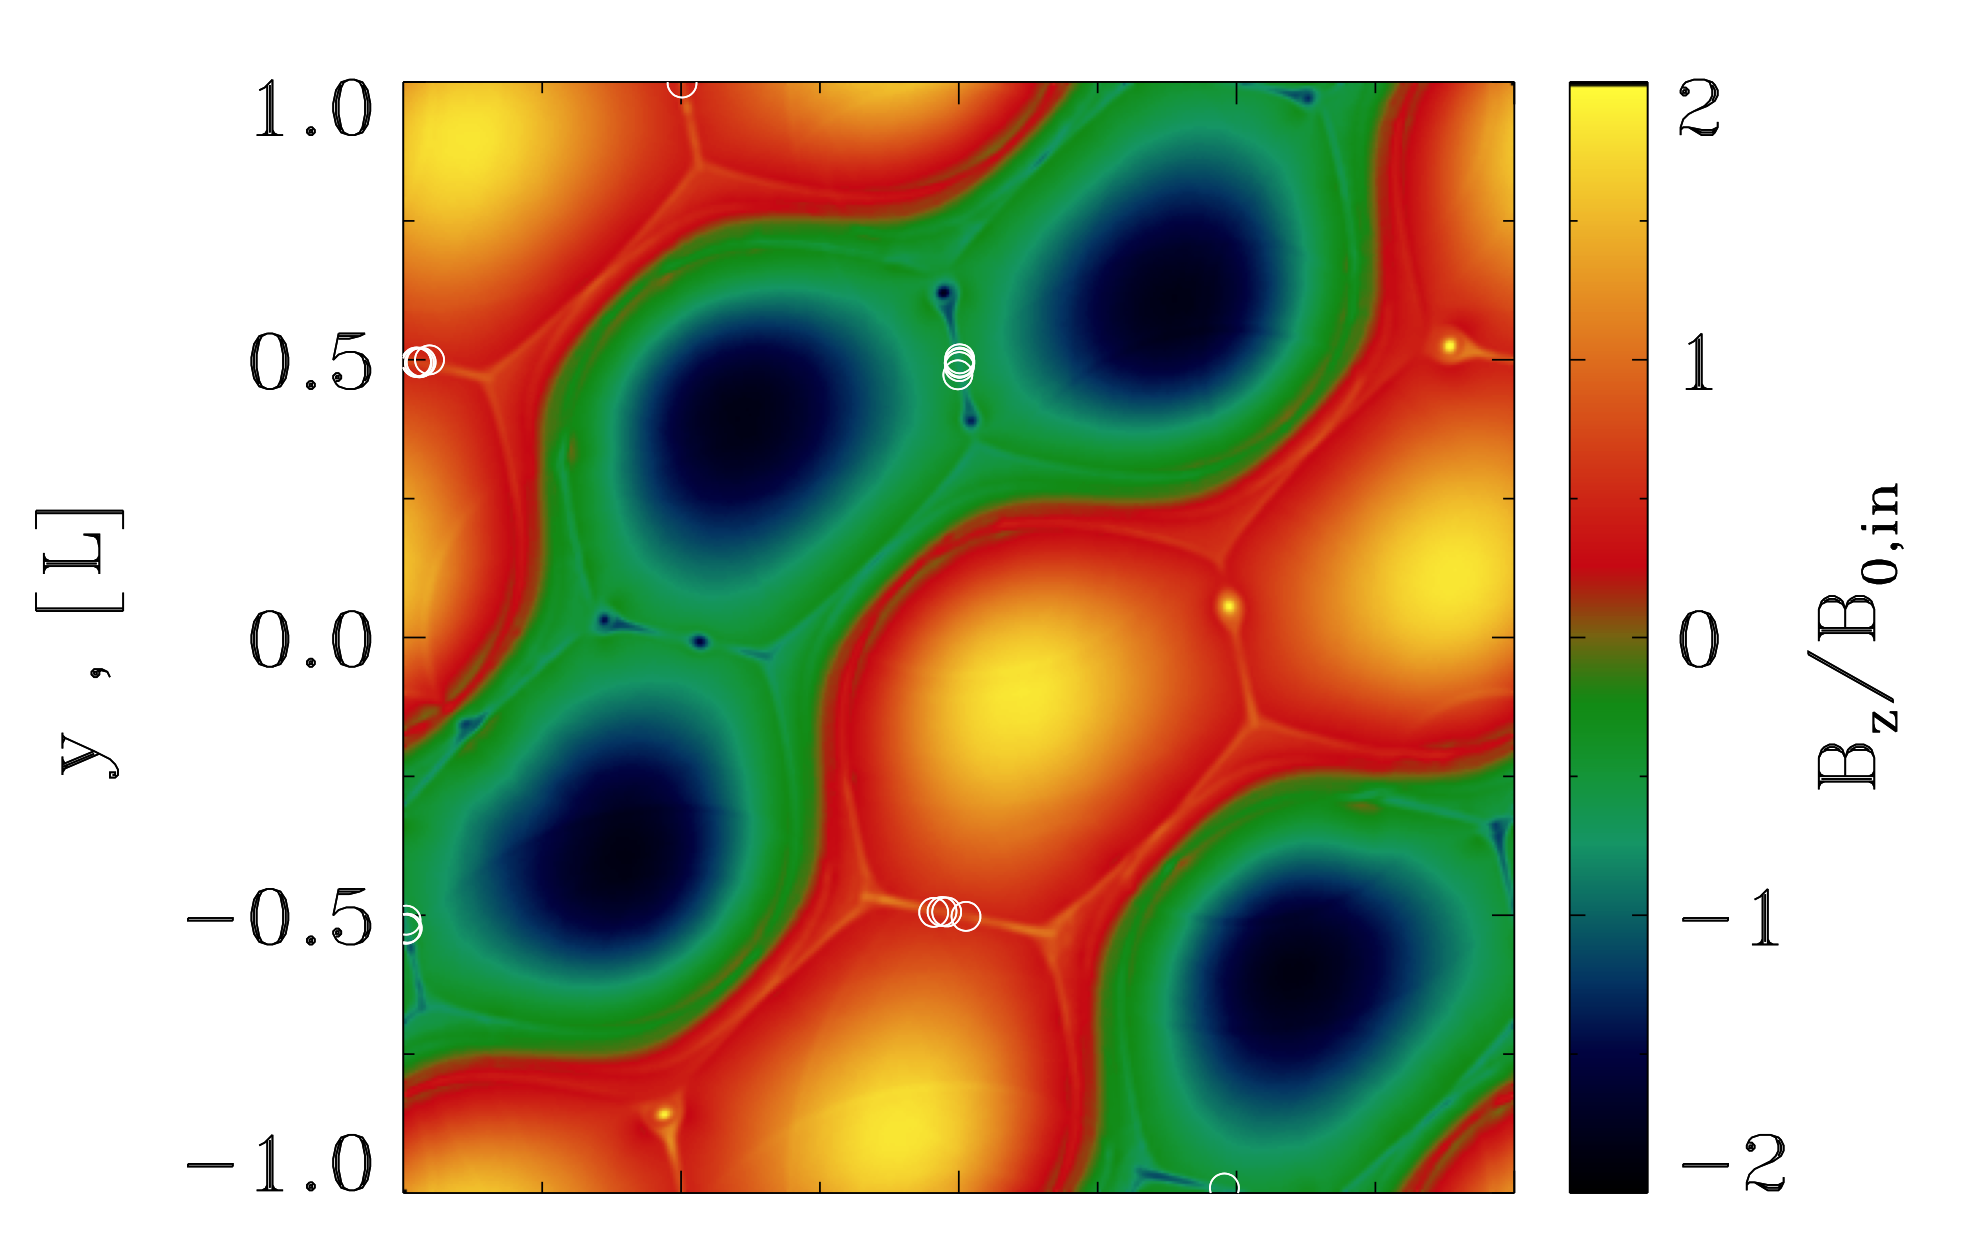
The configuration (2) is unstable, Fig. 4. The instability of the 2D ABC configuration is of the kind “parallel currents attract”. In the initial configuration the attraction of parallel currents is balanced by the repulsion of anti-parallel ones. Small amplitude fluctuations lead to fluctuating forces between the currents, that eventually lead to the disruption of the system. To identify the dominant instability mode let us consider a simplified model problem replacing each island by a solid tube carrying a given current. Such incompressible-type approximation is expected to be valid at early times, when the resulting motions are slow and the amount of the dissipated magnetic energy is small.
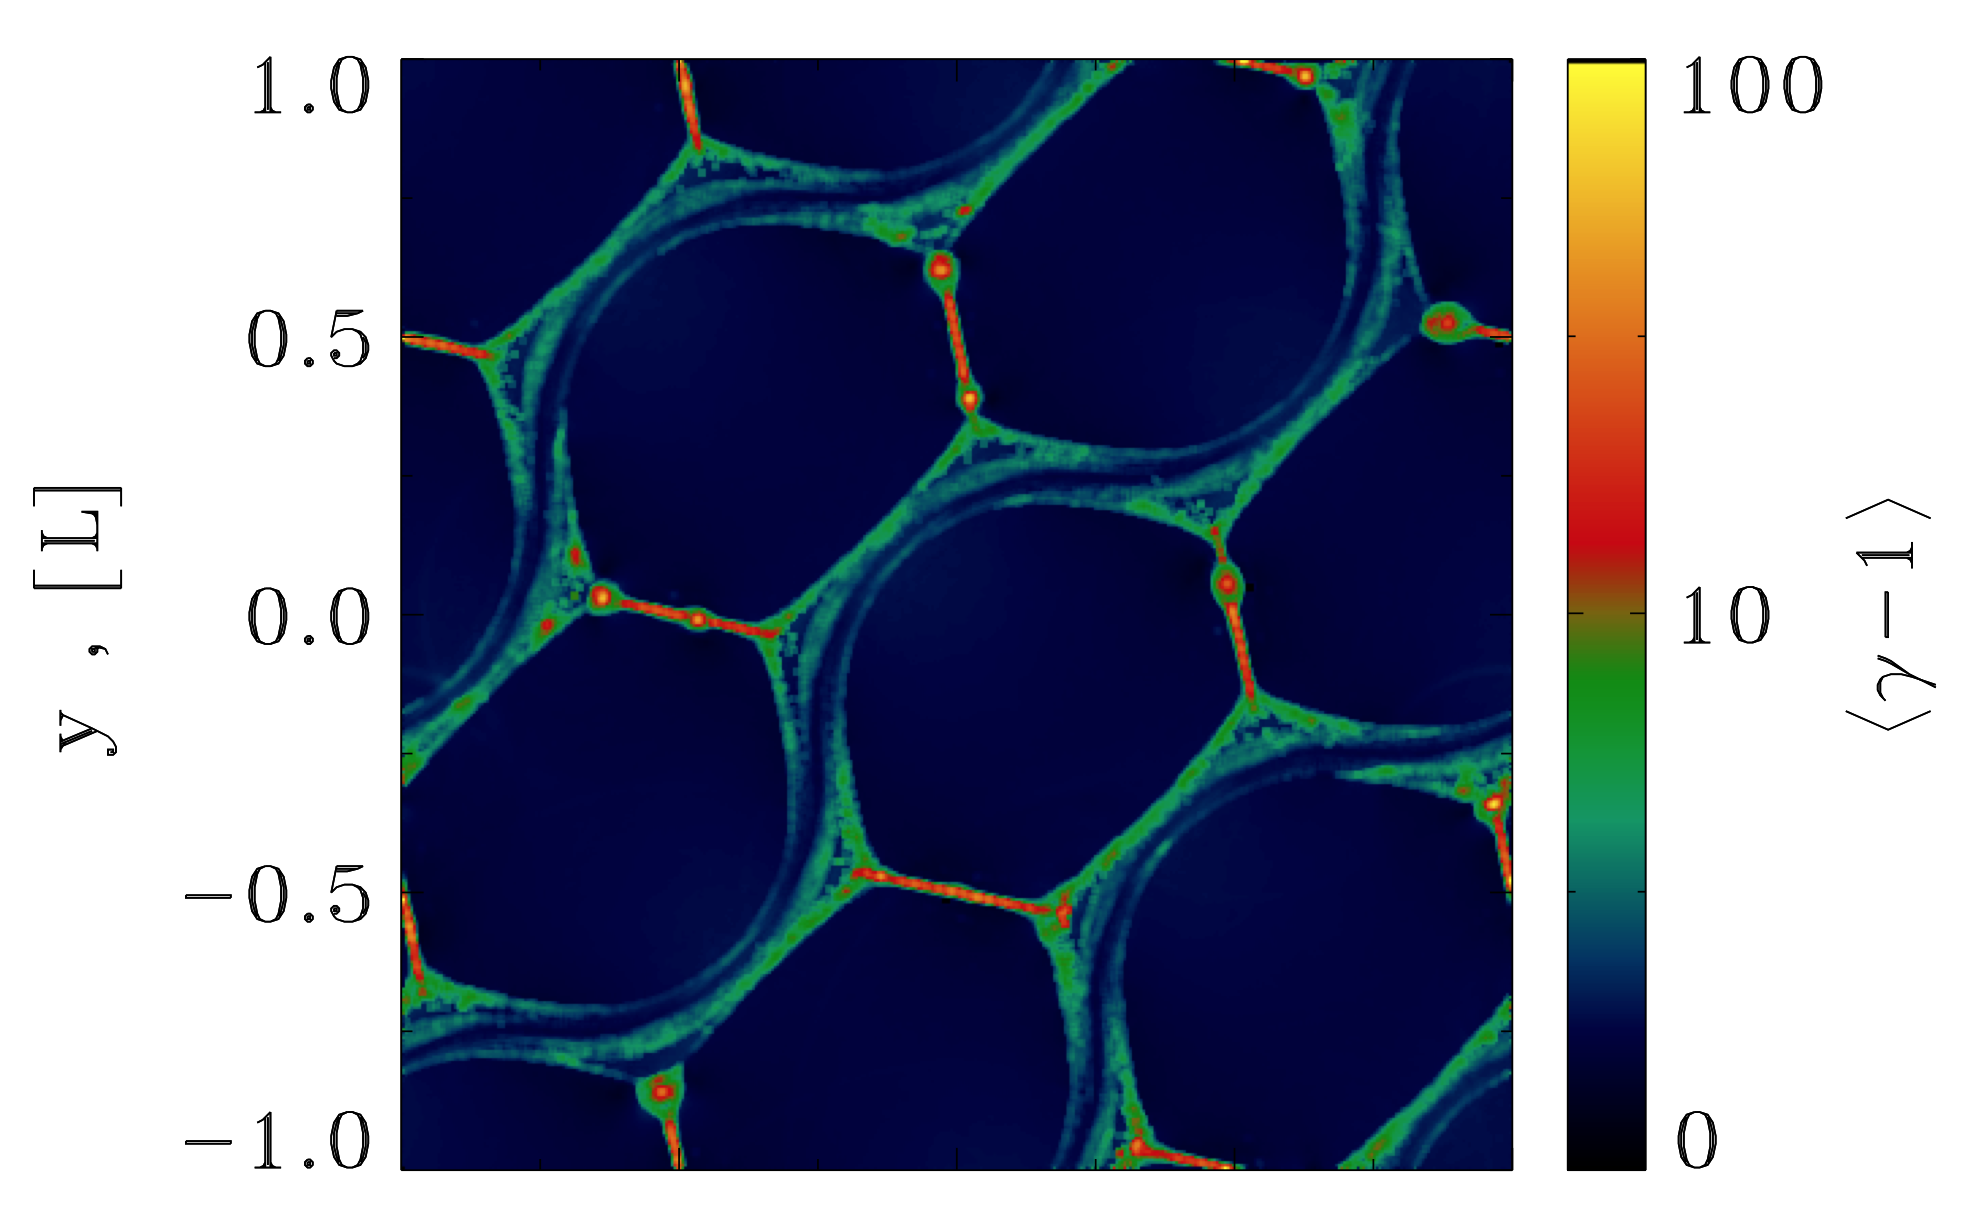
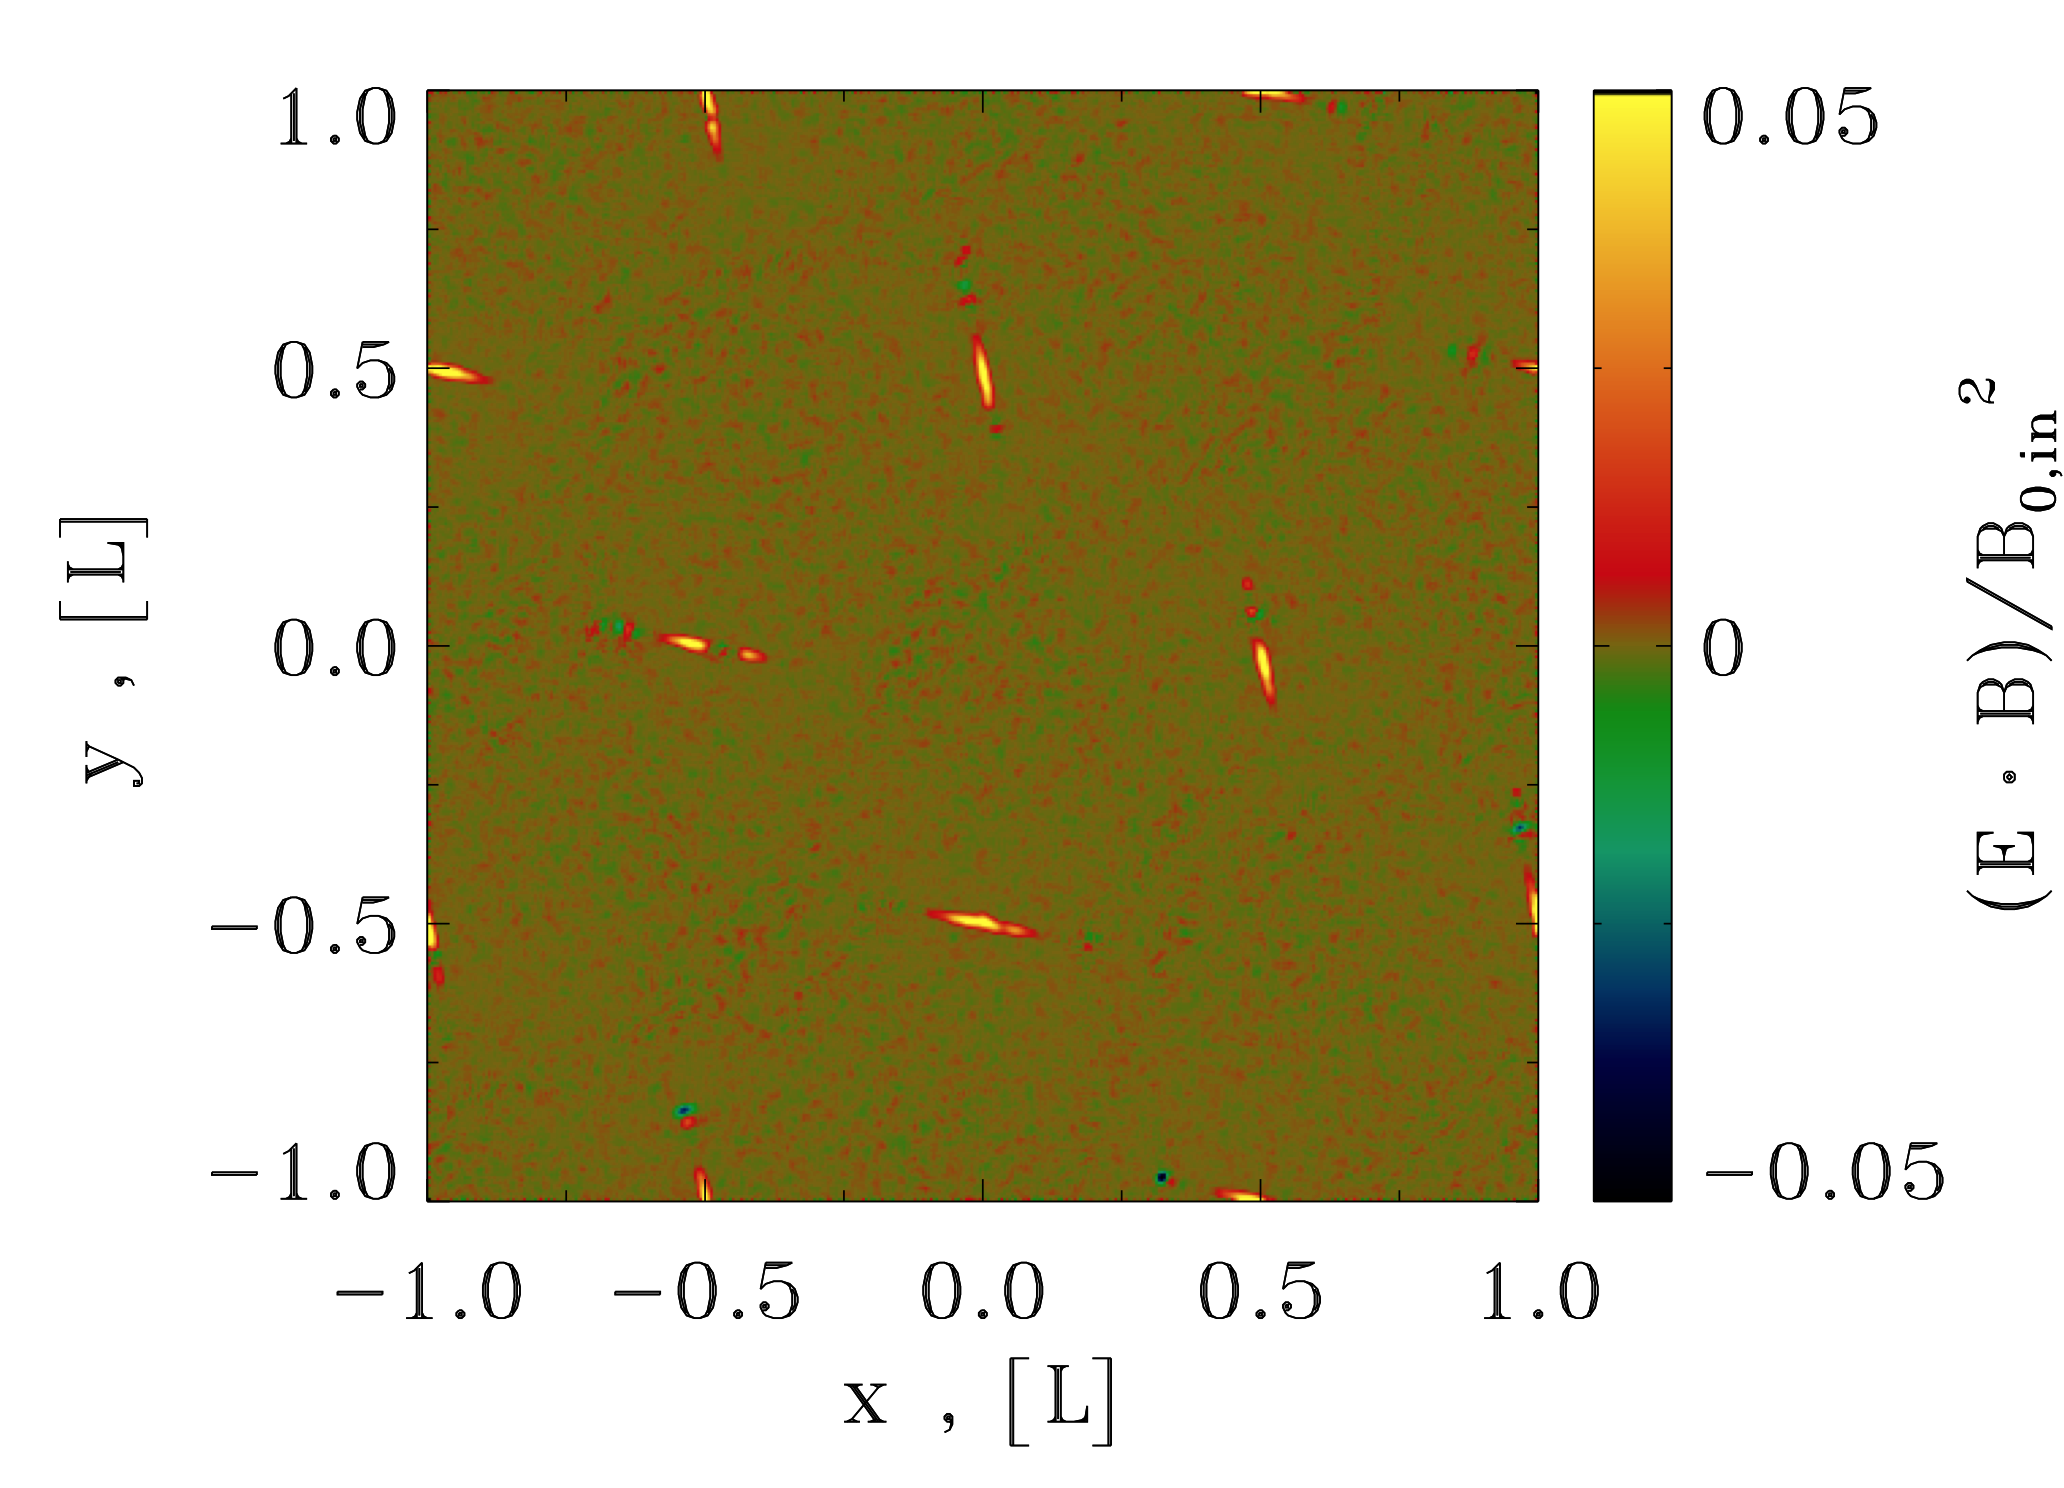
We identify two stages of particle acceleration: (i) fast explosive prompt X-point collapse and (ii) ensuing island merger. The fastest acceleration occurs during the initial catastrophic X-point collapse, with the reconnection electric field of the order of the magnetic field. During the X-point collapse particles are accelerated by charge-starved electric fields, which can reach (and even exceed) values of the local magnetic field. The explosive stage of reconnection produces non-thermal power-law tails with slopes that depend on the average magnetization . For plasma magnetization the spectrum power law index is ; in this case the maximal energy depends linearly on the size of the reconnecting islands. For higher magnetization, , the spectra are soft, , yet the maximal energy can still exceed the average magnetic energy per particle, , by orders of magnitude (if is not too close to unity). The X-point collapse stage is followed by magnetic island merger that dissipates a large fraction of the initial magnetic energy in a regime of forced magnetic reconnection, further accelerating the particles, but proceeds at a slower reconnection rate.
Our model of Crab flares has a number of key features, that are both required by observations and/or have not been previously explored.
-
Acceleration mechanism. We argued that the particles producing Crab flares are accelerated in explosive magnetic reconnection events. This is, arguably, the first solidly established case in high energy astrophysics of direct acceleration in reconnection events (as opposed to shock acceleration). In addition, since in our mode the maximal energy that particles can achieve grows with the size of the acceleration region, it is possible that smaller reconnection events are responsible for the acceleration of the majority of high-energy emitting particles in the Crab Nebula; shock acceleration does work - producing the Crab inner knot (Lyutikov et al., 2016a) - but it may be subdominant for the acceleration of high energy particles.
-
Location of flares. The flare-producing region is located at polar intermediate latitudes, between 10 and degrees, where the wind magnetization is expected to be high (the lower limit on the flare latitude comes from available required potential, while upper limit comes from modeling of the Crab inner knot Lyutikov et al. (2016a)). The sectors of the wind that eventually become the acceleration sites for flare particle have mild magnetization, . Magnetization first increases at the oblique termination shock and later in the bulk, during the deceleration of the mildly relativistic post-shock flow. As the flow decelerates to sub-relativistic velocities, large scale kink instabilities lead to formation of current-carrying flux tubes, Fig. 3.
-
Size of the accelerating region. In our model the acceleration occurs on macroscopic scales, not related to the plasma microscopic scales, like the skin depth. (Previous models of reconnection in Crab flares, e.g., Cerutti et al., 2012a, b, were based on the development of the tearing mode and achieved acceleration on scale related to the skin depth - there is not enough potential on scales of few skin depths to account for Crab flares.)
-
Relativistic beaming motion of the flare producing region. The peak frequency of flares, the energy and the energetics of flares all require mildly relativistic “bulk” motion of the flare producing particles, with few. This is achieved via “kinetic beaming”, and not through a genuine, fluid-like bulk motion of the lower energy component.)
This work was supported by NSF grant AST-1306672 and DoE grant DE-SC0016369.
References
- Abdo et al. (2011) Abdo, A. A., Ackermann, M., Ajello, M., et al. 2011, Science, 331, 739
- Amano & Kirk (2013) Amano, T., & Kirk, J. G. 2013, ApJ, 770, 18
- Buehler et al. (2012) Buehler, R., Scargle, J. D., Blandford, R. D., et al. 2012, ApJ, 749, 26
- Bühler & Blandford (2014) Bühler, R., & Blandford, R. 2014, Reports on Progress in Physics, 77, 066901
- Camus et al. (2009) Camus, N. F., Komissarov, S. S., Bucciantini, N., & Hughes, P. A. 2009, MNRAS, 400, 1241
- Cerutti et al. (2012a) Cerutti, B., Uzdensky, D. A., & Begelman, M. C. 2012a, ApJ, 746, 148
- Cerutti et al. (2012b) Cerutti, B., Werner, G. R., Uzdensky, D. A., & Begelman, M. C. 2012b, ApJ, 754, L33
- Clausen-Brown & Lyutikov (2012) Clausen-Brown, E., & Lyutikov, M. 2012, MNRAS, 426, 1374
- de Jager et al. (1996) de Jager, O. C., Harding, A. K., Michelson, P. F., et al. 1996, ApJ, 457, 253
- Hester et al. (1995) Hester, J. J., Scowen, P. A., Sankrit, R., et al. 1995, ApJ, 448, 240
- Hester et al. (2002) Hester, J. J., Mori, K., Burrows, D., et al. 2002, ApJ, 577, L49
- Kennel & Coroniti (1984) Kennel, C. F., & Coroniti, F. V. 1984, ApJ, 283, 694
- Komissarov (2013) Komissarov, S. S. 2013, MNRAS, 428, 2459
- Komissarov & Lyubarsky (2004) Komissarov, S. S., & Lyubarsky, Y. E. 2004, MNRAS, 349, 779
- Lang & Gingerich (1979) Lang, K. R., & Gingerich, O. 1979, A source book in astronomy and astrophysics, 1900-1975
- Lyubarsky (2002) Lyubarsky, Y. E. 2002, MNRAS, 329, L34
- Lyubarsky (2003) —. 2003, MNRAS, 345, 153
- Lyubarsky (2012) —. 2012, MNRAS, 427, 1497
- Lyutikov (2010) Lyutikov, M. 2010, MNRAS, 405, 1809
- Lyutikov et al. (2016a) Lyutikov, M., Komissarov, S. S., & Porth, O. 2016a, MNRAS, 456, 286
- Lyutikov & Lazarian (2013) Lyutikov, M., & Lazarian, A. 2013, Space Sci. Rev., 178, 459
- Lyutikov et al. (2016b) Lyutikov, M., Sironi, L., Komissarov, S., & Porth, O. 2016b, ArXiv e-prints
- Minkowski (1942) Minkowski, R. 1942, ApJ, 96, 199
- Parker (1983) Parker, E. N. 1983, ApJ, 264, 635
- Pétri & Lyubarsky (2007) Pétri, J., & Lyubarsky, Y. 2007, A&A, 473, 683
- Porth et al. (2014) Porth, O., Komissarov, S. S., & Keppens, R. 2014, MNRAS, 438, 278
- Rees & Gunn (1974) Rees, M. J., & Gunn, J. E. 1974, MNRAS, 167, 1
- Rudy et al. (2015) Rudy, A., Horns, D., DeLuca, A., et al. 2015, ApJ, 811, 24
- Sironi & Spitkovsky (2011) Sironi, L., & Spitkovsky, A. 2011, ApJ, 741, 39
- Tavani et al. (2011) Tavani, M., Bulgarelli, A., Vittorini, V., et al. 2011, Science, 331, 736
- Weisskopf et al. (2000) Weisskopf, M. C., Hester, J. J., Tennant, A. F., et al. 2000, ApJ, 536, L81
- Weisskopf et al. (2013) Weisskopf, M. C., Tennant, A. F., Arons, J., et al. 2013, ApJ, 765, 56