Site dilution in SrRuO3: Effects on structural and magnetic properties
Abstract
We have investigated the effect of site dilution with substitution of nonmagnetic element in SrRu1-xTixO3 ( 0.7). The nature of ferromagnetic state in SrRuO3 is believed to be of itinerant type with transition temperature 162 K. Crystallographically, SrRuO3 has a distorted orthorhombic structure. Substitution of Ti+4 (3) for Ru+4 (4), however, does not introduce significant structural modification due to their matching ionic radii. This substitution, on the other hand, is expected to tune the electronic correlation effect and the electron density in system. With Ti substitution, we find that magnetic moment and Curie temperature decreases but remains unchanged which has been attributed to opposite tuning of electron correlation effect and density of states within framework of itinerant ferromagnetism. The estimated critical exponent () related to magnetization implies a mean-field type of magnetic nature in SrRuO3. The value of further increases with which is understood from the dilution effect of magnetic lattice. The system evolves to exhibit Griffiths phase like behavior above which is usually realized in diluted ferromagnet following local moment model of magnetism. Our detail analysis of magnetization data indicates that magnetic state in SrRuO3 has contribution from both itinerant and local moment model of magnetism.
pacs:
75.47.Lx, 75.30.Cr, 75.40.Cx1 Introduction
Understanding the effect of disorder on ferromagnet (FM) is a long standing issue in condensed matter physics. Of particular interest is itinerant ferromagnet which is realized in the framework of Stoner criterion i.e., ) 1, where is the intra-site Coulomb repulsion or electronic correlation energy and ) is the density of states (DOS) at Fermi level.[1] In fact, based on the itinerant FMs are classified into weak and strong limit where the correlation effect is weak and strong, respectively. The prototype examples for weak itinerant FMs are ZrZn2,[2] Ni3Al,[3] etc. while Fe is a well known itinerant FM with strong correlation effect.[4] There are, however, many itinerant FMs where the strength of falls in intermediate range. Therefore, introducing disorder in form of chemical impurity, which is expected to tune either or both the and parameters, appears to be an effective route to understand the magnetism of original system.
The 4 based transition metal oxide SrRuO3 is a commonly believed itinerant FM which has shown many interesting properties.[5] Usually, 4 transition metals have an intermediate strength of and spin-orbit coupling (SOC) effect compared to its 3 and 5 counterparts which show prominent and SOC, respectively. The SrRuO3 crystallizes in orthorhombic symmetry with distorted perovskite structure (GdFeO3-type) where RuO6 octahedra exhibits both tilt and rotation.[6] In spite of large volume of studies, the nature of magnetism as well as strength of in this material remains highly debated. This material has long-range ferromagnetic transition temperature 162 K. However, the magnetic moment even measured in high magnetic field (1.4 /f.u.) turns out lower than its calculated spin-only value 2 /f.u.[6] Electrical transport data show throughout metallic behavior though there is slope change in resistivity around due to reduced spin fluctuation.[7] The x-ray photoemission spectroscopy (XPS) study reports is significantly weak in SrRuO3.[8] On the other hand, experimental studies, for instance, photoemission spectroscopy (PES),[10, 9] angle-resolved photo emission spectroscopy (ARPES),[11] optical spectroscopy [12] have shown non-negligible strength of which is in favor of local moment behavior. A recent band theory calculation employing combination of density functional theory (DFT) and dynamical mean-field theory (DMFT) has shown weak itinerant type FM behavior below and local residual magnetic moment behavior above , indicating a dual presence of weak itinerant and local moment behavior in SrRuO3.[13] With this picture, it is required to understand the nature of magnetism in SrRuO3 more clearly, and introducing the chemical impurity to tune ) and would be an efficient route in this regard. Recently, a drastic variation of with film thickness has been shown for SrRuO3 which has been attributed to the change in ) in ultrathin films of this material.[19]
In this study, we report an evolution of structural and magnetic properties in SrRu1-xTixO3 ( 0.7) where the substitution of nonmagnetic Ti+4 (3) for Ru+4 (4) amounts to dilution of magnetic network (Ru-O-Ru) in original system. There have been several experimental and theoretical studies[8, 10, 14, 15, 16, 17, 18] investigating transport and electronic properties in SrRu1-xTixO3 but the evolution magnetic properties has not been looked yet in details. The introduction of Ti+4, on other hand, is less likely to induce any major structural modification as both the elements have very close ionic radii (Ru+4 = 0.62 Åand Ti+4 = 0.605 Å). Following this substitution of Ti+4, one can expect an increase in and depletion of electrons in original system due to its 3 character. These changes in and will definitely influence the magnetic behavior according to itinerant model of FM. In fact, PES study has shown that along with a coherent peak there is a presence of incoherent peak below Fermi level in SrRuO3, which implies a presence of non-negligible .[10] This study further shows that, with increasing , the ratio between incoherent and coherent peaks increases and the DOS at Fermi level depletes. Band structure calculation employing GGA + U technique has also shown an increase of with Ti substitution.[17] On the other hand, following the picture of local spin model of FM the dilution of spin interaction along Ru-O-Ru bond would modify the as well as magnetic moment. This dilution may further induce Griffiths phase[20] behavior above as has been observed in Sr1-xCaxRuO3 where the dilution is realized due to suppression of Ru-O-Ru bond angle with Ca doping.[21]
Our studies show that original orthorhombic structure is retained with Ti substitution in SrRu1-xTixO3 ( up to 0.7) though structural parameters modify with . While the remains almost unchanged in this series, we find both magnetic moment and Curie temperature decrease with . For undoped SrRuO3, the critical exponent () related to magnetization shows value close to the mean-field model which increases with Ti reaching about 1 for highest doped sample ( = 0.7). Furthermore, the doped samples exhibit GP like behavior above where the behavior is prominently observed for 0.4. The analysis of thermal demagnetization data both itinerant and local-moment type of magnetism is present in SrRuO3.
2 Experimental Details
Polycrystalline samples of SrRu1-xTixO3 with = 0.0, 0.1, 0.2, 0.3, 0.4, 0.5 and 0.7 have been prepared using solid state route. The ingredient powder materials of SrCO3, RuO2 and TiO2 with phase purity greater than 99.99% (Sigma-Aldrich) are taken in stoichiometric ratio and ground well. The mixed powders are heated in air at 1000 oC for 24 h with for two times with an intermediate grinding. The calcined powders are then palletized and sintered at 1100oC and 1150oC for 36 h each time with an intermediate grinding. The phase purity of the samples is checked using powder x-ray diffraction (XRD) with a Rigaku MiniFlex diffractomer with CuKα radiation. The data have been collected in 2 range of 10-90o at a step of 0.02o. To understand the structural evolution in this series, XRD data have been analyzed with Rietveld refinement program. DC magnetization () measurement is done using superconducting quantum interference device (SQUID) magnetometer (Quantum Design).
3 Results and Discussions
3.1 Structural study
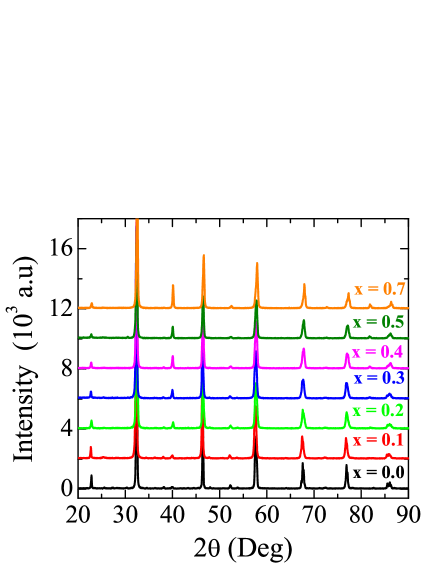
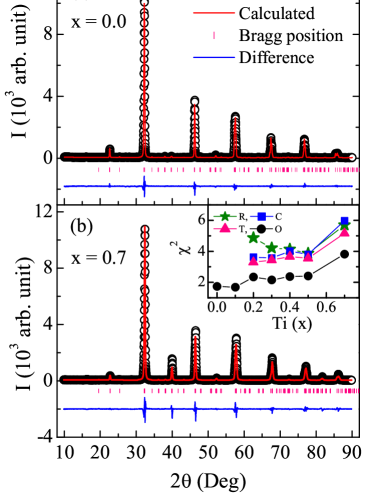
Fig. 1 shows room temperature XRD pattern for SrRu1-xTixO3 series with = 0.0, 0.1, 0.2, 0.3, 0.4, 0.5 and 0.7. The XRD pattern with diffraction peaks for the parent material ( = 0.0) matches well with the reported study.[21] With this substitution of Ti for Ru, major structural modification is not expected considering their matching ionic radii (Ru+4 = 0.62 Åand Ti+4 = 0.605 Å). Indeed, Fig. 1 shows XRD pattern does not modify significantly with except a peak at 2 40o, which is minimally present in = 0 compound, its intensity gradually increases with Ti. The XRD pattern has been analyzed using Rietveld refinement program.[22] Fig. 2 shows representative XRD data along with Rietveld refinement for two end members of this series i.e., = 0.0 and 0.7. The refinement shows material with = 0 (SrRuO3) crystallizes in orthorhombic structure with Pbnm symmetry (Fig. 2a). For the present SrRu1-xTixO3 series, earlier studies have shown different evolution of structural phase with increasing amount of Ti. For instance, Cuffini et al.[23] has shown that crystallographic structure changes from orthorhombic ( = 0) to cubic phase with between 0.4 and 0.5. Bianchi et al.[16] has shown that the system retains its orthorhombic structure till = 0.6 and above this it changes to tetragonal structure and finally changes to cubic structure for 0.7. Recently, Jang el al.[24] has reported a single-phase orthorhombic structure up to = 0.1, then double-phase structure (orthorhombic and cubic) till = 0.5 and after that a single-phase cubic structure for 0.5. A single-phase orthorhombic structure has also been shown for up to 0.6.[8]
For all the materials in present SrRu1-xTixO3 series with 0.7, we have tried to analyze the XRD data with all possible orthorhombic (Pbnm), tetragonal (I4/mcm), rhombohedral (Rc) and cubic (Pmm) structure using Rietveld refine program. For SrRuO3 (Fig. 2a), we find an orthorhombic structure with Pbnm symmetry which is in agreement with majority of earlier studies.[7, 6, 23, 16, 24] With Ti substitution ( up to 0.7), we find the same orthorhombic-Pbnm structure is the best fitted one for whole series. While it has been previously shown that there is a phase transition from orthorhombic structure to more symmetric tetragonal or cubic structure above in range of 0.5 or 0.7,[23, 16] but we observe that original orthorhombic structure continues to be the best fitted structural phase till = 0.7 in this series. For completeness, statistical goodness of fit, which is gauged by value in Rietveld refinement, has been given for whole series as found with orthorhombic, tetragonal, rhombohedral and cubic structure in inset of Fig. 2b. As evident in figure, Rietveld refinement with orthorhombic structure gives lowest value for whole series with up to 0.7. Fig. 2b displays XRD pattern with Rietveld refinement with orthorhombic-Pbnm structure for SrRu0.3Ti0.7O3 showing reasonably good fitting of data. Here it can be mentioned that where other studies have reported structural phase transition from original orthorhombic structure around 50 to 70% of Ti substitution in SrRu1-xTixO3 series,[23, 16] our results demonstrating continuity of orthorhombic structure till 70% of Ti concentration is in conformity with earlier results. Moreover, considering the matching ionic radii as well as ionic state of Ru and Ti, it is more likely that doped SrRu1-xTixO3 materials will produce single and homogeneous structural phase rather than a situation of phase coexistence.
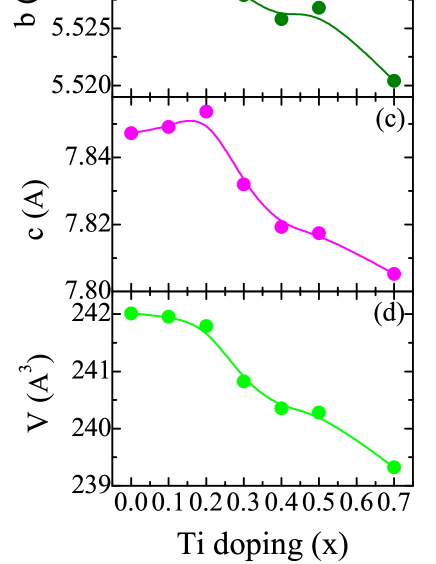
Fig. 3 shows composition dependent evolution of lattice parameters i.e., , , and volume related to orthorhombic-Pbnm phase for present SrRu1-xTixO3 series. It is seen in figure that lattice parameters as well as volume decrease with Ti concentration, except the parameter which initially increases with . The decrease of volume with Ti concentration can be explained with reduced ionic size of Ti4+ compared to Ru4+, and the similar behavior has also been observed by Cuffini et al.[23] As expected, Ti substitution has not occurred no major structural modification as for the maximum doped ( = 0.7) sample structural parameters (Fig. 3) modify only in range of (0.2 - 0.5)%.
3.2 Zero field cooled and field cooled magnetization data
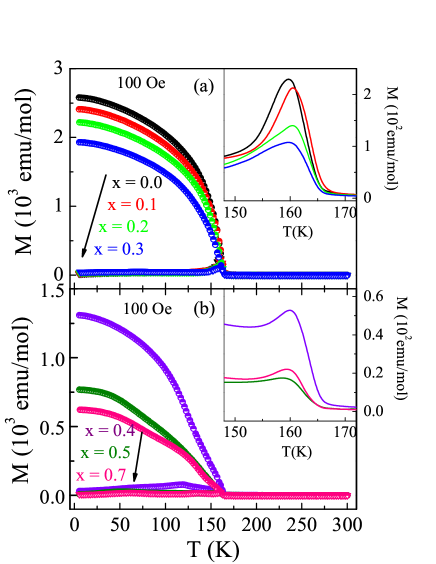
Temperature dependent magnetization data measured in 100 Oe magnetic field following zero field cooled (ZFC) and field cooled (FC) protocol for series SrRu1-xTixO3 have been shown in Fig. 4. The Fig. 4a shows for samples with = 0.0, 0.1, 0.2 and 0.3 and the Fig. 4b shows the same for = 0.4, 0.5, and 0.7. The inset of both the figures show ZFC magnetization data in limited temperature range. It is seen in Fig. 4a that ZFC and FC branches of magnetization data for parent compound with = 0.0 bifurcates at temperature 162 K. The inset of Fig. 4a shows for = 0.0 shows a peak around this temperature. The large bifurcation between and indicates the material SrRuO3 has large anisotropy.
With dilution of magnetic lattice in SrRuO3 by substitution of nonmagnetic Ti4+, the magnetization data in Fig. 4 is quite interesting. For samples with = 0.0, 0.1, 0.2 and 0.3, the bifurcation temperature between and as well as peak temperature in remains almost same though the value of decreases. The similar features are also observed for higher doped samples ( = 0.4, 0.5 and 0.7) as evident in Fig. 4b. We have made an estimate of for this series from an inflection point in (using d/dT plot) which is given in Table I as well as from fitting with Eq. 5 (discussed in section 3.4). It is rather intriguing that site dilution in terms of substitution of Ti4+ at Ru4+ site decreases the moment but the ferromagnetic ordering temperature appears to remain unchanged.
3.3 Thermal demagnetization study
To understand the magnetic nature of SrRuO3, we have analyzed the low temperature magnetization rather demagnetization data. Fig. 4 shows at low temperature continuously decreases with temperature. This thermal demagnetization can be explained both within scenario of localized as well as itinerant model of spin interaction. In localized model, the thermal demagnetization of occurs due to excitation of spin-wave (SW) where the magnetization decreases following Bloch law as;[31]
| (1) |
where is the magnetization at 0 K, and is the coefficients. The spin-wave stiffness constant can be calculated as;
| (2) |
where is the Boltzmann constant and is the density of material. On the other hand, in itinerant or band model of magnetism the origin of magnetization is considered to arise due to displacement between spin-up and spin-down sub-band. The thermal demagnetization in this model is explained with the excitation of electron from one sub-band to another one. For strong itinerant type of FM, where one sub-band is completely filled and another one is partially filled, the single-particle excitation or thermal demagnetization is described as;
| (3) |
where is the coefficient, is the Boltzmann constant and is the energy gap between the top of full sub-band and Fermi level. For the weak itinerant, where both the sub-bands are partially filled and have empty states at Fermi level, the single-particle excitation follows as;
| (4) |
where is the coefficient. However, it is possible to describe the nature of magnetism in a particular material using both localized and itinerant model simultaneously.
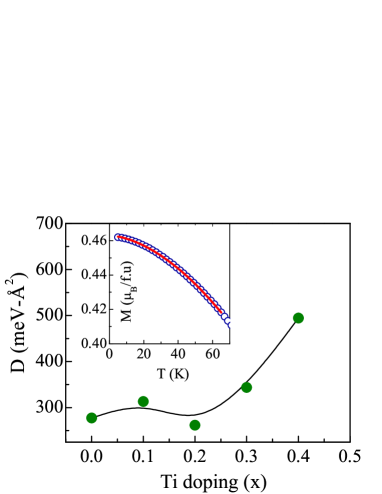
In an aim to understand the nature of magnetism vis--vis thermal demagnetization process in SrRu1-xTixO3, we have analyzed the data (Fig. 4) with the above discussed models. The fitting with only Eq. 1 for spin-wave model has not given good fitting. Regarding single-particle model, the Eq. 3 can not be a valid model for thermal demagnetization as the spin polarization for SrRuO3 is much lower than 100%.[32, 33] Similarly, Eq. 4 alone did not give good result. Therefore, we have tried to fit the magnetization data taking combination of Eq. 1 and 4. The inset of Fig. 5 shows data along with fitting with combination of Eq. 1 and 4 i.e., with = up to temperature range 0.4 for SrRuO3. We obtain fitting parameters as, M(0) = 0.463 /f.u., B = 9.0 10-5 K-3/2 and A = 1.17 10-5 K-2. These obtained values of coefficient and match well with the earlier reported values.[34] Using Eq. 2, we have calculated spin wave stiffness constant = 264.9 meV. Furthermore, exchange coupling constant () between nearest-neighbor magnetic atoms has been calculated to be 37.6 following = (0.0587/) where is the localized atomic spin.[31]
For the doped materials, we have analyzed demagnetization data and estimated stiffness constant following above mentioned procedure for up to 0.4. For the materials with 0.4, magnetic lattice is so diluted that analysis did not yield good result. The estimated has been shown in main panel of Fig. 5 which shows its value increases with . Given that remains constant and also the number of nearest neighbor magnetic atoms decreases with replacing magnetic Ru+4 by nonmagnetic Ti+4, this increase of is quite interesting. Though it needs further investigation, we explain this increase of primarily due to the fact that Ti severs the Ru-O-Ru magnetic channel for propagation of spin-waves, hence the stiffness constant value increases.
3.4 Nature of magnetic state and critical exponent for temperature dependent magnetization
The nature of magnetic interaction in FM is usually characterized by set of critical exponents associated with different universality classes.[28] This universality classes are decided by the dimensionality of lattice () and the dimensionality of spin system () where they do not depend on the microscopic details of the system. For present series of samples, we have extracted the the critical exponent , which is related with the temperature dependent magnetization near , and the critical temperature using following relation,
| (5) |
The inset of Fig. 6 shows representative fitting of data of SrRuO3 near (up to 0.8) using Eq. 5 where , and have been kept as free fitting parameters. This fitting gives exponent = 0.48(2) and = 161.2(3) K. This value of is very close to the theoretically predicted value (0.5) for mean-field spin interaction model. Moreover, this value is consistent with the other report showing spin interaction in SrRuO3 follows mean-field model.[29] The obtained is also close to the value estimated from temperature derivative of ZFC magnetization (Table I).
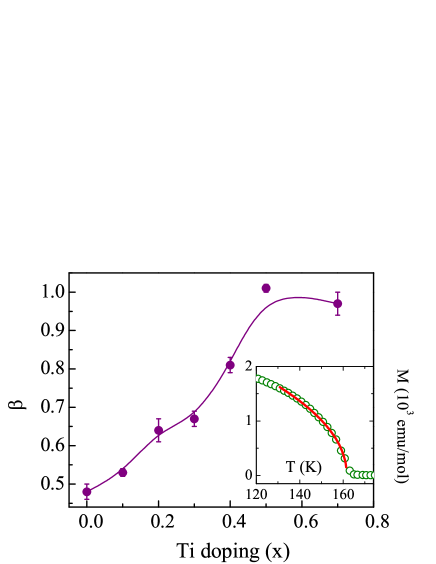
The main panel of Fig. 6 shows composition dependent evolution of . The figure shows that value of increases with Ti substitution reaching close to 1.0 in highest doped material ( = 0.7). These values of above 0.5, however, can not be ascribed to any of the known universality classes related to standard models. Nonetheless, this systematic evolution of exponent with Ti substitution is quite intriguing. The similar evolution of has also been observed for isovalent doped Sr1-xCaxRuO3.[29] In case of Sr1-xCaxRuO3, FM is weakened with Ca substitution and is completely suppressed at 0.7.[6, 29] For the doped materials, obtained from fitting with Eq. 5 even shows values remain close to that of parent material. The increase of exponent has been related to phase segregation between strongly coupled regimes surrounded by regimes with diluted FM spin-spin interaction.[29] This is supported by the fact that above in Sr1-xCaxRuO3 exhibit anomalous behavior showing Griffiths singularity which is characterized by preformed FM clusters in PM state.[21] It is worthy to note that with substitution of another isovalent ion Ba2+, which has higher ionic radii than Sr2+, in Sr1-xBaxRuO3 the exponent decreases and the end member BaRuO3 shows exponents in agreement with 3D Heisenberg interaction where shows conventional Curie-Weiss type behavior ( 60 K).[21, 30] In present SrRu1-xTixO3, however, site dilution by Ti substitution results in a situation where the ferromagnetically aligned clusters surrounded by nonmagnetic matrix evolves and the size of those clusters increasingly decreases with substitution. This is evident with in Fig. 5 where the GP behavior is strengthened with . It is interesting to see the similar type of evolution of critical exponent with the chemical substitution both at Sr- and Ru-site.
3.5 Griffiths phase behavior
Fig. 7 shows temperature dependence of inverse susceptibility [ = ] for the selected samples with = 0.0, 0.3, 0.4, 0.5 and 0.7 for SrRu1-xTixO3 series. The figure shows that shows fairly linear behavior at high temperature above following Curie-Weiss (CW) behavior (discussed later). However, the shows a sharp downfall immediately above for higher doped samples with 0.3 which indicates CW behavior is exactly not followed in this temperature regime. This sharp and sudden downfall in in the vicinity of is understood with the scenario of Griffiths phase (GP) behavior which is caused by phase inhomogeneity above .[20] The GP was originally discussed for the diluted Ising ferromagnet with random distribution of nearest-neighbor exchange constant and 0 having probability and 1-, respectively. It has been shown that for less than critical value , long-range FM ordering can not survive in the system. For 1 , system can have long-range magnetic ordering although transition temperature is lower than that of undiluted system. Conventionally, the is called the Griffiths temperature which is determined as the temperature where starts to deviate from linear behavior in high temperature PM state. The temperature range between and is called Griffiths phase regime where the system exhibit neither perfect FM ordering nor PM behavior. Rather, there exists ferromagnetically ordered finite size clusters embedded in PM background. Due to presence of clusters, magnetization shows nonanalytic behavior. As a result, susceptibility diverges which is demonstrated by sharp downturn in .[25, 26]
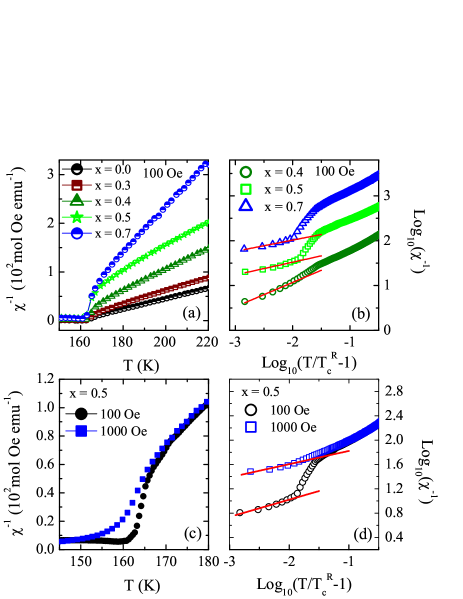
The data in Fig. 7a shows a sudden and sharp downturn immediately above for higher doped samples which is prominent for 0.3. This behavior qualitatively shows GP like behavior which is reinforced with site dilution. In a quantitative manner, Griffiths singularity is characterized by following relation;[27]
| (6) |
where is the exponent (0 1) and is the random critical temperature where the magnetic susceptibility tend to diverge. This Eq. 6 is a modified form of Curie-Weiss law for which = 0. The finite value of arises due to formation of FM clusters in PM regime, therefore, higher the value of stronger is the GP behavior. Fig. 7b shows plot of Eq. 6 for samples with = 0.4, 0.5 and 0.7 where the GP behavior is prominently observed in Fig. 7a. The straight lines in low temperature GP regime (Fig. 7b) are due to fitting following Eq. 6 which is an indicative of Griffiths singularity in these materials. These straight line fittings give values of exponent as 0.46, 0.72 and 0.75 and values of as 162.7, 160.8 and 161.3 K for = 0.4, 0.5 and 0.7, respectively. The obtained values are quite close to respective ( 163 K) of these three materials. The which is usually determined as an onset temperature for downturn in ,[26] interestingly, has been found to be 166.8 K for all the sampleṣ with = 0.4, 0.5 and 0.7, in that sense GP regime ( - ) is relatively narrow in present samples. The increasing value of exponent with implies GP behavior is strengthened with site dilution effect.
We have further examined the GP behavior in varying magnetic fields. Fig. 7c shows for representative = 0.5 sample in magnetic field 100 and 1000 Oe. It is seen in figure that downturn in across is reduced with increasing field. This can be explained as in higher fields the magnetic response from paramagnetic background becomes substantial to dominate over that from magnetic clusters. This leads to weakening of divergence of susceptibility and the tends to be linear. The similar behavior has also been observed in many other materials.[25, 26] Fig. 7d shows fitting of susceptibility data using Eq. 6 for = 0.5 sample with 100 and 1000 Oe magnetic field similar to Fig. 5b. From straight line fitting, we obtain exponent = 0.72 and 0.78, and = 160.8 and 161.4 K for field 100 and 1000 Oe, respectively. The values are close to its ( 163 K), and increase with magnetic field.
Here we mention that a close inspection in Fig. 7a reveals for parent SrRuO3 as well as for low doped samples ( up to 0.3) show a weak downturn across which becomes more prominent above = 0.3. While this downturn in for these low doped samples starts almost at same temperature of higher doped samples ( 170 K, see Table I), the fitting with Eq. 6 for data, however, does not give good result, probably due to weak nature of GP behavior. For this reason, we have not reported GP characteristic temperatures i.e., and for low doped samples in Table I. While is considered to be the FM ordering temperature of undiluted original system, the present ( 170 K) being slightly higher than the ( 163 K) of SrRuO3 is not unusual as many parent materials are seen to show GP behavior where the essential disorder is realized coming from structural disorder or ionic mismatch.[26] For SrRuO3, we observe very weak downturn in because measurements are done in very low field (100 Oe) but the measurements done in high field (10000 Oe) do not show such behavior,[21] as the effect of magnetic field on GP behavior is seen in Fig. 7c. The appearance of GP behavior in present series is quite intriguing as the original SrRuO3 is believed to be an itinerant type FM. However, signature of GP has been evidenced in isovalent doped Sr1-xCaxRuO3 which the authors have ascribed to the fact that suppression of Ru-O-Ru bond angle with Ca substitution dilutes FM interaction through Ru-O-Ru bonds, hence GP behavior is induced.[21] The GP picture is further supported by a recent band calculation using DFT and DMFT approach showing presence of both itinerant and local moment model of magnetism in SrRuO3, particularly local type magnetic moment persists above .[13] In this scenario, we believe that GP behavior arises as a consequence of site dilution which renders small size ferromagnetically aligned clusters above . The sizes of clusters are further reduced with Ti substitution which is evident from increasing value of exponent . Nonetheless, observed GP behavior brings out the local moment aspect of SrRuO3.
3.6 High temperature paramagnetic state and Curie-Weiss behavior
To understand the high temperature magnetic state, we have analyzed the magnetization data in terms of modified Curie-Weiss law;
| (7) |
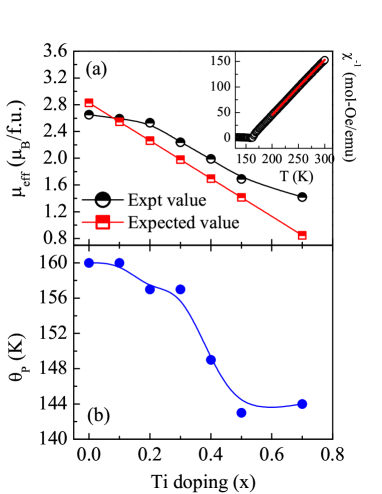
where is the magnetic susceptibility, is the temperature independent susceptibility, is the Curie constant and is the Curie temperature. The inset of Fig. 8a shows temperature dependence of inverse susceptibility for SrRuO3 in high temperature regime above . The rather shows linear behavior in PM state. The Eq. 7 has been fitted with data in temperature range between 200 to 300 K which is shown as line in figure. The reasonably good fitting suggests magnetic susceptibility follows Curie-Weiss behavior. The fitting yields = 2.56 10-4 emu mole-1 Oe-1, = 0.88 emu K mole-1 Oe-1 and = 160 K. Using this obtained Curie constant , the effective PM moment has been calculated to be 2.65 /f.u. This experimentally obtained value for is close to the expected value 2.83 /f.u which has been calculated for spin-only moment g with = 1. These values of and reasonably agree with other studies.[6, 8] We find Curie-Weiss behavior is followed for whole series of samples at high temperatures (Fig. 7a). Fig. 8a shows composition dependent both experimentally observed and expected values of for SrRu1-xTixO3 series. As evident in figure, both values of decreases with Ti substitution. While the expected value of decreases linearly the observed is not linear with . Interestingly, the observed is lower than the expected one for = 0, but it crosses over around = 0.1 and shows higher value with further increase of . This can be explained from preformed FM clusters above giving a higher value of which is also corroborated with the GP behavior as seen in Fig. 7. The value (160 K) of for SrRuO3 turns out to be close to the bifurcation temperature (162 K) between and (Fig. 4). Moreover, the positive value of shows spin interaction is of ferromagnetic in nature. The as a function of Ti concentration is plotted in Fig. 8b which shows does not decrease significantly and remains positive with up to 0.7. This underlines the fact that though FM ordering is weakened but it survives with nonmagnetic Ti+4 substitution as high as 70% which is in sharp contrast with isovalent doped Sr1-xCaxRuO3 where FM ceases to exist beyond 70% of Ca doping.[6]
3.7 Magnetic field dependent magnetization study
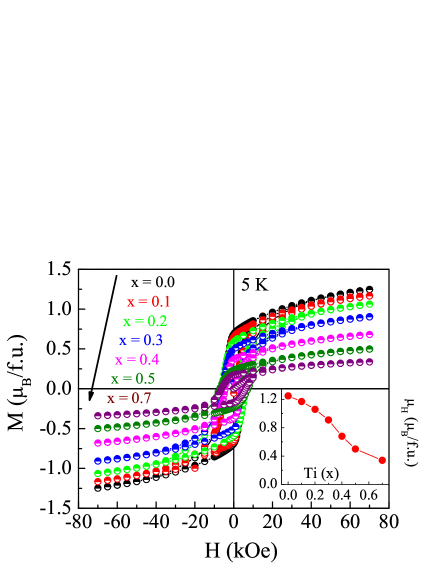
The magnetic field dependent magnetization data collected at 5 K up to field 70 kOe have been shown in Fig 9. The undoped material SrRuO3 shows a large hysteresis with coercive field 4800 Oe which matches with previous data.[34] At 70 kOe, the data, however, do not saturate and continue to increase with smaller slope. At 70 kOe, we get moment about 1.25 /f.u. which turns out smaller than the spin-only expected value 2 /f.u. for total spin = 1. Here, it can be mentioned that moment in SrRuO3 does not attain its expected full value in magnetic field as high as 30 Tesla.[6] This low value of moment is believed to arise due to itinerant magnetic character of SrRuO3. With increasingly substitution of Ti, the moment decreases (inset of Fig. 9) though not linearly as expected from site dilution with nonmagnetic atom.
3.8 Analysis of Arrott plot and spontaneous magnetization
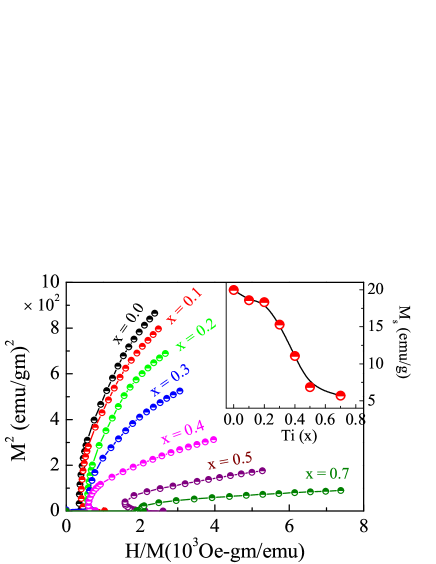
We have further analyzed the data in terms of Arrott plot which is plotting of vs .[35] The intercept of the slope in Arrott plot, which basically gives moment at = 0 and amounts to spontaneous moment (), is very useful to understand the magnetic nature of a material. While negative intercept implies a non-ferromagnetic nature the positive value of intercept straightforwardly shows a ferromagnetic nature of material. Fig. 10 shows Arrott plot of data taken at 5 K for whole series. As evident in figure, intercept of slopes taken in high field regime gives positive values for all the samples which suggests ferromagnetic ordering survives till highest concentration of Ti substitution (70 %). Inset of Fig. 10 shows estimated against material composition () showing decreases with Ti following similar trend of in Fig. 9.
Now we check the Rhodes-Wohlfarth criterion[36] which is usually used to distinguish between the localized and itinerant model of magnetization based on number of magnetic carriers per atom and . The is estimated from effective PM moment following = , where is the effective spin per atom giving = . The is obtained from low temperature saturation moment which is basically equals to . In case of localized moment, or is realized from fully aligned moment, hence / 1. For itinerant magnetism, is always lower than the fully aligned moment which results in / 1. We calculate (from Fig. 8a) and (from Fig. 9) to be 1.82 and 1.25, respectively giving / ratio 1.46. This ratio being higher than 1 obviously implies itinerant nature of magnetism in SrRuO3, though based on all other studies it is inferred that magnetic state in SrRuO3 is best explained by both itinerant and localized model of magnetism.
3.9 Behavior of transition temperature with site dilution
So far we have seen that SrRuO3 has both itinerant and local type of magnetism. With Ti substitution, magnetic moment and Curie temperature decreases but surprisingly is found remain unchanged. In following table we have given characteristic temperatures of present series.
-
Samples () (K) (K) (K) 0.0 162.7 0.1 162.6 0.2 162.9 0.3 162.6 0.4 162.6 162.7 170.6 0.5 162.9 160.7 169.4 0.7 162.9 161.3 169.9
Following local moment model the magnetic moment, and are subjected to site dilution as it will weaken the FM state.[31] In itinerant magnetism model, shows following functional dependence,
| (8) |
In present series of SrRu1-xTixO3 materials, the replacement of Ru+4 (4) by Ti+4 (3) is expected to strengthen and weaken owing to its 3 character. Indeed, depletion of and an increase of has been theoretically calculated and experimentally verified by using photoemission spectroscopy and x-ray absorption spectroscopy with an increase in Ti substitution.[17, 10] We speculate that these opposite changes of and will keep the term in Eq. 8 nearly constant which has resulted in without modification. While some of the experimental results such as, Curie-Weiss behavior, Griffiths phase behavior, spin-wave excitation can be explained with local model magnetism on the other hand, the low moment, single-particle excitation and unmodified can be understood form itinerant aspect magnetism in SrRuO3. The findings in our present work are in conformity with recent theoretical calculations.[13] We hope that our results will inspire further theoretical and experimental investigations using different kind of doping elements to understand this intriguing physics of itinerant ferromagnetism.
4 Conclusion
In summary, polycrystalline samples of SrRu1-xTixO3 series with up to 0.7 have been prepared to understand the effect of site dilution on structural and magnetic properties. The parent material SrRuO3 crystallizes in orthorhombic-Pbnm structure having GdFeO3 type crystallographic distortion where RuO6 octahedra exhibits both tilt and rotation. With progressive Ti substitution, structural symmetry is retained though an evolution of structural parameters have been observed. Magnetic moment and Curie temperature () are observed to decrease with this dilution work. However, long-range magnetic ordering temperature remains unchanged which is understood from the opposite tuning of electron correlation effect and DOS with Ti substitution within model of itinerant magnetism. The estimated critical exponent (0.48) shows nature of magnetism in SrRuO3 is of mean-field type, and increase of with has been ascribed to development of FM clusters with Ti substitution. Interestingly, similar to isovalent doped Sr1-xCaxRuO3, these materials exhibit Griffiths phase like behavior in higher doped samples which is again believed to arise from clustering effect above and represents the local moment picture of magnetism in SrRuO3. Analysis of low temperature thermal demagnetization data is in favor of dual presence of itinerant and local moment in SrRuO3 in conformity with recent theoretical calculation.
5 Acknowledgment
We acknowledge UGC-DAE CSR, Indore and Alok Banerjee for the magnetization measurements. We are thankful to Kranti Kumar for the help in magnetization measurements. RG acknowledges UGC, India for BSR fellowship.
References
References
- [1] Moriya T 1985 Spin Fluctuations in Itinerant Electron Magnetism, Springer, Berlin
- [2] Wohlfarth E P 1968 J. Appl. Phys. 39, 1061
- [3] de Boer F R, Schinkel C J, Biesterbos J and Proost S 1969 J. Appl. Phys. 40, 1049
- [4] Uhl M and ubler J K 1996 Phys. Rev. Lett. 77, 334
- [5] Koster G, Klein L, Siemons W, Rijnders G, Dodge J S, Eom C B, Blank D H A and Beasley M R 2012 Rev. Mod. Phys. 84, 253
- [6] Cao G, McCall S, Shepard M, Crow J E and Guertin R P 1997 Phys. Rev. B 56, 321
- [7] Allen P B, Berger H, Chauvet O, Forro L, Jarlborg T, Junod A, Revaz B, Santi G 1996 Phys. Rev. B 53, 4393
- [8] Maiti K and Singh R S 2005 Phys. Rev. B 71, 161102
- [9] Takizawa M, Toyota D, Wadati H, Chikamatsu A, Kumigashira H, Fujimori A, Oshima M, Fang Z, Lippmaa M, Kawasaki M and Koinuma H 2005 Phys. Rev. B 72, 060404
- [10] Kim J, Kim J Y, Park B G and Oh S J 2006 Phys. Rev. B 73, 235109
- [11] Shai D E, Adamo C, Shen D W, Brooks C M, Harter J W, Monkman E J, Burganov B, Schlom D G and Shen K M 2013 Phys. Rev. Lett. 110, 087004
- [12] Jeong D W, Choi H C, Kim C H, Chang S H, Sohn C H, Park H J, Kang T D, Cho D Y, Baek S H, Eom C B, Shim J H, Yu J, Kim K W, Moon S J and Noh T W 2013 Phys. Rev. Lett. 110, 247202
- [13] Kim M and Min B I 2015 Phys. Rev. B. 91, 205116
- [14] Kim K W, Lee J S, Noh T W, Lee S R and Char K 2005 Phys. Rev. B 71, 125104
- [15] Maiti K 2008 Phys. Rev. B 77, 212407
- [16] Bianchi R F, Carrio J A G, Cuffini S L, Mascarenhas Y P and Faria R M 2000 Phys. Rev. B. 62, 10 785
- [17] Lin Pao-An, Jeng Horng-Tay and Hsue Chen-Shiung 2008 Phys. Rev. B 77, 085118
- [18] Abbate M, Guevara J A, Cuffini S L, Mascarenhas Y P and Morikawa E 2002 Eur. Phys. J. B 25, 203
- [19] Chang Y J, Kim C H, Phark S H, Kim Y S, Yu J and Noh T W 2009 Phys. Rev. Lett. 103, 057201
- [20] Griffiths R B 1969 Phys. Rev. Lett. 23, 17
- [21] Jin C Q, Zhou J S, Goodenough J B, Liu Q Q, Zhao J G, Yang L X, Yu Y, Yu R C, Katsura T, Shatskiy A and Ito E 2008, Proc. Natl. Acad. Sci. USA 105, 7115
- [22] Young R A, Sakthivel A, Moss T S and Paiva-Santos C O 1994, Users Guide to Program DBWS-941, Georgia Institute of Technology, Atlant
- [23] Cuffini S L, Macagno V A and Carbonio R E 1993 J. Solid State Chem. 105, 161-170
- [24] Jang H, Brendt J, Patro L N, Martin M and Ill Yoo H 2014 Phys. Rev. B. 89, 144107
- [25] Magen C, Algarabel P A, Morellon L, Arajo J P, Ritter C, Ibarra M R, Pereira A M and Sousa J B 2006 Phys. Rev. Lett. 96, 167201
- [26] Pramanik A K and Banerjee A 2010 Phys. Rev. B 81, 024431
- [27] Castro Neto A H, Castilla G and Jones B A 1998 Phys. Rev. Lett. 81, 3531
- [28] Stanley H E 1971 Introduction to Phase Transitions and Critical Phenomena, Oxford University Press
- [29] Fuchs D, Wissinger M, Schmalian J, Huang C L, Fromknecht R, Schneider R and Lohneysen H v 2014 Phys. Rev. B. 89, 174405
- [30] Zhou J S, Matsubayashi K, Uwatoko Y, Jin C Q, Cheng J G, Goodenough J B, Liu Q Q, Katsura T, Shatskiy A and Ito E 2008 Phys. Rev. Lett. 101, 077206
- [31] Kittel C 2012 Introduction to Solid State Physics Wiley, New Delhi
- [32] Nadgorny B, Osofsky M S, Singh D J, Woods G T, Soulen Jr. R J, Lee M K, Bu S D and Eom C B 2003 Appl. Phys. Lett. 82, 427
- [33] Raychaudhuri P, Mackenzie A P, Reiner J W and Beasley M R 2003 Phys. Rev. B 67, 020411
- [34] Sow C, Samal D, Anil Kumar P S, Bera A K, and Yusuf S M 2012 Phys. Rev. B 85, 224426
- [35] Arrott A 1957 Phys. Rev. 108, 1394
- [36] Rhodes P and Wohlfarth E P 1963 Proc. R. Soc. London 273, 247