Dissimilar Symmetric Word Pairs in the Human Genome
Abstract
In this work we explore the dissimilarity between symmetric word pairs, by comparing the inter-word distance distribution of a word to that of its reversed complement. We propose a new measure of dissimilarity between such distributions. Since symmetric pairs with different patterns could point to evolutionary features, we search for the pairs with the most dissimilar behaviour. We focus our study on the complete human genome and its repeat-masked version.
Keywords:
inter-word distance, reversed complements, dissimilarity measure, human genome.1 Introduction
Chargaff’s second parity rule states that within a single strand of DNA the number of complementary nucleotides is similar [6]. An extension of this rule says that the frequency of an oligonucleotide should be similar to that of its reversed complement (the word obtained by reversing its letters and interchanging – and –). This phenomenon is known as single strand symmetry. Several authors discuss the prevalence of Chargaff’s second parity rule (e.g., [1, 2, 3, 4]). Various lines of research are being explored in an attempt to explain its cause. One approach postulates that the phenomenon would be an original feature of the primordial genome, the most primitive nucleic acid genome, and the maintenance of strand symmetry would rely on evolution mechanisms [10].
The similarity between the number of occurrences of symmetric word pairs in one strand of DNA can be verified using frequency analysis. However, two words with the same frequency in a sequence may exhibit very distinct distributions along that sequence. This leads to the natural question how both words are distributed along the DNA sequence. Are their distributions similar?
If we constrain a random generator of sequences to respect single strand symmetry (e.g., using a high-order Markov process), it is expected that the distance distribution of a word be similar to that of its reversed complement. A reasonable hypothesis is that the distance distribution of symmetric pairs should usually be similar, and that strong deviations may have a biological origin.
As the word length increases, more unexpected patterns may be observed in the inter-word distance distributions, which may result in increased dissimilarity between symmetric pairs. The similarity between distance distributions of symmetric word pairs of length was studied in [9]. For such short words the dissimilarity between symmetric pairs was basically negligible.
This work focuses on the dissimilarity between distance distributions of symmetric pairs of length in the human genome. We propose a new dissimilarity measure between such distributions, based on the gap between the locations of their peaks and the difference between the sizes of these peaks.
The paper is organized as follows. In Section 2 we introduce a new dissimilarity measure between distributions based on their peaks. Section 3 then identifies and investigates the symmetric word pairs with the most dissimilar distance distributions, and Section 4 concludes.
2 Methods
2.1 Materials
In this study, we used the complete genome assembly (GRCh38.p2) downloaded from the website of the National Center for Biotechnology Information. We also investigate how well our results hold up in a masked sequence, which excludes major known classes of repeats [7]. We used pre-masked data, available from UCSG Genome Browser (http://genome.ucsc.edu/index.html), in witch the repeats determined by Repeat Masker [8] and Tandem Repeats Finder [5] are replaced by N’s. The chromosomes were processed as separate sequences and non-ACGT symbols were used as sequence separators. Distance distributions of words were generated using the C language. To compute the dissimilarity measures and perform the statistical analysis, the R language was used.
2.2 Inter-word distance distribution
A genomic word (or oligonucleotide) is a subsequence in the nucleotide alphabet . Words of length are elements of . The inter-word distance sequences are defined as the lags between the positions of the first symbol of consecutive occurrences of that word. For instance, in the DNA segment , the inter- distance sequence is .
The inter- distance distribution (or simply distance distribution of ) gives the relative frequency of each inter- distance and is denoted by .
2.3 Dissimilarity Measure
The distance distributions may present several peaks, i.e., distances with frequencies much higher than the global tendency of the distribution. In general, the strongest peaks occur at short distances, whereas peaks at longer distances have lower frequencies. Looking only for the highest frequencies would not capture such local maxima. In what follows we will take that effect into account.
2.3.1 Identifying peaks.
To determine peaks we slide a window of fixed width along the domain of the distribution. In each such interval of width we average the absolute values of the differences between successive frequencies, and call the result the (average) size of the peak on that interval. The peak’s location is defined as the midpoint of the interval. The strongest peak is then determined by the interval with the highest size. For the second strongest peak we only consider intervals that do not overlap with the first one, and so on.
2.3.2 Dissimilarity between peaks.
To measure the dissimilarity between two peaks and of the same distribution we consider the difference between their sizes and between their locations. We will use the following measure:
| (1) |
where denotes the location and denotes the size of peak (and similarly for ). Note that we standardize by the range of the domain of the distribution, and by the size of its strongest peak. In general, the dissimilarity given by equation (1) increases with both the location difference and the size difference. If the peaks have the same location the dissimilarity is reduced to a relative size difference , and if they have the same size it is reduced to a relative location difference . When equation (1) becomes 0, and in general it takes values between 0 and 3.
Now consider two different words and and let and be their distance distributions, defined on the same domain with length . Let and be peaks in each. To measure the dissimilarity between these peaks we propose to use
| (2) |
where and are the highest peak sizes observed in each distribution. The denominator yields a high dissimilarity when one distribution has strong peaks and the other doesn’t.
2.3.3 Dissimilarity between distributions.
To measure the dissimilarity between two distributions we compare their strongest peaks, for fixed . We propose
| (3) |
where denotes the set of permutations of elements. The proposed measure (3) depends on , the number of peaks considered, and on the bandwidth used in the peak search. Note that (3) is a semimetric too.
3 Results and Discussion
There are =16384 distinct genomic words of length , corresponding to 8192 symmetric word pairs. We restrict our distance distributions from to 1000 (some distances from 1 to may be absent due to the word structure). The dissimilarity measure (3) between distance distributions is computed with bandwidth and the strongest peaks (for we obtained similar results in much higher computation time).
Some words of length have a distance distribution with low total absolute frequency , so in our analysis we exclude symmetric pairs in which at least one word has below the first quartile of .
3.1 Complete Genome Assembly
In the complete genome this first quartile is 1498, so we exclude the symmetric pairs with (see table 1) and measure the dissimilarity (3) in the remaining 6054 symmetric pairs. Let be the set formed by these 6054 dissimilarity values.
We then automatically select the symmetric pairs with dissimilarity under 0.129, the percentile of , and those above 12.638, its percentile.
| complete sequence | masked sequence | ||||||||||
|---|---|---|---|---|---|---|---|---|---|---|---|
| all pairs | 6054 pairs | all pairs | 6075 pairs | ||||||||
| Min | 10 | 1.000 | 0.003 | 1.000 | 3 | 1.000 | 0.032 | 1.000 | |||
| Q1 | 1498 | 1.012 | 0.350 | 1.009 | 546 | 1.015 | 0.507 | 1.011 | |||
| Med | 11850 | 1.037 | 0.915 | 1.022 | 2771 | 1.039 | 0.832 | 1.026 | |||
| Q3 | 28510 | 1.165 | 2.936 | 1.075 | 6265 | 1.112 | 1.471 | 1.055 | |||
| Max | 927376 | 86.74 | 178.7 | 83.29 | 277460 | 14.64 | 21.19 | 2.041 | |||
The symmetric pairs with low values of (3) have very similar distributions. For some words this dissimilarity is surprisingly low in spite of their distributions having some strong peaks, which are almost the same in the distribution of their reversed complement, as illustrated in Figure 1(a)–(d). This also suggests that the dissimilarity measure (3) achieves its intended purpose.
The symmetric pairs with high dissimilarity are usually formed by one distribution with strong peak(s) and another displaying low variability or small peaks. Figures 1(e)–(f) show the distance distributions for two symmetric pairs discovered by our procedure. Especially the distance pattern of is noteworthy. It shows several peaks whose size goes up, which is a very unusual behavior in distance distributions between words.
(a)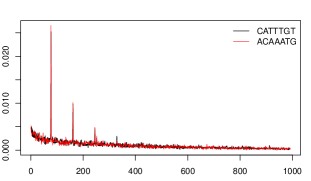 (b)
(b)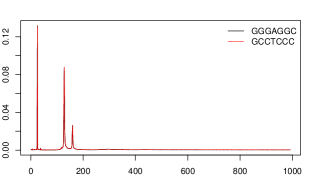 (c)
(c)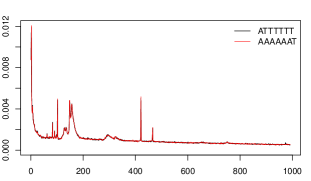 (d)
(d) (e)
(e)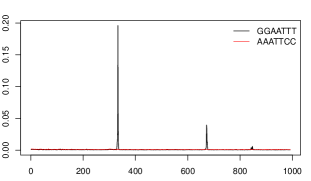 (f)
(f)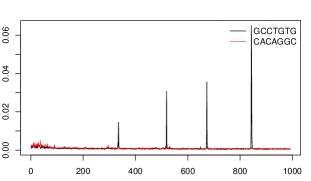
3.2 Masked Genome Assembly
To reduce the effect of repetitive sequences in the original genome assembly, we also analyse a masked version of the genome. All distributions and measures in this subsection are from the masked sequence.
Masking the genome sequence affects the shape of the distance distributions. Several strong peaks observed in the complete genome are eliminated by masking. For example, the distance distribution of (Figure 1(f)) loses the four strong peaks in the masked sequence (not shown).
We repeat the previous procedure in the masked sequence, to detect symmetric pairs whose distance distributions have very similar or very dissimilar patterns. The first quartile of becomes 546, so we exclude the pairs for which , leaving with 6075 pairs (see Table 1).
As before we automatically select the symmetric pairs with dissimilarity below the percentile of (0.328), and those with dissimilarity above the percentile of (2.454). The pairs with lowest dissimilarity may be divided in two groups: those for which both distributions have strong peaks at short distances, and those whose distributions look like exponential curves without strong peaks. These patterns are illustrated in Figure 2(a)–(c). Interestingly, the unusual pattern of in the complete sequence (Figure 1(d)) remains in the masked sequence (see Figure 2(b)).
Symmetric pairs with high dissimilarity usually have one distribution with one or more strong peaks at short distances (¡200) whereas the other has low variability. Some very dissimilar pairs are shown in Figure 2(d)–(f).
(a)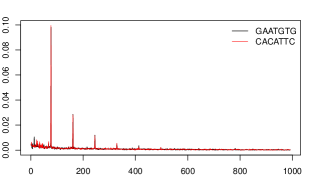 (b)
(b)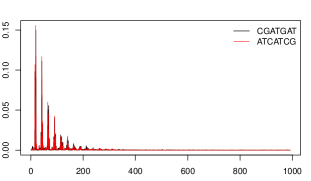 (c)
(c)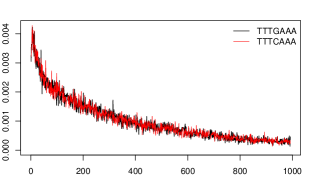 (d)
(d)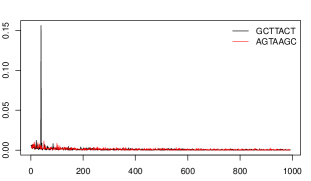 (e)
(e)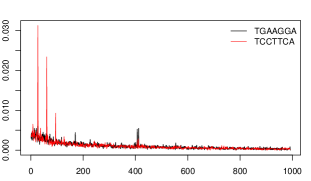 (f)
(f)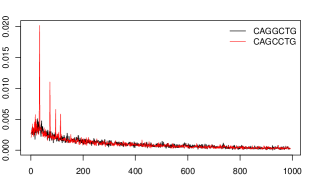
To investigate whether an association exists between dissimilar reversed complements and functional DNA elements, we perform an annotation analysis for the 15 most dissimilar symmetric pairs. For each such pair we list the word with the strongest peaks. Then we look for the ‘favoured’ distance(s), i.e. those where the strongest peak(s) are located. These peaks are often concentrated in one chromosome rather than being spread over the entire genome sequence. Table 2 lists the chromosome in which the favoured distances are most pronounced, for each of the 15 pairs. The positions of the words occurring at that distance from each other are recorded. Then, we retrieve annotations within these genomic coordinates from UCSC GENCODE v24. Interestingly, the words we obtained that are located on chromosome 13 all fall within the gene LINC01043 (long intergenic non-protein coding RNA 1043) and all of our words on chromosome 1 are contained in the gene TTC34 (tetratricopeptide repeat domain 34). These results suggest that the most dissimilar distributions may be related to repetitive regions associated with RNA or protein structure.
A deeper investigation into the biological meaning of these words is necessary to investigate whether the observed dissimilarities reflect the selective evolutionary process of the DNA sequence.
| chromosome | 13 | 1 | 4 | 3 | 8 | |
|---|---|---|---|---|---|---|
| word | ||||||
4 Conclusions
We propose a new dissimilarity measure between distance distributions, based on discrepancies between their peaks. Here we use it to evaluate the dissimilarity between reversed complements.
In the complete human genome, we confirm the expected existence of many symmetric pairs with low dissimilarity, both in word frequency and in distance distribution. Even an irregular distribution with strong peaks is often very similar to that of its reversed complement. However, our main interest lies in using the proposed dissimilarity measure to detect symmetric pairs with highly distinct distributions. In such cases, one of the distance distributions typically has well defined peaks and the other has low variability.
We also investigate how well our results hold up in the masked sequence, which excludes major known classes of repeats. Even though masking generally reduces the dissimilarity between distributions of symmetric pairs, there remain quite a few word pairs with high dissimilarity, which in our study was mainly localized on a specific chromosome and even a specific gen. A question worth investigating is to what extent the high dissimilarities may be linked to evolutionary processes.
Acknowledgment
This work was partially supported by the Portuguese Foundation for Science and Technology (FCT), Center for Research & Development in Mathematics and Applications (CIDMA), Institute of Biomedicine (iBiMED) and Institute of Electronics and Telematics Engineering of Aveiro (IEETA), within projects: UID/MAT/04106/2013, UID/BIM/04501/2013 and PEst-OE /EEI/UI0127/2014. A. Tavares acknowledges the PhD grant from the FCT: PD/BD/105729/2014. The research of P. Brito is financed by the ERDF - European Regional Development Fund through the Operational Programme for Competitiveness and Internationalisation - COMPETE 2020 Programme within project POCI-01-0145-FEDER-006961, and by the FCT as part of project UID/EEA/50014/2013. The research of J. Raymaekers and P. Rousseeuw was supported by projects of Internal Funds KU Leuven.
References
- [1] Vera Afreixo, Carlos AC Bastos, Sara P Garcia, João MOS Rodrigues, Armando J Pinho, and Paulo JSG Ferreira. The breakdown of the word symmetry in the human genome. Journal of theoretical biology, 335:153–159, 2013.
- [2] Vera Afreixo, João MOS Rodrigues, and Carlos AC Bastos. Analysis of single-strand exceptional word symmetry in the human genome: new measures. Biostatistics, 16(2):209–221, 2015.
- [3] Guenter Albrecht-Buehler. Asymptotically increasing compliance of genomes with Chargaff’s second parity rules through inversions and inverted transpositions. Proceedings of the National Academy of Sciences, 103(47):17828–17833, 2006.
- [4] Pierre-François Baisnée, Steve Hampson, and Pierre Baldi. Why are complementary DNA strands symmetric? Bioinformatics, 18(8):1021–1033, 2002.
- [5] Gary Benson et al. Tandem repeats finder: a program to analyze DNA sequences. Nucleic acids research, 27(2):573–580, 1999.
- [6] Donald R Forsdyke and James R Mortimer. Chargaff’s legacy. Gene, 261(1):127–137, 2000.
- [7] Eric S Lander, Lauren M Linton, Bruce Birren, Chad Nusbaum, Michael C Zody, Jennifer Baldwin, Keri Devon, Ken Dewar, Michael Doyle, William FitzHugh, et al. Initial sequencing and analysis of the human genome. Nature, 409(6822):860–921, 2001.
- [8] Arian F. A. Smit, Robert M. Hubley, and P. Green. RepeatMasker Open – 4.0. 2013-2015 (http://repeatmasker.org).
- [9] Ana Helena Tavares, Vera Afreixo, João M. O. S. Rodrigues, and Carlos A. C. Bastos. The symmetry of oligonucleotide distance distributions in the human genome. In Science and Technology Publications, editors, Proceedings of ICPRAM, volume 2, pages 256–263, 2015.
- [10] Shang-Hong Zhang and Ya-Zhi Huang. Strand symmetry: Characteristics and origins. In Bioinformatics and Biomedical Engineering (iCBBE), 2010 4th International Conference on, pages 1–4. IEEE, 2010.