33institutetext: Astrophysics Group, School of Physical and Geographical Sciences, Keele University, Keele, Staffordshire ST5 5BG, UK
44institutetext: Dipartimento di Matematica e Fisica, Università degli Studi Roma Tre, Via della Vasca Navale 84, I-00146 Roma, Italy
55institutetext: INAF - - Osservatorio Astrofisico di Arcetri, Largo Enrico Fermi 5, I-50125 Firenze, Italy
66institutetext: INAF - Osservatorio Astronomico di Roma, Via Frascati 33, I-00040 Monteporzio Catone, Italy
A high spectral resolution map of the nuclear emitting regions of NGC 7582
We present the results of the spatial and spectral analysis of the high resolution data of NGC 7582 that were collected with a deep ( ksec) Chandra HETG observation. NGC 7582 is a well studied “changing look” AGN where multiple and possibly clumpy absorbers are present. During this long Chandra observation NGC 7582 was in a highly obscured state. Therefore, we considered also a short ( ks) Suzaku observation performed in September 2007, which caught NGC 7582 in a Compton thick state. This allows us to determine the underlying continuum model and the amount of absorption [ cm-2]. A wealth of emission lines (from Mg, Si, S and Fe) are detected in the Chandra spectrum, which allow us to map the structure of the circum-nuclear emitters. The high resolution spectrum reveals that the soft X-ray emission originates in a hybrid gas, which is ionized in part by the strong circum-nuclear star forming activity and in part by the central AGN. The new high resolution images confirm that the emitting region is highly inhomogeneous and extends up to a few hundred pc from the nuclear source. The X-ray images are more extended in the lower energy lines (Ne and Mg) than in the higher energy lines (Si, Fe), where the former are dominated by the collisionally ionised gas from the starburst and the latter by the photoionized AGN emission. This is supported by the analysis of the He-like triplets in the grating spectra, where Mg xi displays strong resonance line emission (starburst) and where Si xiii shows strong forbidden line emission (AGN). We deduce that a low density ( cm-3) photoionized gas is responsible for the strong forbidden components and although it is more compact than the Ne and Mg emission, it is likely to originate from extended AGN Narrow Line Region gas at distances of 200-300 pc from the black hole. We also detected an absorption feature at keV consistent with the rest frame energy of the resonance absorption line from Fe xxv ( keV), which traces the presence of a sub-parsec scale ionized circumnuclear absorber. The emerging picture is in agreement with our new view of the circumnuclear gas in AGN, where the medium is clumpy and stratified in both density and ionization. These absorbers and emitters are located on different scales: from the sub-pc Broad Line Region gas out to the kpc scale of the galactic absorber.
Key Words.:
galaxies: individual: NGC 7582 — X-rays: galaxies —galaxies: active1 Introduction
Systematic X-ray studies with Chandra and XMM-Newton have established that our classical view of the central regions of Active Galactic Nuclei (AGN), where the absorbing medium is a homogeneous pc scale absorber, covering a wide solid angle is too simplistic (see Bianchi et al. 2012; Turner & Miller 2009 and references therein). While we still believe that the central engine is fundamentally the same in every AGN (Antonucci 1993), we have now mounting evidence for a more dynamic and complex circumnuclear gas. Among the first AGN that unveiled that complexity are the “changing look” AGN, which are extremely variable sources that transition from Compton-thin (i.e. column density or cm-2), or even unobscured, to Compton thick ( cm-2) states (Matt et al. 2003; Guainazzi et al. 2002). While for some of them a dramatic dimming in the primary emission can explain the appearance as highly obscured, as the reprocessor can echo a past and more luminous emission (e.g NGC 4051, Guainazzi et al. 1998; NGC 2992, Gilli et al. 2000), there is also a clear evidence that some of these extreme variations are due to a highly inhomogeneous absorber. Variations of the covering factor or column density () of the X-ray absorbing gas, with the changing from few percent up to an order of magnitude, is a common property of obscured AGN (Risaliti et al. 2002; Markowitz et al. 2014; Torricelli-Ciamponi et al. 2014) and argues for a high degree of clumpiness of the absorbing medium. Although the majority of the absorption changes occurs on relatively long time-scales (i.e. months to years), we have witnessed variations on time-scales as short as few days or even few hours, the prototype example of the class of “changing-look” AGN being NGC 1365 (Risaliti et al. 2005, 2007, 2009; Maiolino et al. 2010). As some of these fast changes can be regarded as eclipsing events, where our line of sight intercepts a higher density cloud, their time-scales can be directly linked to the size and distance of the absorbing clouds from the central super-massive black hole (SMBH). These rapid variations suggest that a significant fraction of this clumpy absorber must be located very close to the nuclear X-ray source and, more specifically, within the Broad Line Region (BLR; see Risaliti et al. 2005).
Intrinsic variability of the primary emission still plays a role as it is expected that the accretion on to the SMBH to be variable and characterized by flaring and dimming episodes, as shown by the highly variable X-ray emission of genuine unobscured AGN (McHardy 1985; Green et al. 1993). The emerging picture of AGN is thus quite complex and the observed spectral variability cannot be solely ascribed to either intrinsic variability or the clumpiness of one single absorber. Further insights on these multi phase and clumpy absorbers has come from deep observations of nearby AGN with the XMM-Newton and Chandra gratings. These high spectral resolution observations revealed that the X-ray emission of AGN can be extremely rich in emission and absorption lines, tracing multiple emitting and absorbing regions all of them contributing to shape the observed spectra (Turner & Miller 2009). In this framework “Changing look” AGN are an extremely important class since they can place severe constraints on the location and structure of the X-ray absorbers. They are not the exception to the AGN population, but most likely they are the sources for which we have an optimal line of sight that intercepts
all the innermost and clumpy absorbers.
NGC 7582 () is an X-ray bright ( erg cm-2 s-1; Bianchi et al. 2009; Piconcelli et al. 2007; hereafter B09 and P07, respectively) Seyfert 2 galaxy, which has been observed in the X-ray band several times: from the early days of X-ray astronomy with Einstein and Ginga to the most recent X-ray observatories XMM-Newton, Chandra and Suzaku. NGC 7582 is classed as one of the prototype “changing look” AGN as it has shown remarkable variability on different time-scales both in the optical (Aretxaga et al. 1999; Turner et al. 2000) and in the X-ray band. Evidence for a variable and complex X-ray absorber has been reported since the low spectral resolution observations performed with ASCA and BeppoSAX (Xue et al. 1998; Turner et al. 2000). Furthermore, the first broad band X-ray observation of NGC 7582 performed by BeppoSAX (Turner et al. 2000) unveiled the presence of at least two X-ray absorbers, with one of them being Compton thick and covering % of the nuclear source. A second and Compton-thin absorber of cm-2, part of which can be associated with a large scale galactic absorber, is always present and fully covers the nuclear source.
Subsequent observations confirmed the extreme nature of NGC 7582, where both flux and variations occur on different time-scales, from less than a month to years.
On longer time-scales, such as the one probed with the two XMM-Newton observations performed in 2001 and 2005 (P07),
the thicker absorber increased in column density by a cm-2 while the thinner absorber remained constant ( cm-2). On timescales as short as a day, as the one probed by two observations performed with XMM-Newton and Suzaku in April 2007 (B09), the thicker absorber varies by a typical cm-2. From the elapsed time between those two observations of about 20 hr, B09 inferred a distance for the variable and higher absorber of about cm, consistent with the location of the BLR.
Given the rather constant Compton reflection component and the Fe K emission line detected in all the observations, a larger scale Compton-thick reprocessor, that can be associated with the putative obscuring torus of the Unified Model of AGN, is also present (B09). Our line of sight is not totally blocked by this material as we are able to view a second and more compact absorber that is responsible for the fast variations. The presence of both these absorbers has been recently confirmed by two NuSTAR observations that were performed two weeks apart in 2012 (Rivers et al. 2015b). Finally, a third and Compton thin ( cm-2) absorber is located at larger distance and could be identified with the dust lane visible in both the Hubble Space Telescope (HST) and Chandra X-ray images (Bianchi et al. 2007, hereafter B07). Interestingly, since the early observations with BeppoSAX, NGC 7582 has clearly undergone a drop in the primary X-ray emission. Indeed, even in the Compton thin state the observed hard (2–10 keV) flux is always of the order of erg cm-2 s-1 and it has never reached again the bright state observed with BeppoSAX ( erg cm-2 s-1; P07, Rivers et al. 2015b).
Here we present a detailed analysis of a deep ( ksec) Chandra observation of NGC 7582, which was performed in April 2014 with the high energy transmission gratings (HETG; Markert et al. 1994) at the focal plane. Prior to our HETG observation, Chandra observed NGC 7582 with the Advanced CCD Imaging Spectrometer (ACIS; Garmire et al. 2003)
twice in 2000 (for a total of ksec), which showed that the soft X-ray emission extends over and has a highly complex morphology. By comparing the Chandra and HST images B07 concluded that the inhomogeneity seen in the X-ray images can be in part explained with the presence of the dust lane of the host galaxy and in part traces variations of the physical properties of the emitting regions, which differ in ionization and/or density.
Furthermore, as seen in other Seyfert 2s (Guainazzi & Bianchi 2007), the soft X-ray emission is dominated by emission lines from highly ionized elements (from He-like and H-like O, Ne, Mg, Si and S), with a strong contribution to the emission from a photoionized gas (P07). However, since the XMM-Newton-RGS detector has a limited band pass (0.35–2.5 keV) and for NGC 7582 the spectrum had insufficient signal to noise above 1 keV, most of the emission lines were detected only with the XMM-Newton and Suzaku CCD detectors. Therefore the HETG observation presented here provides the first high spectral resolution data of this “changing look” over the keV energy range. During this observation NGC 7582 was in a highly obscured state, which allowed us to map the emitting regions up to the Fe-K band. The paper is structured as follows: in §2 we describe the Chandra and Suzaku observations and data reduction; in §3 we present the modeling of the Chandra spectrum. In §4 we compare the results of the spectral analysis with the high spatial resolution images extracted for the element of interest (i.e. Ne, Mg and Si) and derive the main properties of the multiphase emitting gas. A summary of the structure of the circum-nuclear gas in NGC 7582 is presented in §4 and §5.
2 Observations and data reduction
2.1 Chandra
Chandra observed NGC 7582 twice in 2014, on April 21 and April 22, for a total of ks (OBSIDs: 16079 and 16080 with 173 ks and 20 ks exposure, respectively; see Table 2).
The observations were made with the HETG instruments at the focal plane of the Advanced CCD Imaging Spectrometer (ACIS-S; Garmire et al. 2003). The HETG consists of two gratings assemblies, the High-Energy Grating (HEG; 0.7–10.0 keV) and the Medium-Energy Grating (MEG; 0.4–8 keV). The HETG data were reprocessed with the Chandra Interactive Analysis of Observations software package (CIAO version 4.8111http://cxc.harvard.edu/ciao; Fruscione et al. 2006) and CALDB version 4.7.2.
We extracted the spectra for each arm ( and ) for the first order data of each of the HETG grating (HEG and MEG) for each observation. To extend the HEG data above 8 keV we used an extraction strip narrower (with a HETG width of 20 instead of 35) than the default. We then generated for each of the arms ( and
) the spectral redistribution matrices (rmf files) with the CIAO tool mkgrmf and the telescope effective area files with the CIAO script fullgarf, which drives the CIAO tool mkgarf.
We then combined the and orders (using response files combined with appropriate weighting); we did not subtract the background as it is negligible.
Although most of the exposure was performed during the second observation (OBSID 16079), we checked that the spectra extracted from the two OBSIDs are consistent and combined them to create higher quality summed first-order HEG and MEG spectra for fitting; again we created the response files combining them with the appropriate weighting. Prior to any spectral fitting it is clear that NGC 7582 was in a Compton-thick state for the whole duration of the Chandra observation, as there is no evidence of the primary emission emerging in the collected spectra up to 5 keV (see Fig. 2). For the main spectral fits we binned the HEG to 1024 channels and the MEG to 2048 channels, corresponding to . This binning corresponds to twice the full width half maximum (FWHM) resolution of the HEG and the FWHM of the MEG detectors. A finer binning of will be used later for some of the line profiles. For most of the spectral fits we considered the 1.2–7 keV and 1.9–9.5 keV energy range for the MEG and HEG, respectively; in these energy bands we collected and counts in the MEG and HEG spectra.
Throughout the paper we adopted H km s-1 Mpc-1, =0.73, and =0.27 (Spergel et al., 2003).
All the spectral fits are performed using XSPEC (Arnaud 1996) with the C-statistic; the fit parameters are quoted in the rest frame of NGC 7582 and errors are at the 90% confidence level for one interesting parameter, unless otherwise stated. As we are using the XSPEC software package, all fit parameters are given in energy, where we adopted the conversion factor between energy and wavelength of 1 keV being Å in wavelength. In all the fits we included Galactic absorption with a column density (Dickey & Lockman 1990).
| Obs. | Det. | OBSID | DATE | |
|---|---|---|---|---|
| (ks) | ||||
| Chandra | HETG | 16080 | 2014 Apr 21 | 19.7 |
| Chandra | HETG | 16079 | 2014 Apr 22 | 173.4 |
| Suzakua | XIS | 702052040 | 2007 Nov 16 | 23.9 |
| Suzakua | PIN | 702052040 | 2007 Nov 16 | 23.9 |
2.2 Suzaku
Four Suzaku (Mitsuda et al., 2007) observations of NGC 7582 were performed in 2007 with an averaged exposure time of 25-30 ksec. As NGC 7582 was Compton thin in the first two observations and thick in the last two (B09), we considered only two observations representative of each state; in particular we considered for the thick state the fourth observation, which has an observed 2–10 keV flux similar to the flux measured with Chandra ( erg cm-2 s-1, see Table 5).
For the Suzaku data reduction we followed the standard prescription for the filtering procedures and considered only the data from the two front illuminated (FI) X-ray Imaging Spectrometer (XIS 0 and XIS 3, Koyama et al., 2007) and the hard X-ray detector (HXD-PIN; Takahashi et al. 2007). The XIS source spectra were extracted from a circular region of 2.9′ radius centered on the source, while the background spectra were extracted from two circular regions of 2.4′ radius offset from the source and the Fe 55 calibration sources, which are in two corners of the CCDs.
The XIS response and ancillary response files were produced, using the latest calibration files, with the ftools tasks xisrmfgen and xissimarfgen, respectively. After checking for consistency, the spectra from the two FI-CCDs were combined in a single source spectrum.
The HXD-PIN data were reduced following the latest Suzaku data reduction guide (the ABC guide Version
4.0333http://heasarc.gsfc.nasa.gov/docs/suzaku/analysis/abc/), and using the rev2 data, which
include all 4 cluster units. The HXD-PIN background was extracted from the background event file (known as the “tuned” background), which is provided by the HXD-PIN team and accounts for the instrumental Non X-ray Background (NXB; Kokubun et al., 2007). The source and background spectra were extracted using the same common good time interval and the source spectrum was corrected for the detector dead time. We then simulated a spectrum for the cosmic X-ray background counts adopting the form of Boldt (1987) and Gruber et al. (1999) and the response matrix for the diffuse emission; the resulting spectrum was then added
to the instrumental one.
The XIS-FI source spectra were binned to 1024 channels and then to a minimum of 50 counts per bin, while the HXD-PIN spectrum was binned in order to have a signal-to-noise ratio of 5 in each energy bin. The net count rates for the Compton thick state are: counts s-1 and counts s-1 for the XIS-FI (0.6–10 keV) and HXD, respectively. Data were included from 0.6–10 keV for the XIS–FI, we also excluded the data in the 1.6–1.9 keV energy range due to calibration uncertainties; for the HXD-PIN we considered only the 14–50 keV energy range.
3 Spectral Analysis
3.1 Continuum modeling
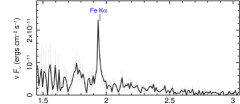
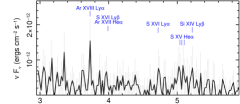
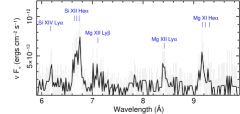
The first inspection of the Chandra data shows a spectrum dominated by emission lines with an extremely low continuum,
suggesting that NGC 7582 was in a Compton thick state for the duration of the observation. In Fig. 1 we show the observed HETG spectrum in flux units unfolded against a power-law model with a photon index . The spectrum is shown at the FWHM resolution of the HETG ( Å and Å for the HEG and MEG, respectively) and covers the wavelength range from Å (corresponding to keV). The spectrum is plotted in wavelength to show not only the overall spectral shape but also the several emission lines that are present.
Before proceeding to parameterize the emission lines, we focused on the shape of the underlying continuum. As at this point we are not interested on the finer details of the emission line profiles, we considered the HEG and MEG spectra grouped with a minimum of 10 counts per bin and fitted in the 0.7–7 keV and 1.9–9.5 keV energy range for the MEG444We note that adopting the additional grouping of 10 counts allows us to consider the MEG data down to 0.7 keV. and the HEG, respectively. We considered a simple baseline continuum model typical of a highly obscured AGN, which is composed of an absorbed power-law component, a scattered soft power-law and a Compton reflected continuum component (modeled with PEXRAV, Magdziarz & Zdziarski 1995), where we assumed an inclination angle of , a reflection fraction of and allowed its normalization to vary with respect to the primary power law. We assumed that the scattered and primary power-law component have the same photon index (). This baseline continuum model provides a reasonable description of the overall spectral shape; the fit statistics is poor ( for 171 ) and even at this coarse binning several line-like residuals are clearly present. Due to the limited photon statistics, as well as the lack of coverage above 10 keV, as we are not including the Suzaku data, both the intrinsic photon index and the amount of absorption are unconstrained. However, we can still derive a lower limit on the amount of absorption of cm-2, assuming a photon index , in agreement with a Compton-thick scenario.
| Parameter | Units | |
|---|---|---|
| 1.74 | ||
| cm-2 | 120 | |
| A | ph cm-2 s-1 | 7.6 |
| A | ph cm-2 s-1 | 3.1 |
| A | ph cm-2 s-1 | 1.9 |
| kT | keV | 0.63 |
| A | cm-5 | 1.20 |
| A | cm-5 | 0.37 |
| F (0.5–2) keVChandra | erg cm-2 s-1 | |
| F (0.5–2) keVSuzaku | erg cm-2 s-1 | |
| F (2–10) keVChandra | erg cm-2 s-1 | |
| F (2–10) keVSuzaku | erg cm-2 s-1 |
$b$$b$footnotetext: Primary power-law component normalization.
$c$$c$footnotetext: Compton reflection component normalization.
$d$$d$footnotetext: Normalization of the thermal component is defined as , where is the angular size distance to the source (cm), is the electron density (cm-3), and is the hydrogen density (cm-3) as defined in the mekal model.
$e$$e$footnotetext: Normalization of the thermal component for the Chandra spectra obtained after fixing the photon index of the scattered component.
A soft excess, possibly associated to a starburst emission is present below 1 keV; however, while the addition of a thermal emission component (mekal; Mewe et al. 1985) improves the fit ( for 169 d.o.f.) several residuals are present as most of the line-like features that are visible in Fig. 1 are not accounted for by this model. The temperature of this component is keV and mainly improves the fit below 1 keV, but cannot account for both the strong Mg xi and Si xiii emission lines. We tested for the presence of an additional and higher temperature thermal emission component, but also in this case while the fit statistically improves ( for 2 d.o.f.) it still leaves strong residuals above keV. As we will show later there is evidence in the zeroth order images for some extended emission, which extends on scales of few hundreds pc from the nuclear source. This could be, in principle, associated with the Narrow Emission Line Region (NLR) gas or a hot gas connected with a strong circum-nuclear star formation activity. Most of the emission lines with the exception of Mg xi show also a strong forbidden component, which is indicative of a photoionised gas or at least an hybrid plasma. Therefore the simple addition of a thermal emission model cannot describe adequately the soft X-ray spectrum. This is in agreement with the analysis of the XMM-RGS data presented by P07, where, despite the larger aperture of the RGS data with respect to the Chandra gratings, it was already found that the soft X-ray emission in NGC 7582 has a strong contribution from a photoionised gas.
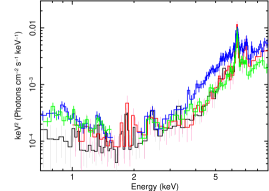
In order to better parametrize the continuum, we then repeated the fit including both the Chandra and the Suzaku spectra collected during the fourth of the Suzaku observations (both the XIS-FI and the HXD-PIN data), which caught NGC 7582 in a Compton thick state and with a similar 2–10 keV flux. As we are not interested in the detailed modelling of the absorber, we fitted the same simple model for a Compton thick absorber/reflector and we included several Gaussian lines to account for the soft X-ray emission lines as well as the Fe K emission line. Since the Suzaku’s large PSF (point spread function) includes all the galaxy, we added a thermal emission component for the Suzaku data allowing for different normalizations between the Chandra and Suzaku spectra. Indeed a clear excess in the soft X-ray emission is apparent in the Suzaku XIS below 1 keV with respect to the Chandra data (Fig. 2). However, as the Chandra spectra have a low S/N below 1 keV, the normalisation of the Chandra’s thermal component is highly degenerate with the photon index and normalisation of the scattered power-law component, so we initially fixed it to zero. This model can be expressed with the mathematical form:
| (1) |
where as before we assumed the same for both the scattered (pow1) and primary power-law component (pow2). Thanks to the joint fit with the Suzaku data we have now some basic constraints on the primary continuum: the photon index is found to be , the column density of the absorber is, as expected, in the Compton thick regime with cm-2, the normalisations of the primary and reflected power-law components are photons cm-2 s-1 and photons cm-2 s-1 (see Table 5), which correspond to a reasonable reflection fraction of about . These parameters are in agreement with the best-fit model of the Compton thick state as found by B07. Although statistically the fit is still not good (), we note that most of the remaining residuals are mainly due to additional soft X-ray emission lines in the Chandra spectra. The observed Chandra soft (0.5–2 keV) and hard (2–10 keV) X-ray fluxes are erg cm-2 s-1 and erg cm-2 s-1 respectively (see Table 2). We note that the hard X-ray flux measured with this observation is similar to all the recent observations that caught NGC 7582 in a thick state (B09; P07; Rivers et al. 2015b).
NGC 7582 was also observed with NuSTAR in 2012 on August 31 for ksec and September 14th for ksec (Rivers et al. 2015b). We inspected both these observations and found that while in the first observation NGC 7582 was caught in the standard Compton thin state ( cm-2), in the second NGC 7582 was in a more obscured state ( cm-2). We attempted a simultaneous fit with the Chandra and NuSTAR spectra as done with the Suzaku data; however, while in the 2–10 keV energy range the Suzaku spectra perfectly overlay on the Chandra data (as seen in Fig. 1), the NuSTAR spectra show a slightly different spectral shape. This could be explained with either a different and/or an apparent harder photon index. Therefore we proceeded to adopt the best-fit continuum described by the joint analysis of the Chandra and Suzaku spectra in the Compton thick state (see Table 5).
3.2 Emission line component
Having reached a good representation of the underlying continuum we then proceeded to build the Chandra emission line component model. We therefore fixed the photon index and to the best fit value found with the joint fit with the Suzaku spectra (see Table 5) and allowed the normalisations of the power-law components and reflection component to adjust upon adding the Gaussian emission lines. We considered at first the MEG and HEG data binned at mÅ (2048 and 1024 channels for the MEG and HEG respectively) and the keV and keV energy range for the MEG and the HEG spectra, respectively.
We then added several Gaussian emission lines; each individual line was considered to be statistically significant if the addition yielded an improvement of the fit statistic of (corresponding to 99% significance for 2 interesting parameters), with the exception of possible weaker emission lines that are part of a triplet (see below). We then allowed their widths to be free; if the width was found to be consistent with being unresolved at the 90% confidence level, we then fixed it to eV. Below 6 keV we detected 10 statistically significant Gaussian emission lines, whose main parameters together with the most likely identification, the improvement of the fit and laboratory energy are listed in Table 6. The parameters of four less significant lines are also listed as they correspond to the expected transitions from Mg xi, Mg xii and S xvi. After the inclusion of these Gaussian emission lines, any addition of a thermal emission component did not improve the fit. This is because we considered the data only above 1.2 keV and once we accounted for the emission lines no spectral curvature (i.e. from an additional weak thermal emission component) is left unmodeled. This does not imply that we can rule out the presence of a thermal emission component, indeed as we will show later some of the emission lines could be explained with a collisionally ionized plasma.
| Rest Energya | Intensity | IDb | Atomic Energyc | ||
|---|---|---|---|---|---|
| (eV) | (ph cm-2 s-1) | (eV) | (eV) | ||
| Mg xi (f) | 1331 | 3.9/2 | |||
| Mg xi (r) | 1352 | 32.5/3 | |||
| Mg xii Ly | 1473 | 18.6/3 | |||
| Mg xii Ly | 1745 | 6.5/2 | |||
| Si xiii (f) | 1839 | 49.1/3 | |||
| Si xiii (r) | 1865 | 33.3/2 | |||
| Si xiv Ly | 2006 | 23.5/3 | |||
| Si xiv Ly | 2376 | 9.4/2 | |||
| S xv (f) | 2430 | 14.2/2 | |||
| S xv (r) | 2461 | 9.9/2 | |||
| S xvi Ly | 2622 | 5.4/2 | |||
| S xvi Ly | 3106 | 7.1/2 | |||
| Ar xvii (f) | 3104 | ||||
| Ar xviii Ly | 3323 | 17/2 | |||
| Fe K | 6390 | 112.5/3 | |||
| Fe K | 6403 |
$b$$b$footnotetext: Possible identification.
$c$$c$footnotetext: Known atomic energy of the most likely identification of the line in eV, from NIST (http://physics.nist.gov/PhysRefData/ASD/).
$d$$d$footnotetext: Improvement in C-statistic upon adding the line.
$f$$f$footnotetext: Denotes the parameter is fixed.
$t$$t$footnotetext: Indicates that the is tied to the width of another transition from the same ion species
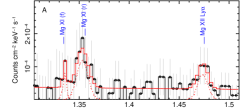
In Fig. 3 we show a zoom into the range of interest of the strongest emission lines, noting that no other clear residuals are left; furthermore the plots show that the baseline continuum, derived from the joint fit with the Suzaku spectra, is a good representation of the continuum in the HETG spectra. In particular, as can be seen in the lower panel (at the Fe-K region) no further residuals due to a reflection edge are present. We then examined, when possible, each of the strongest emission lines complexes with the spectra binned at Half Width at Half Maximum (HWHM corresponding to 4096 channels for the MEG) to investigate the actual broadening of some of the emission lines that appear to be resolved and derive a more general scenario for the emitting regions. All the emission lines appear to be detected at the expected rest-frame energy; in order to quantify any possible in- or outflow velocity of the emitting gas we considered the 90% errors on the energy centroids of the strongest H-like emission lines (see Table 6 and Table 4). We found that although the energy centroids may suggest outflow velocities of km s-1, once we consider the large errors ( km s-1) they are all consistent with the systemic velocity of NGC 7582.
3.2.1 The Mg xi and Mg xii emission lines
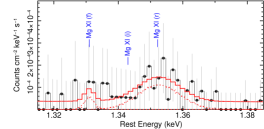
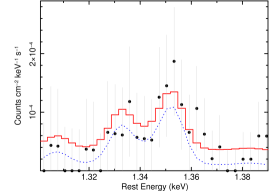
At FWHM resolution binning, in the energy range of the Mg xi triplet we clearly detected only the resonance component at eV, a weaker emission line may be present at the corresponding energy of the forbidden component, but it is not statistically significant ( for 2 d.o.f.). The resonance component is resolved with a broadening of eV corresponding to a km s-1; forcing it to be unresolved (i.e. 1 eV) the fit worsens by . The Mg xii Ly line is also clearly detected () with an eV and is also resolved with a km s-1 ( with respect to eV).
We then considered the MEG spectrum binned at the HWHM (i.e. 4096 channels, corresponding to a spectral resolution of ) and refitted the Mg xi and Mg xii lines. The energy centroids and normalisations of the Mg xi and Mg xii emission lines are similar to the values obtained with the coarse binning and also at this finer binning the forbidden component is not statistically required and we can only derive an upper limit on its intensity of ph cm-2 s-1. Both the strong resonance component of the Mg xi and the Mg xii Ly emission lines are resolved (see Fig.4, upper panel and Table 7), with a possible broadening of eV, which corresponds to velocity widths of km s-1 and km s-1 for the Mg xi and Mg xii lines respectively. These line widths could suggest an origin closer in than the location of the Narrow Emission Line Region, like from the outer BLR. However, as we will discuss in §4.1 these line widths could be an artifact due to the diffuse emission component, which broadens the lines when it is dispersed by the gratings. Indeed, as we will show later in §4.1, there is evidence that the emission at these energies is spatially extended, which causes a degradation of the apparent spectral resolution. We note also that in the case of the Mg xi triplet the prominence of the resonance component with respect to the forbidden line is suggestive that the triplet is mainly produced in a collisionally ionised plasma rather than in photoionised gas (Porquet & Dubau 2000; see also §4.1.1). This could indicate that at least part of the triplet emission is associated with the circum-nuclear star forming regions, rather than the photoionised emission associated with the AGN NLR gas.
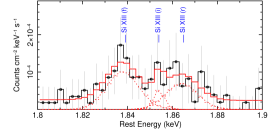
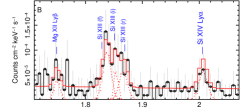
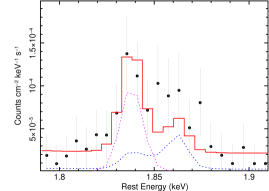
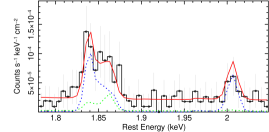
3.2.2 The Si xiii and Si xiv emission lines
Both strong forbidden and resonance components of the Si xiii triplet are detected (see Table 6 & 7 and Fig. 3), where the forbidden component appears to be marginally stronger than the resonance line, but with large uncertainties. An emission line could be present at the energy of the intercombination line (see Fig.4, lower panel) but it is not statistically required (). We detected both the H-like Si xiv Ly and Ly (see Fig. 3 panel B and C) emission lines ( and , respectively). As for the Mg xi triplet, we then fitted the spectra at a finer binning, corresponding to a spectral resolution of for both the MEG and the HEG spectra. Both the forbidden and resonance components of the He-like triplet are resolved and tying the widths of these lines to a common value results in an overall line width of eV; the improvement of the fit with respect to two unresolved emission lines is . A similar broadening is also required for the Si xiv Ly and Ly emission lines ( eV). These line widths would correspond to a velocity broadening of km s-1 and km s-1, for the Si xiii and Si xiv lines, respectively. However as we will discuss later, similar to the Mg triplet, the line widths could be in part explained with the presence of a spatially extended component.
| Line | Rest Energya | EW | |||
|---|---|---|---|---|---|
| (eV) | eV | (eV) | (km s-1) | ||
| Mg xi (r) | 33.5 | ||||
| Mg xii Ly | 18.2 | ||||
| Mg xii Ly | 6.3 | ||||
| Si xiii (f) | 31.9 | ||||
| Si xiii (r) | 64.6 | ||||
| Si xiv Ly | 28 | ||||
| Si xiv Ly | 11.6 | ||||
| S xv (f) | 12.0 | ||||
| S xv (r) | 2469 | 9.6 | |||
| S xvi Ly | 5.2 | ||||
| S xvi Ly | 7.9 | ||||
| Ar xviii Ly | 18.9 | ||||
| Fe Kc | 101.6 |
$b$$b$footnotetext: Improvement in C-statistic upon adding the line.
$c$$c$footnotetext: The parameters of the Fe K emission lines refers to the best-fit model after the inclusion of the possible Compton shoulder and the is against the total observed continuum.
$f$$f$footnotetext: Denotes the parameter is fixed.
$t$$t$footnotetext: Indicates that the is tied to the width of another transition from the same ion specie.
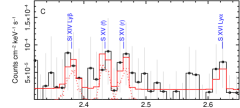
3.2.3 The Sulphur and Argon emission lines
Although weak we detected both the forbidden and resonance components of the S xv triplet, as well as the Ar xviii Ly emission line. The S xvi Ly emission line is marginally detected () together with the possible Ly emission line (), for the latter however the identification is not secure as within the errors the energy centroid is compatible with the forbidden component of Ar xvii. We note however that there are no strong residuals at the corresponding energy of the Ar xvii resonance component (). All these emission lines are unresolved at the HETG spectral resolution ( eV). We inspected the HEG spectrum binned at to better characterize the profile of the strongest lines and we found that at this finer binning only loose constraints can be derived for the widths of these emission lines, which are all consistent with being unresolved, with upper limits on the of km s-1.
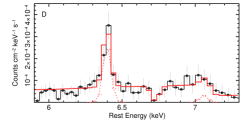
3.2.4 The Fe K emission line
A strong Fe K emission line is clearly detected both in the MEG and HEG spectra with a for 3 d.o.f.; the Fe K emission line appears to be resolved with a km s-1, while the expected Fe K is only marginally detected (). The measured eV, or keV with respect to the reflection component, is in agreement with the highly obscured state of NGC 7582 (Murphy & Yaqoob 2009). As we collected counts in the 5–8 keV energy range and about counts at the energy of the Fe K emission line we then considered the HEG spectrum binned at the highest spectral resolution (i.e. mÅ). We do not consider the MEG data as at this energy range they have a lower spectral resolution and the S/N of the spectrum is too low compared to the HEG data. The Fe K ( keV) emission line is resolved with eV (see Fig. 5) and an intensity of ph cm-2 s-1, which is similar to the intensity measured with all the CCD observations (see P07, B09 and Rivers et al. 2015).
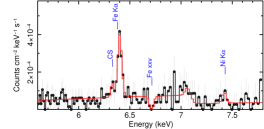
We then tested if the line width could be in part explained with the presence of the Compton shoulder, which may be expected when the line emission originates from scattering off Compton thick material (Matt 2002; Yaqoob & Murphy 2011). The inclusion of a Compton shoulder only marginally improves the fit () and reduces the Fe K line width to eV (or km s-1). We note that, although loosely constrained both the centroid energy ( keV) and intensity (% of the Fe K intensity) of this component are in agreement with the expected values (Matt 2002; Yaqoob & Murphy 2011).
The main unexpected feature, which is detected in the HEG spectrum, is an absorption line ( for 2 d.o.f.), which is centered at keV with an EW of eV. Although weak, its energy is, within the errors, consistent with the rest frame energy of the resonance absorption line from Fe xxv ( keV), thus a possible origin of the line may be from a highly ionized absorber. We then explored its properties by replacing the Gaussian absorption line with a fully covering ionized absorber modeled with an xstar (Kallman et al. 2004) absorption grid that covers a wide range in ionization (log erg cm s-1) and ( cm-2). As the line is narrow we tested a grid that assumes a turbulence velocity of km s-1 and found that the absorption line is well reproduced by an absorber with cm-2and log erg cm s-1 with no net outflow velocity ( km s-1). This is consistent with an absorber located at distances larger than the typical disk winds (Gofford et al. 2015; Tombesi et al. 2012; Tombesi et al. 2013; Nardini et al. 2015; see also §4.2).
4 Discussion
The high resolution X-ray spectrum of the Compton thick state of NGC 7582 is characterized by an extremely low continuum level and is rich in
emission lines up to the Fe K band, which, as is seen in other highly obscured Seyferts, could originate in a photoionised gas that can be identified with the NLR gas (Sako et al. 2000; Kinkhabwala et al. 2002; Guainazzi & Bianchi 2007; Kallman et al. 2014). Commonly used diagnostics for the emitting regions, when high resolution spectra are available, are: the ratio between the forbidden and resonance components of the He-like triplets (Porquet & Dubau 2000), the detection of the radiative recombination continuum (RRC) transitions, the relative strength of the higher order transitions (Kinkhabwala et al. 2002) and the broadening of the line profiles. From these diagnostics we could in principle infer a first order estimate of the density, temperature (or ionization) and location of the emitting region in NGC 7582, but this technique requires a high signal to noise spectrum, in order to place stringent constraints on the line profiles and intensities. We also note that the interpretation of the line widths and ratios could be complicated if the emitting region is extended or the emission originates from a hybrid of a photoionised and collisionally ionized plasma. In the former case, the measured line widths could be artificially broadened as a result of the spatial extent of the emission, while the latter may result in a mixture of photoionized and collisionally ionized gas contributing to the forbidden and resonance lines of the He-like triplets.
However a complementary and important aid comes from the analysis of the high spatial resolution maps of the X-ray emission lines (like the He- and H-like O, Ne, Mg and Si) that can be obtained with Chandra.
This latter technique has been exploited for several nearby AGN, for which the narrow band Chandra images and their comparison with the optical and infrared images collected with HST (Bianchi et al. 2006; Wang et al. 2011) made it possible to map the location of the X-ray absorbers and/or emitters on size-scale of a few tens/hundreds of pc (e.g. NGC 4945, Marinucci et al. 2012; NGC 1365, Wang et al. 2009, NGC 3393 Maksym et al. 2016; NGC 7582, Bianchi et al. 2007). In particular these studies showed a correlation between the spatial distribution of the [O iii] emission and the soft X-ray maps, strengthening the hypothesis that the same photoionized gas is responsible for both the optical NLR and the soft X-ray emission lines.
As shown by B07, from the analysis of the archival (snapshot) ACIS-S imaging observations, the soft X-ray emission of NGC 7582 is extended and presents a complex morphology, which varies in different energy bands, possibly tracing a stratification in the ionization of the emitting region as well as the presence of a Compton thin absorber located at radial scales larger than the putative torus. By comparing the HST and soft X-ray images it was also inferred that this latter absorber is most likely associated with the dust lane of NGC 7582. Indeed the softer X-ray emission comes mostly from the regions of the galaxy that are less affected by the dust absorption. We note that B07 already showed that the soft X-ray emission is more extended than the starburst region and highly inhomogeneous (see Fig. 2 and Fig. 3 of B07) with two clear hotspots that cannot be directly associated with the location of the strongest star forming regions. This suggested that the origin of the spatially extended soft X-ray emission cannot be solely ascribed to a collisionally ionized gas and requires a medium photoionized by the central AGN.
4.1 The origin of the soft X-ray emission line component in NGC 7582
The properties of the emission lines that we detected in the HETG spectra of NGC 7582 confirm at first order the scenario derived from the analysis of the RGS data (P07), where the detection of the strong forbidden components in the He-like triplets together with the OVIII RRC suggested a strong contribution from a photoionised plasma. However, the
presence of both the forbidden and resonance components in the He-like triplets may indicate a possible hybrid of a collisional and photoionised plasma, making any line diagnostic ratios hard to interpret (i.e. in terms of density and temperature, see Porquet & Dubau 2000). Furthermore, the spatial extent of the soft X-ray emission of NGC 7582 (see B07) complicates the physical interpretation of the soft X-ray line widths in terms of their location of origin from the black hole. Therefore we investigated the spatial distribution of the soft X-ray emission, which when coupled with the line profiles could in principle allow us to infer the nature of the emitting gas. Thanks to the longer exposure of the new observation, with respect to the previous 20 ksec ACIS-S exposure, and the availability of the grating data, we can now create maps at higher energies than the ones investigated by B07 and compare them directly to the line emission observed in the high resolution spectra.
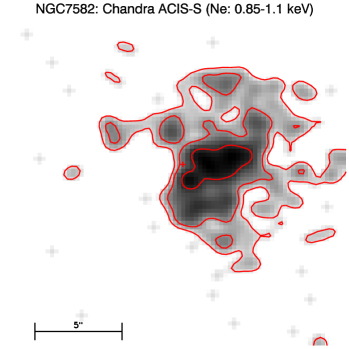
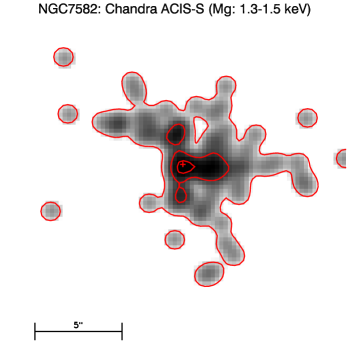
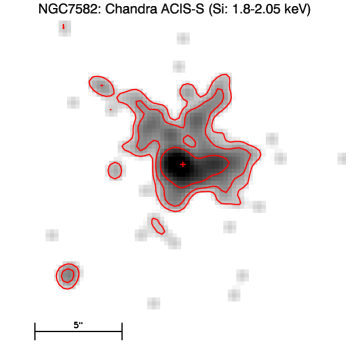
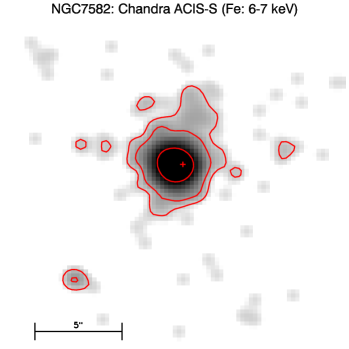
To explore this, we selected four relatively narrow bands centered on the most prominent emission line complexes; our main aim is to investigate if the spatial distribution of the emitting gas could explain some of the broad profiles that we see in the spectrum. For the analysis we considered the longest (173 ksec) of the current ACIS-S/HETG exposures and used the zeroth order to extract the images. We extracted four images of the central region in the following bands: keV (Ne ix-Ne x), keV (Mg xi-Mg xii), keV(Si xiii-Si xiv) and keV (Fe K). The four adaptively smoothed maps of the central regions are shown in Fig 6, where we overlay the contours to highlight the spatial distribution of the X-ray counts and mark the expected position of the nucleus as reported in NED (NASA/IPAC Extragalactic Database888http://ned.ipac.caltech.edu/). In all the images the X-ray emission of NGC 7582 appears to be extended over different size scales depending on the energy band. Even without extracting a radial profile, it is clear that the X-ray emission is extended beyond the Chandra PSF, whose on-axis Half Energy Width (HEW) is , as it is asymmetric in almost all the energy bands. Only the Fe-K band image is more symmetric and dominated by the central point-like source.
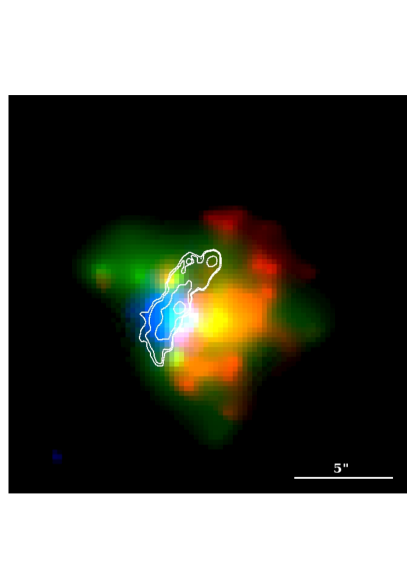
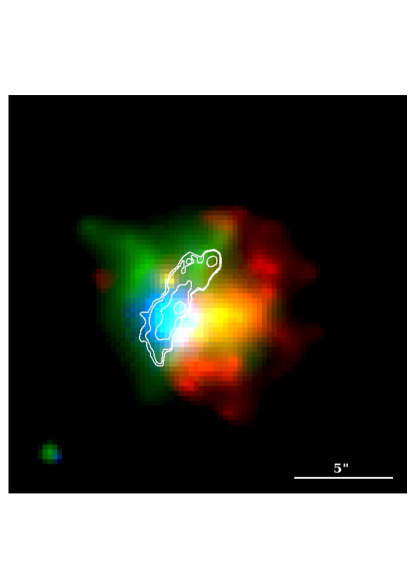
In Fig. 7 we show color composites of the adaptively smoothed images in different energy bands corresponding to Ne (red), Mg (green, left panel) or Si (green, right panel) and Fe (blue). These false color maps demonstrate that the Ne emission is more extended with respect to the Si (Mg) and Fe bands. Furthermore, we confirm that the peak of the emission is offset between the softer and harder images (Dong et al. 2004); while in the Fe-K band image the peak is almost centered on the nucleus, the Ne band emission is offset by , which corresponds to a projected distance of pc (for NGC 7582 corresponds pc). As already noted by B07 most of the softer (i.e. around the Ne band) X-ray emission comes from the west side of the galaxy and its asymmetric distribution can be explained with the presence of the dust lane which is in the north east direction. Diffuse X-ray emission on the west side of the hard X-ray nucleus appears in the Mg and Si energy ranges (see Fig 6 and Fig. 7). This is in agreement with the scenario proposed by B07, where the dust lane of NGC 7582 can obscure the X-ray emission below 1 keV, but it becomes thinner at higher energies. We note that the wide extension ( arcsec) of the Ne band emission (Fig 6, upper left panel) as well as the offset with respect to the nucleus, and thus the center of the grating extraction region, can possibly explain the non detection of the Ne ix and Ne x emission lines in the spectra as well as the low photon statistics below keV.
4.1.1 The Mg and Si emitter
From the modeling of the Mg emission lines (§ 3.2.1) we noted two main results: the lack of a significant detection of the forbidden component of the He-like triplet and a broadening of all the emission lines below 2 keV with a width of about eV. This latter result could explain why a thermal emission model fails to account for the soft X-ray lines, as the emission lines in the MEKAL model are narrower than those observed. The lack of a forbidden emission line could be interpreted in a scenario where the emission originates mainly in a collisionally ionized plasma or in high density hybrid gas ( cm-3) where the forbidden component is collisionally suppressed. However, taken at face value a broadening of km s-1, if interpreted as due to virial motion, would place this emitting gas at a distance of about pc ( M⊙; Wold et al. 2006) corresponding to the outer BLR, which is at odds with the extended nature of the soft X-ray emission. To reconcile these results we note that the extension seen in the Mg xi-xii map over (see Fig 6, upper right panel) can explain the line profiles detected in the MEG spectrum, as one of the main consequences of the diffuse emission is a degradation of the spectral resolution of the grating spectra999See Fig. 8.23 of the Chandra Proposer’s Observatory Guide; http://cxc.harvard.edu/proposer/POG/. Assuming a source size of , the spectral resolution of the MEG at the energy of the Mg xi and Mg xii, is degraded down to (i.e. by a factor of 10 with respect to a point like source), which corresponds to an apparent line broadening of eV. This can easily account for the line widths observed in the Mg band. Thus the widths of the Mg xi and Mg xii emission lines (see Table 2) can not be directly interpreted as due to a velocity broadening as they are most likely an artifact of the spatial broadening. We thus conclude that a strong contribution to the Mg emission lines is from a diffuse and collisionally ionized gas, as this could explain the strong resonance line from Mg xi and the relative weakness of the forbidden component.
Our spectral deconvolution of the Si xiii and Si xiv He-like triplets revealed that the emission lines are again resolved with a similar km s-1 and with a slightly stronger contribution from the forbidden with respect to the resonant component (see Table 6 and 7). This suggests that we are dealing with an hybrid plasma, where the density is less than the critical value of cm-3, for which the forbidden component would be collisionally suppressed. Furthermore, even if the large uncertainties on the lines intensities do not allow us to derive more stringent constraints, the detection of the strong forbidden component suggests a contribution from a photoionised gas to the forbidden emission. The map for the Si band shows that the emission is slightly less extended (over ) and more centered on the nucleus and also more symmetric than the Ne and Mg emission. However, also in this case the source size corresponds to an apparent line broadening in the MEG and HEG data similar to the measured widths.
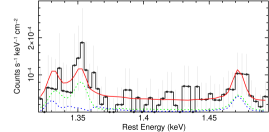
We then attempted to quantify how much of the line emission may originate from a collisionally ionized plasma. In particular we tested whether it was possible to account for most of the Mg xi and Si xiii triplets with a collisionally ionized emission model, thus we replaced these Gaussian lines with a MEKAL component. We accounted for the measured line widths of eV by convolving the thermal line emission with a Gaussian broadening (via the gsmooth model in xspec). Although this model is statistically worse ( for 6 d.o.f) with respect to the Gaussian emission line best-fit model, it can formally account for the Mg xi triplet, while for the Si xiii complex we still need a strong contribution from a photoionised gas, indeed we still require an additional strong forbidden line (see Fig. 8). We note that the derived mekal temperature is typical of a starburst emission ( keV). Its flux ( erg cm-2 s-1) is in agreement with the flux of the diffuse component measured in the previous Chandra imaging observations after the removal of the central nuclear source (LaMassa et al. 2012). The soft X-ray luminosity ( erg s-1) is also in agreement with the expectation from the infrared luminosity of NGC 7582 ( erg s-1, Taniguchi & Ohyama 1998) and the relations derived from the X-ray observations of several starburst galaxies (Ranalli et al. 2003; Mineo et al. 2012; Pereira-Santaella et al. 2011). In particular, assuming that most of the infrared luminosity can be ascribed to the star formation activity, a erg s-1 implies a star formation rate (SFR) of about /yr (Kennicutt 1998) for which the relations would then predict a soft X-ray luminosity of erg s-1.
4.1.2 The location and density of the emitting gas
From the normalization of the thermal component ( cm-5) we can now derive a first order estimate of the plasma density (). Indeed, by definition, the normalization of the MEKAL model is proportional to the volume emission measure () of the X-ray emitting gas with cm-5, where is the angular-diameter distance to the source and is the redshift. We assumed that the gas extends for pc (as derived from the soft X-ray images) and derived a density of cm-3 for a uniform spherically symmetric gas distribution. For an inhomogeneous gas with emitting clumps with a reasonable size scale of (corresponding to a volumetric filling factor of ) the density will be higher and of order of cm-3.
To derive a first order estimate of the location and density of the photoionised emitter that is responsible for the soft X-ray emission lines, or at least the forbidden ones, we replaced the soft X-ray Gaussian emission lines with an xstar emission model and then fitted the Mg and Si emission lines. This model assumes a turbulence velocity of km s-1 to account for the residual broadening. We considered only the MEG data as in the energy range of interest ( keV) the HEG data have a lower S/N; the resulting best fits of the Mg xi and Si xiii He-like triplets are shown in Fig. 9. The ionization of this photoionized emitter is log erg cm s-1and its normalization is , for a column density of cm-2. The temperature of the thermal emission component is again keV and its soft X-ray luminosity is erg s-1, which would correspond to approximately 60% of the observed soft X-ray luminosity ( erg s-1). However this latter estimate must be considered as an upper limit; due to the lack of enough S/N below 1 keV we cannot exclude the presence in the model of a lower ionization photoionized emitter, which could be responsible for the diffuse emission seen at the energy of the Ne emission lines.
In terms of the photoionized gas properties, a first order estimate of its density and covering factor can be derived from the xstar component normalization. For a shell of gas photoionized by a central source, the normalization of the emission component, , is defined as (Kallman et al. 2004), where is the ionizing luminosity over the Rydberg range in units of erg s-1, is the distance to the source in kpc and is a geometrical factor of the emitting region with respect to a uniform shell covering a solid angle . As NGC 7582 was observed in a highly obscured state, before deriving the intrinsic luminosity we need to consider the Compton-down scattering effect that can be important at this level of obscuration (Murphy & Yaqoob 2009). We thus included in the best-fit model an additional absorber (CABS model in XSPEC) with the same column density of the neutral absorber to correct for it and derived an upper limit on the intrinsic ionizing luminosity of erg s-1. Thus for the above ionizing luminosity and the distance of NGC 7582 ( Mpc), assuming a fully covering spherical shell we derive . For a given column density the measured normalization provides then a first order estimate of the covering factor of the emitting gas. Thus assuming a column density as above of cm-2 the ratio between the observed () and predicted normalizations gives a covering factor . We then fixed the column density to a higher value of cm-2 and derived a covering factor of only 4%, which is probably too low given the spatial extent of the soft X-ray emission. Similarly a lower limit of cm-2 on the gas density was obtained by fixing the normalization of the emitting component to the predicted value for a fully covering shell and allowing the to vary.
An estimate of the location and density of the emitter can be then obtained using the definition of the ionization parameter ; where is the intrinsic ionizing luminosity over the Rydberg range and is the gas density. Then assuming again a typical size of the emitting region of few hundred pc, we derived a gas density of about cm-3. Alternatively assuming that the gas is not highly clumped (i. e. ) and the lower limit on the column density derived above, we can estimate a distance of cm, which is consistent with the location of the diffuse emission seen in the X-ray images, and a density of order of cm-3. Although these are an order of magnitude estimates, the similarity of the derived densities suggests that the gas is not highly clumped.
Indeed, if the gas were too clumped () the density of the single clouds would be much higher, thus to maintain the same ionization balance, as measured with the xstar best-fit model, the distance would be as low as few parsec, which is inconsistent with the X-ray images. Thus the most likely scenario is that the emission line component originates in a high-ionization and low-density gas ( cm-3) which is extended on scales of few hundreds pc. The column density of this gas is low and in the range of cm-2and has a rather high covering factor.
A plausible scenario is thus that some of the soft X-ray emission lines are produced in star forming regions, which are embedded in a larger scale gas which is photoionised in part by the central AGN and in part by the circumnuclear starburst itself. A similar scenario has been proposed for other highly obscured Seyfert 2, where both high spectral and spatial resolution data were available (i.e. Mrk 573, Bianchi et al. 2010 NGC 1365, Wang et al. 2009; NGC 4151, Wang et al. 2011).
4.2 The Fe K band
As discussed in §3.2.4 the measured keV (with respect to the reflection component) of the Fe K emission line is consistent with the presence of an optically thick absorber. At the energy of the Fe K band the emission map is almost consistent with a point like source, with the exception of a weak elongation in the northern direction (see Fig. 6). We can thus treat the Fe K emission line width as intrinsic to the source and attempt to place some constraints on the location of the emitter/absorber. We assumed that the broadening is due to Keplerian motion of the emitter and adopted a factor to correct the observed FWHM for the geometry of the emitting gas (Netzer & Marziani 2010). Thus for a M⊙ (Wold et al. 2006) the measured km s-1 would correspond to a distance of pc. The lower and upper limits on the radial distance would place the emitting gas at the distance of the outer BLR and the pc-scale torus, respectively. The derived limits for the Fe-K emitter correspond to few, which is in agreement with the typical location of , derived for a sample of nearby Seyfert 2 which had HETG observations (Shu et al. 2011).
From previous X-ray observations of NGC 7582 (P07; B09; Rivers et al. 2015b) two circum-nuclear absorbers co-exist in NGC 7582: one could be identified with the parsec scale torus and one is responsible for the fast variations and is most likely located at the BLR distance. However, the measured intensity of the Fe K emission line ph cm-2 s-1 is in agreement with the historical value measured in the X-ray observations of NGC 7582 performed over the last 10 years ( ph cm-2 s-1), which show that both the Compton reflection component and the Fe K emission line do not vary. We thus conclude the Fe K emission line properties are consistent with reflection from the inner edge of a Compton thick toroidal absorber (Murphy & Yaqoob 2009), which is most likely located at a subpc-, pc-scale distance from the central SMBH.
As we noted in §3.2.4 a weak absorption feature is detected at keV, which could be associated with the presence of an ionized absorber. The energy centroid of this absorption is close to the expected energy of the Fe xxv resonance transition and does not require any blueshift. This suggests that the absorber is not part of a disk wind and is located further out than the typical location of few hundreds of the disk winds (Gofford et al. 2015; Tombesi et al. 2012; Tombesi et al. 2013; Nardini et al. 2015). Furthermore, the detection of this absorber when NGC 7582 is in a Compton thick state would naturally argue for a location outside the variable absorber located at the BLR distance. We can derive an estimate of the maximum distance of this absorber using again the definition of the ionization parameter ; where is the intrinsic ionizing luminosity over the Rydberg range and is the absorber density. Thus for the NGC 7582 ionizing luminosity of erg s-1, assuming that the absorber thickness is less than its distance (i.e. ) and given the ionization parameter log erg cm s-1 and cm-2 we found cm, which is on the same scale of the Fe K emitting region. At this distance and again assuming a radial extent of the absorbing clouds of the gas density is cm-3. Although these are all first order estimates, the derived density and distance are all suggestive that this absorber is the putative electron scattering region (Krolik & Kriss 2001; Netzer 2015 and references therein), which can be associated to the inner part of the torus. On the other hand the thick absorber could be associated with clumps within the pc-scale torus, which could vary on time-scale from weeks to months.
5 Summary and Conclusion
We presented the results of a detailed analysis of a deep ( ksec) Chandra HETG observation of NGC 7582, when the AGN was in a prolonged highly obscured state with a column density in the Compton thick regime (cm-2). Thanks to the combination of the high spectral and spatial resolution of the Chandra data we have gained more insight in the structure for the circum-nuclear emitter/absorbers of NGC 7582. As seen in other well studied nearby Seyfert 2s and in particular for the prototype of the “Changing look” AGN NGC 1365 (Braito et al. 2014; Nardini et al. 2015b; Rivers et al. 2015a; Risaliti 2016), it is now clear that also in NGC 7582 the absorbing/emitting circum-nuclear gas is not a single homogeneous gas but it is most likely a multiphase medium, located at different distances from the sub-pc BLR region to the larger scale galactic absorber.
The main results on the different emitting/absorbing zones and their location, as obtained with this new observation of NGC 7582 can be summarized as follows:-
-
•
From the Fe K emission line width and the presence in all the observations of a relatively constant reflection component, we know that a pc scale reprocessor is present. This could be associated with the inner edge of the putative pc-scale clumpy torus. As NGC 7582 is not always absorbed by the Compton thick absorber, our line of sight is not totally obscured by this reprocessor. Indeed, in past observations (B09) we were able to witness fast variations due to an innermost absorber located at the BLR distance.
-
•
A highly ionized absorber, responsible for the absorption feature detected at keV, is present on a similar distance to the Fe K emitter and could be identified with the putative electron scattering region.
-
•
Some of the strong soft X-ray emission lines, in particular the forbidden components, originate in photoionzed emitting gas that can be associated with the extended and low density ( cm-3) NLR gas. From the Sixiii-xiv image we know that this photoionized gas is extended, on size-scales of pc. Furthermore, a comparison with the Ne ix and Mg xi narrow band images shows that this gas is less extended than the emitting regions where the Ne and Mg emissions originate.
-
•
An extended thermal gas is present on large scales (few hundreds pc) and is probably associated with the strong Ne and Mg emission. This gas is required to explain the strong resonance components and could be ionized by the circum-nuclear star formation activity.
-
•
A larger scale Compton-thin absorber obscures part of the emission below 1 keV, as seen in the asymmetric map of the Ne band emission. As already suggested by B07 this absorber is presumably associated with the galactic dust lane east of the nucleus.
Although only few “changing look” AGN and Seyfert 2 galaxies have been observed long enough with both high spatial and spectral resolution it is now clear that “Changing look” AGN like NGC 1365 and NGC 7582 have a favorable line of sight such as we can view all the stratification of these absorbers/emitters. Our results show that future deep grating observations of nearby “changing look” and Seyfert 2 AGN performed with Chandra will offer a unique opportunity to map all these emitters and absorbers. This will allow us to build up a more complete picture of the AGN environment and allow us to improve the Unification Model of AGN.
Acknowledgements.
We would like to thank the anonymous referee for useful comments, which have improved this paper. This paper has made use of observations obtained with the Chandra X-ray Observatory. This research has made use of software provided by the Chandra X-ray Center (CXC) in the application packages CIAO. J.N. Reeves and V. Braito acknowledge Chandra grant GO4-15101X and support from NASA grant NNX15AF12G. J. N. Reeves and E. Nardini acknowledge support of the STFC consolidated grant. E. Nardini acknowledges funding from the European Union’s Horizon 2020 research programme under the Marie Skodowska-Curie grant agreement No. 664931. This research has made use of the NASA/IPAC Extragalactic Database (NED) which is operated by the Jet Propulsion Laboratory, California Institute of Technology, under contract with the National Aeronautics and Space Administration.References
- Antonucci (1993) Antonucci, R. 1993, ARA&A, 31, 473
- Arnaud (1996) Arnaud, K. A. 1996, Astronomical Data Analysis Software and Systems V, 101, 17
- Aretxaga et al. (1999) Aretxaga, I., Joguet, B., Kunth, D., Melnick, J., & Terlevich, R. J. 1999, ApJ, 519, L123
- Bianchi et al. (2006) Bianchi, S., Guainazzi, M., & Chiaberge, M. 2006, A&A, 448, 499
- Bianchi et al. (2007) Bianchi, S., Chiaberge, M., Piconcelli, E., & Guainazzi, M. 2007, MNRAS, 374, 697
- Bianchi et al. (2009) Bianchi, S., Piconcelli, E., Chiaberge, M., et al. 2009, ApJ, 695, 781
- Bianchi et al. (2010) Bianchi, S., Chiaberge, M., Evans, D. A., et al. 2010, MNRAS, 405, 553
- Bianchi et al. (2012) Bianchi, S., Maiolino, R., & Risaliti, G. 2012, Advances in Astronomy, 2012,
- Boldt (1987) Boldt, E. 1987, Phys. Rep, 146, 215
- Braito et al. (2014) Braito, V., Reeves, J. N., Gofford, J., et al. 2014, ApJ, 795, 87
- Dickey & Lockman (1990) Dickey, J. M., & Lockman, F. J. 1990, ARA&A, 28, 215
- Dong et al. (2004) Dong, H., Xue, S.-J., Li, C., & Cheng, F.-Z. 2004, Chinese J. Astron. Astrophys., 4, 427
- Fruscione et al. (2006) Fruscione, A., et al. 2006, Proc. SPIE, 6270
- Garmire et al. (2003) Garmire, G. P., Bautz, M. W., Ford, P. G., Nousek, J. A., & Ricker, G. R., Jr. 2003, Proc. SPIE, 4851, 28
- Gilli et al. (2000) Gilli, R., Maiolino, R., Marconi, A., et al. 2000, A&A, 355, 485
- Gruber et al. (1999) Gruber, D. E., Matteson, J. L., Peterson, L. E., & Jung, G. V. 1999, ApJ, 520, 124
- Gofford et al. (2015) Gofford, J., Reeves, J. N., McLaughlin, D. E., et al. 2015, MNRAS, 451, 4169
- Green et al. (1993) Green, A. R., McHardy, I. M., & Lehto, H. J. 1993, MNRAS, 265, 664
- Guainazzi et al. (1998) Guainazzi, M., Nicastro, F., Fiore, F., et al. 1998, MNRAS, 301, L1
- Guainazzi et al. (2002) Guainazzi, M., Matt, G., Fiore, F., & Perola, G. C. 2002, A&A, 388, 787
- Guainazzi & Bianchi (2007) Guainazzi, M., & Bianchi, S. 2007, MNRAS, 374, 1290
- Kallman et al. (2004) Kallman, T. R., Palmeri, P., Bautista, M. A., Mendoza, C., & Krolik, J. H. 2004, ApJS, 155, 675
- Kallman et al. (2014) Kallman, T., Evans, D. A., Marshall, H., et al. 2014, ApJ, 780, 121
- Kennicutt (1998) Kennicutt, R. C., Jr. 1998, ApJ, 498, 541
- Kinkhabwala et al. (2002) Kinkhabwala, A., et al. 2002, ApJ, 575, 732
- Kokubun et al. (2007) Kokubun, M., et al. 2007, PASJ, 59, 53
- Koyama et al. (2007) Koyama, K., et al. 2007, PASJ, 59, 23
- Krolik & Kriss (2001) Krolik, J. H., & Kriss, G. A. 2001, ApJ, 561, 684
- LaMassa et al. (2012) LaMassa, S. M., Heckman, T. M., & Ptak, A. 2012, ApJ, 758, 82
- Magdziarz & Zdziarski (1995) Magdziarz, P., & Zdziarski, A. A. 1995, MNRAS, 273, 837
- Maksym et al. (2016) Maksym, W. P., Fabbiano, G., Elvis, M., et al. 2016, ApJ, 829, 46
- Maiolino et al. (2010) Maiolino, R., Risaliti, G., Salvati, M., et al. 2010, A&A, 517, A47
- Markert et al. (1994) Markert, T. H., Canizares, C. R., Dewey, D., McGuirk, M., Pak, C. S., & Schattenburg, M. L. 1994, Proc. SPIE, 2280, 168
- Marinucci et al. (2012) Marinucci, A., Risaliti, G., Wang, J., et al. 2012, MNRAS, 423, L6
- Markowitz et al. (2014) Markowitz, A. G., Krumpe, M., & Nikutta, R. 2014, MNRAS, 439, 1403
- Masini et al. (2016) Masini, A., Comastri, A., Puccetti, S., et al. 2016, arXiv:1609.00374
- Matt (2002) Matt, G. 2002, MNRAS, 337, 147
- Matt et al. (2003) Matt, G., Guainazzi, M., & Maiolino, R. 2003, MNRAS, 342, 422
- McHardy (1985) McHardy, I. 1985, Space Sci. Rev., 40, 559
- Mewe et al. (1985) Mewe, R., Gronenschild, E. H. B. M., & van den Oord, G. H. J. 1985, A&AS, 62, 197
- Mitsuda et al. (2007) Mitsuda, K., et al. 2007, PASJ, 59, 1
- Mineo et al. (2012) Mineo, S., Gilfanov, M., & Sunyaev, R. 2012, MNRAS, 419, 2095
- Murphy & Yaqoob (2009) Murphy, K. D., & Yaqoob, T. 2009, MNRAS, 397, 1549
- Nardini et al. (2015) Nardini, E., Reeves, J. N., Gofford, J., et al. 2015, Science, 347, 860
- Nardini et al. (2015b) Nardini, E., Gofford, J., Reeves, J. N., et al. 2015b, MNRAS, 453, 2558
- Netzer & Marziani (2010) Netzer, H., & Marziani, P. 2010, ApJ, 724, 318
- Netzer (2015) Netzer, H. 2015, ARA&A, 53, 365
- Pereira-Santaella et al. (2011) Pereira-Santaella, M., Alonso-Herrero, A., Santos-Lleo, M., et al. 2011, A&A, 535, A93
- Piconcelli et al. (2007) Piconcelli, E., Bianchi, S., Guainazzi, M., Fiore, F., & Chiaberge, M. 2007, A&A, 466, 855
- Porquet & Dubau (2000) Porquet, D., & Dubau, J. 2000, A&AS, 143, 495
- Ranalli et al. (2003) Ranalli, P., Comastri, A., & Setti, G. 2003, A&A, 399, 39
- Risaliti et al. (2002) Risaliti, G., Elvis, M., & Nicastro, F. 2002, ApJ, 571, 234
- Risaliti et al. (2005) Risaliti, G., Elvis, M., Fabbiano, G., Baldi, A., & Zezas, A. 2005, ApJ, 623, L93
- Risaliti et al. (2007) Risaliti, G., Elvis, M., Fabbiano, G., et al. 2007, ApJ, 659, L111
- Risaliti et al. (2009) Risaliti, G., et al. 2009, MNRAS, 393, L1
- Risaliti (2016) Risaliti, G. 2016, Astronomische Nachrichten, 337, 529
- Rivers et al. (2015a) Rivers, E., Risaliti, G., Walton, D. J., et al. 2015, ApJ, 804, 107
- Rivers et al. (2015b) Rivers, E., Baloković, M., Arévalo, P., et al. 2015b, ApJ, 815, 55
- Sako et al. (2000) Sako, M., Kahn, S. M., Paerels, F., & Liedahl, D. A. 2000, ApJ, 543, L115
- Shu et al. (2011) Shu, X. W., Yaqoob, T., & Wang, J. X. 2011, ApJ, 738, 147
- Spergel et al. (2003) Spergel, D. N., et al. 2003, ApJS, 148, 175
- Takahashi et al. (2007) Takahashi, T., et al. 2007, PASJ, 59, 35
- Taniguchi & Ohyama (1998) Taniguchi, Y., & Ohyama, Y. 1998, ApJ, 507, L121
- Tombesi et al. (2012) Tombesi, F., Cappi, M., Reeves, J. N., & Braito, V. 2012, MNRAS, 422,L1
- Tombesi et al. (2013) Tombesi, F., Cappi, M., Reeves, J. N., et al. 2013, MNRAS, 430, 1102
- Torricelli-Ciamponi et al. (2014) Torricelli-Ciamponi, G., Pietrini, P., Risaliti, G., & Salvati, M. 2014, MNRAS, 442, 2116
- Turner et al. (2000) Turner, T. J., Perola, G. C., Fiore, F., et al. 2000, ApJ, 531, 245
- Turner & Miller (2009) Turner, T. J., & Miller, L. 2009, A&A Rev., 17, 47
- Wang et al. (2009) Wang, J., Fabbiano, G., Elvis, M., et al. 2009, ApJ, 694, 718
- Wang et al. (2011) Wang, J., Fabbiano, G., Elvis, M., et al. 2011, ApJ, 736, 62
- Wold et al. (2006) Wold, M., Lacy, M., Käufl, H. U., & Siebenmorgen, R. 2006, A&A, 460, 449
- Xue et al. (1998) Xue, S.-J., Otani, C., Mihara, T., Cappi, M., & Matsuoka, M. 1998, PASJ, 50, 519
- Yaqoob & Murphy (2011) Yaqoob, T., & Murphy, K. D. 2011, MNRAS, 412, 277