Spiral Arms, Infall, and Misalignment of the Circumbinary Disk from the Circumstellar Disks in the Protostellar Binary System L1551 NE
Abstract
We report the ALMA Cycle 2 observations of the Class I binary protostellar system L1551 NE in the 0.9-mm continuum, C18O (3-2), 13CO (3–2), SO (78-67), and the CS (7–6) emission. At 018 (= 25 AU) resolution, 4-times higher than that of our Cycle 0 observations, the circumbinary disk as seen in the 0.9-mm emission is shown to be comprised of a northern and a southern spiral arm, with the southern arm connecting to the circumstellar disk around Source B. The western parts of the spiral arms are brighter than the eastern parts, suggesting the presence of an spiral mode. In the C18O emission, the infall gas motions in the inter-arm regions and the outward gas motions in the arms are identified. These observed features are well reproduced with our numerical simulations, where gravitational torques from the binary system impart angular momenta to the spiral-arm regions and extract angular momenta from the inter-arm regions. Chemical differentiation of the circumbinary disk is seen in the four molecular species. Our Cycle 2 observations have also resolved the circumstellar disks around the individual protostars, and the beam-deconvolved sizes are 029 019 (= 40 26 AU) (P.A. = 144) and 026 020 (= 36 27 AU) (P.A. = 147) for Sources A and B, respectively. The position and inclination angles of these circumstellar disks are misaligned with that of the circumbinary disk. The C18O emission traces the Keplerian rotation of the misaligned disk around Source A.
=1 \fullcollaborationNameThe Friends of AASTeX Collaboration
1 Introduction
Binary formation is likely a primary mode of solar-type star formation, since most (50) solar-type stars Duquennoy & Mayor (1991); Raghavan et al. (2010) and protostellar sources Murillo et al. (2013); Chen et al. (2013); Reipurth et al. (2014); Tobin et al. (2016) are members of binaries. Protostellar binaries have been identified as pairs of circumstellar disks (hereafter CSDs) surrounding each protostar Looney et al. (2000); Lim & Takakuwa (2006); Maury et al. (2010); Tobin et al. (2015, 2016); Lim et al. 2016a ; Lim et al. 2016b . In a number of protostellar binaries, circumbinary disks (hereafter CBDs) surrounding both of the CSDs have also been identified Takakuwa et al. (2004, 2012); Tobin et al. (2013); Chou et al. (2014); Tang et al. (2014, 2016); Dutrey et al. (2014, 2016). Since CBDs can act as mass reservoirs to the protostellar binaries, observational studies of internal structures and gas motions in CBDs are crucial to understand how protostellar binaries grow, and how their final masses and mass ratios are determined.
In CBDs, tidal torques by orbiting protostellar binaries can clear the material and create gaps within the disks. At the same time, the non-axisymmetric gravitational potential from the binary (i.e., Roche potential), induces both inward and outward gas motions with slower and faster rotations respectively, as compared to the standard Keplerian rotations. This results in spiral density patterns in the CBDs. Previous theoretical studies of CBDs around protostellar binaries predict such spiral-arm structures and non-axisymmetric rotating and infalling gas motions Bate (2000); Günther & Kley (2002); Ochi et al. (2005); Hanawa et al. (2010); Demidova & Shevchenko (2015); Young et al. (2015). Observational identifications of such spiral-arm features and infalling motions toward the protostellar binaries in the CBDs, are essential to understand the growth mechanism of protostellar binaries. It is also important to measure the gas distribution and gas motions between the CBD and CSDs, in order to understand the transfer of material from the CBD to the CSDs.
Our group has been conducting a series of SMA, ASTE, and ALMA studies of the Class I protostellar binary L1551 NE, located in the L1551 region at a distance =140 pc Takakuwa & Kamazaki (2011); Takakuwa et al. (2012, 2013, 2014, 2015). The source bolometric temperature and luminosity are = 91 K and = 4.2 Froebrich (2005). The projected binary separation and the position angle are 70 AU and 120. The south-eastern source is referred to as “Source A”, and the north-western source as “Source B” Reipurth et al. (2000, 2002); Lim et al. 2016b . Our previous SMA observations of L1551 NE have identified a 300 AU-scale CBD, where the gas motions can be modeled satisfactorily with a circular Keplerian rotation with the central stellar mass of 0.8 Takakuwa et al. (2012). The Keplerian CBD is surrounded by a 1000 AU-scale infalling envelope Takakuwa et al. (2013). A larger scale (20000 AU) molecular envelope is also seen, which appears to be dispersed by the interaction with the redshifted outflow driven from the neighboring protostar L1551 IRS 5 Takakuwa et al. (2015).
In the 0.9-mm dust-continuum emission, our ALMA Cycle 0 observations of L1551 NE at a 07 resolution, resolved the structure of the CBD and separated the CBD and the two CSDs. In the C18O (3–2) emission, deviations of the gas motion from the Keplerian rotation in the CBD are also identified. To compare with our data, we produced model ALMA Cycle 0 images from our hydrodynamic simulations. The simulated images show that the observed CBD structures can be interpreted as two spiral arms, and that the observed gas motions can be interpreted as expanding and infalling gas motions in the arm and inter-arm regions, respectively. This is because gravitational torques from the central binary system impart angular momenta to the spiral-arm regions and extract angular momenta from the inter-arm regions.
However, the Cycle 0 resolution was still too coarse to fully characterize the spiral-arm structures, the gas motions within the spiral-arm and inter-arm regions, and within the circumstellar disks. Here, we present our ALMA Cycle 2 observations of L1551 NE at a 4-times higher spatial resolution, as compared to the Cycle 0 observations. In Section 2 of the present paper, we describe our experiment, the data reduction and imaging, and our numerical simulations to be compared with the observed features. In Section 3, we present the results on the 0.9-mm dust-continuum and C18O (=3–2) emission. We have successfully resolved the spiral structures of the CBD and identified gas motions in the spiral-arm and inter-arm regions. We have also resolved the structure of the individual CSDs and identified the gas motions in the CSDs. In Section 4, we present physical interpretations of the observed features, and the related issues of studies of protostellar binaries. Section 5 provides a concise summary of our main results and discussion.
2 Methods
2.1 ALMA Observations
Our ALMA observations of L1551 NE were made on 2015 June 27. Four molecular lines in Band 7, that is, the C18O (=3-2; 329.3305453 GHz), the 13CO (=3-2; 330.587965 GHz), the SO (=78-67; 340.71416 GHz), and the CS (=7-6; 342.882857 GHz) lines, as well as the 0.9-mm dust-continuum emission, were observed simultaneously. The precipitable water in the atmosphere was 0.55 – 0.61 mm, an excellent condition during the Band 7 observations. Excluding overheads for calibration, the total time on source was 34 minutes. Table 1 summarizes the observational parameters. The number of the available antennae was 36, but due to the correlator problem it was 35 for the SO and CS lines as well as the corresponding continuum. The C34-7/(6) configuration was adopted, which provides the minimum and maximum baseline lengths of 33.7 m and 1.6 km, respectively. The projected baseline length on the source ranges from 29 m to 1575 m. The minimum projected baseline length implies that the present ALMA observation can recover 50 of the peak flux for a Gaussian emission distribution with a FWHM of 28 (390 AU), and 10 with a FWHM of 52 (730 AU) Wilner & Welch (1994). Thus, the present ALMA observation is sensitive to the structures of the CBD with its outermost radius of 300 AU (21) around L1551 NE, while largely insensitive to its surrounding envelope structures with the outermost extent of 20000 AU (143) Takakuwa et al. (2015).
In its Frequency Division Mode (FDM), the ALMA correlator was configured to provide four independent spectral windows (Basebands), each having a bandwidth of 468.75 MHz and one of the four observed molecular lines. The spectral window for the C18O line was divided into 3840 channels, with each channel having a width of 122.07 kHz. Hanning smoothing was applied to the spectral channels, resulting in a frequency resolution of 244.14 kHz and hence a velocity resolution of 0.22 km s-1 for the C18O line. Due to the limitation of the incoming data rate, the number of spectral channels and hence the frequency resolution, had to be degraded by a factor of 2 and 4 for the other spectral windows. The resultant velocity resolutions are 0.44 km s-1, 0.86 km s-1, and 0.85 km s-1 for the 13CO, SO, and the CS lines, respectively. In the following, we will use the higher-resolution C18O line to discuss the velocity structures of the CBD and CSDs in L1551 NE. Channels in all four spectral windows, which are devoid of line emission, were used to create the continuum image, which has a central frequency of 335.85 GHz (= 0.893 mm) and a total bandwidth of 1.845 GHz.
Calibration of the raw visibility data was performed by the ALMA observatory through the pipeline using the Common Astronomy Software Applications (CASA) version 4.2.2. The quasar J0510+180, with estimated flux of 2.4 Jy, was adopted as the gain and absolute flux calibrators. The quasar J0423-0120 was adopted as the passband calibrator. We checked the tables of the pipeline calibration as well as the calibrated visibility data. We confirmed that the calibration was fine except for the presence of one integration of L1551 NE with unreasonably high amplitudes, which we flagged manually before the imaging process. We did not perform self-calibration, since the signal-to-noise ratio of the present ALMA data is high. The calibrated visibility data were then Fourier-transformed and CLEANed to create the continuum and molecular-line images. For the molecular line imaging, Natural weighting of the visibility data was adopted to enhance sensitivity. For the continuum imaging, various weighting of the visibility data were tried. The continuum image with the Natural weighting is used to investigate the structures of the CBD. The continuum images with uniform weighting, and with restriction of baselines longer than 450 m, resulted in higher resolutions, were used to resolve and study the structures of the CSDs. Corresponding angular resolutions are listed in Table 1.
2.2 Numerical Simulations
To interpret the structures and kinematics of the CBD observed with the present ALMA observation, we adopt the hydrodynamical numerical simulation using adaptive mesh refinement (AMR) code SFUMATO Matsumoto (2007). These simulations had reproduced very well the previous results of the ALMA Cycle 0 observation, as described by Takakuwa et al. (2014). We adopted the same model parameters as those in Takakuwa et al. (2014), except for the orbital time in the simulation, in order to extract the simulation data and to create the model images. As described below, in our new Cycle 2 image of the 0.9-mm continuum emission, it is clear that the western part is much brighter than the eastern part. Such a one-sided, non-point-symmetric distribution of materials, is regarded as an mode, which is distinct from an mode of two identical spiral arms. Our numerical simulation shows that after 20 orbital periods such an mode is well-developed and is present continuously until the end of the simulation (250 orbital periods). This mode has not been explicitly reported in the previous theoretical simulations of CBDs Bate (2000); Günther & Kley (2002); Ochi et al. (2005); Hanawa et al. (2010); Demidova & Shevchenko (2015); Young et al. (2015), but its presence in the observed ALMA image as well as in our long-term numerical simulation, suggests its ubiquity. Here, we have adopted the simulation result at the 73rd orbital period of the binary, which appears to best resemble the observed 0.9-mm dust-continuum image.
The output from the numerical simulation was transferred to the radiative transfer calculations, and the theoretically predicted 0.9-mm dust-continuum and C18O (3–2) images were constructed on the assumptions of the LTE condition. Details of the radiative transfer calculations are also described by Takakuwa et al. (2014). We then performed CASA observing simulations and created simulated visibility data for the model images with the same antenna configuration, hour angle coverage, bandwidth and frequency resolution, and integration time as those of the real observation. We further performed flagging of the simulated data to match the simulated data with the real processed data. We then made simulated theoretical images with the same imaging methods as those of the real data. The weather parameters of the observing simulations were also adjusted to match the real image noise levels. In the radiative transfer calculations, the adopted dust mass opacity and the C18O abundance are = 0.053 cm2 g-1 and = 1.7 10-7, respectively. The temperature profile is adopted to be , where and indicate the distance from Sources A and B, respectively. The gas number density at the outermost boundary = 1740 AU is set to be 1.5 105 cm-3. These parameters were originally derived from our fine tuning to match the outputs from the radiative transfer calculations and the observing simulation with the real observed Cycle 0 images. We confirmed that the same parameters reproduce the observed Cycle 2 images reasonably well, and thus no further fine tuning of these parameters was made.
| Parameter | Value |
|---|---|
| Observing date | 2015 Jun. 27 |
| Number of antennas | 36aaFor the SO and CS lines as well as the corresponding continuum, the available number of antennas is 35. |
| Field Center | (04h31m445, 18083167) (J2000) |
| Primary beam HPBW | 18 |
| Central Frequency (Continuum) | 335.85 GHz |
| Bandwidth (Continuum) | 1.845 GHz |
| Frequency resolution (C18O) | 244.14 kHz 0.22 km s-1 |
| Synthesized beam HPBW (Continuum; Natural) | 01900169 (P.A. = 178.1) |
| Synthesized beam HPBW (Continuum; Uniform) | 01340123 (P.A. = 12.3) |
| Synthesized beam HPBW (Continuum; 450 m, Uniform) | 01190105 (P.A. = 10.2) |
| Synthesized beam HPBW (C18O) | 01950168 (P.A. = 10.0) |
| Projected baseline coverage | 29 - 1575 m |
| Conversion Factor (Continuum; Natural) | 1 (Jy beam-1) = 338.0 (K) |
| Conversion Factor (C18O) | 1 (Jy beam-1) = 344.4 (K) |
| System temperature | 100 - 350 K |
| rms noise level (Continuum; Natural) | 0.48 mJy beam-1 = 0.16 K |
| rms noise level (C18O) | 6.59 mJy beam-1 = 2.27 K |
| Flux, Gain calibrator | J0510+180 (2.4 Jy) |
| Passband calibrator | J0423-0120 |
3 Results
3.1 0.9-mm Dust-Continuum Emission
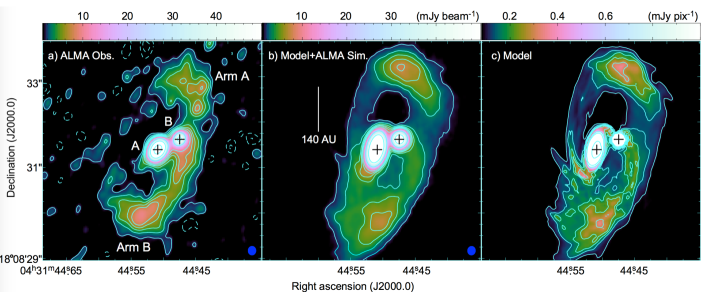
Figure 1a shows the ALMA Cycle 2 image of L1551 NE in the 0.9-mm dust-continuum emission with Natural weighting. There are two intense compact components, one to the southeast and the other to the northwest. The configuration of these two components matches well that of the binary components, Sources A and B, and these components most likely trace the CSDs around the individual binary members. From the 2-dimensional Gaussian fitting, the deconvolved sizes of the CSDs along the major and minor axes () around Sources A and B are measured to be 029 019 (40 26 AU) (P.A.=144) and 026 020 (36 27 AU) (=147), respectively. Since the angular resolution with Natural weighting is 01900169 (P.A. = 178), the CSDs are slightly resolved in the present Cycle 2 observation. It is thus feasible to discuss the axis ratios and position angles of the CSDs, whereas with the present beam it is not possible to study the internal structures of the CSDs. The corresponding disk inclination angles () are calculated to be 50 for Source A and 41 for Source B. To further resolve the CSDs, we have also made high resolution images in the 0.9-mm dust-continuum emission, first with Uniform weighting, and then further restricting the visibility data to projected baseline lengths longer than 450 m (See Table 1 for the angular resolutions of those images). The CSD sizes, inclination and position angles, and the flux densities derived from the 2-dimensional Gaussian fittings are summarized in Table 2. The results are barely changed with the different weightings, except for those of Source B at the 450 m weighting. The flux density of the CSD around Source B as measured in the image with the 450 m weighting is considerably (factor 2) lower than that in the other images, suggesting the presence of the severe effect of the missing flux.
On the other hand, Lim et al. (2016b) have made higher-resolution (54 mas = 7.6 AU) JVLA 7-mm observations of the CSDs in L1551 NE, which enable them to study the internal structures of the CSDs. They claimed that the fittings of the NUKER function to the 7-mm image provide better results than simple 2-dimensional Gaussian fittings, and derived the breaking diameters, position angles, and the inclination angles of the Source A disk to be 0266 (37.2 AU), 151, and 58, and those of the Source B disk 0128 (17.8 AU), 152, and 58, respectively. These values are also listed in Table 2. The apparent slight differences of the disk sizes and the inclination angles between the ALMA and JVLA results are likely due to the 3-times lower-angular resolution of our ALMA observation as compared to the JVLA observation, as well as the differences of the fitting functions (The errors in the ALMA fitting results only include the statistical errors of the Gaussian fittings.), and the possible contaminations from the ionized jet components to the 7-mm emission. The position angles of the CSD around Source A derived from the ALMA and JVLA observations are 1443 and and 1514, and those around Source B are 14711 and and 1525, respectively. Considering the above-mentioned differences and the statistical errors, there is no significant difference in the disk position angles between the ALMA and JVLA results. The centroid positions of the CSDs derived from the 2-dimensional Gaussian fittings to the ALMA image are (04h31m44509, +180831396) toward Source A and (04h31m44475, +180831622) toward Source B. These positions are within 50 mas from the corresponding centroid positions of the JVLA image. The typical astrometric precision of ALMA observations is reported as angular resolution / 20, which is 018 / 20 10 mas in the present observation. We do not consider, however, that the apparent offsets between the ALMA and JVLA positions are significant, but they may reflect internal structures of the CSDs, which are not well resolved with the present ALMA observations. Hereafter in this paper we will adopt the ALMA positions for Sources A and B.
Our Cycle 2 observations have also revealed detailed structures of the CBD in L1551 NE. There is an arm-like feature to the south of the protobinary. The emission ridge of this feature exceeds above 10, and it clearly shows a curling structure from the southeast to south, and then to the northwest. At the northwestern tip, this arm smoothly connects with the CSD around Source B. Hereafter we call this feature “Arm B”. To the north there is another feature (we call this “Arm A”), whose emission ridge above 6 also curls from northwest, north and then northeast. These two arm-like features comprise the CBD around the protostellar binary. Compared to our previous lower-resolution 0.9-mm image taken at the Cycle 0 stage, the new Cycle 2 image presents the curling, arm-like features more unambiguously, and unveils the connecting feature of Arm B to the CSD of Source B for the first time. Furthermore, it is also clear that the western side of the CBD is much brighter than the eastern side. Thus, there is a non point-symmetric, mode of the material distribution in the CBD. In Figure 1b and 1c, the simulated theoretical continuum images after and before the CASA observing simulation are shown (for the details of the numerical simulation and the radiative transfer calculations, see Takakuwa et al. 2014). As described above, our time-dependent numerical simulation shows that after a period of 20 orbits, such an mode in the CBD is developed and is then present continuously. In Figure 1b and 1c we show the simulation result of the 73rd orbit. Our simulation reproduces the observed curling features of Arms A and B, connection of Arm B to the CSD around Source B, and the brightness distribution skewed to the west.
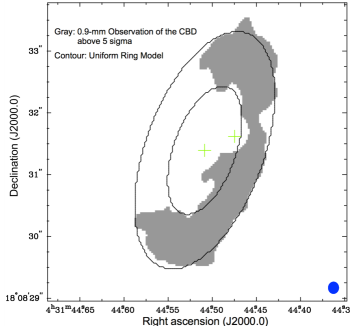
From kinematical model fitting of Keplerian rotation to the C18O (3–2) velocity channel maps of L1551 NE observed with the SMA, the position and inclination angles of the CBD have been estimated to be = 167 and = 62, respectively Takakuwa et al. (2012). These values are adopted in our simulation, which reproduces the observed features of the CBD (Figure 1). From the 0.9-mm dust-continuum image taken with the ALMA Cycle 2 observation, we have also attempted to re-estimate and and their uncertainties. Since the structure of the CBD is complicated it is not straightforward to make a fitting of any simple geometrical shape (such as a 2-dimensional Gaussian) to the observed CBD image and to derive the fitting uncertainties. We have thus made the following simplification. First, the CSD components as derived from the 2-dimensional Gaussian fittings described above were subtracted from the observed 0.9-mm image and the CBD-only image was generated. Then, inside and outside the regions with the image intensities higher than 5, the intensities were replaced with an uniform intensity of unity and zero, respectively. We then regarded the simplified structure of the CBD as an uniform circular ring, and performed model fitting with , , the ring inner diameter, and the ring width as the fitting parameters. The fitting result is shown in Figure 2. The estimated position and inclination angles are = 160 and = 62, consistent with our canonical values adopted in our numerical simulation. This simple ring fitting shows that the typical uncertainties of and are and , respectively.
The masses of the CSDs and CBD () are estimated from their individual continuum fluxes () measured in the Naturally-weighted image as,
| (1) |
where is the frequency, the distance, the Planck function for dust at a temperature , and the dust opacity per unit gas + dust mass on the assumption of a gas-to-dust mass ratio of 100. The same dust mass opacity at 0.9-mm as that adopted in Takakuwa et al. (2014), = 0.053 cm2 g-1, is used, which is calculated from = (/)β, =0.1 cm2 g-1 Hildebrand (1983), and =0.5 Guilloteau et al. (2011); Chiang et al. (2012). The same range of the dust temperature as that adopted in Takakuwa et al. (2014), = 10 - 42 K, is adopted (For comparison, the peak brightness temperature of the C18O (3–2) image cube ranges 10–35 K.). Then, a mass for the CSD of Source A is calculated to be 0.005 - 0.043 , that of Source B 0.002 - 0.016 , and that of the CBD 0.009 - 0.076 . These mass estimates are in close agreement with those from our previous Cycle 0 observation Takakuwa et al. (2014). The adopted dust mass opacity ( = 0.053 cm2 g-1) is a factor 3 higher than that of Ossenkopf & Henning (1994) for grains with thin ice mantles coagulated at a density of 106 cm-3 ( = 0.018 cm2 g-1). Thus, adopting the dust mass opacity by Ossenkopf & Henning (1994) provides a factor 3 higher masses of the CSDs and CBD. The mass ranges derived above do not take this uncertainty of the dust mass opacity into account. In any case, the CSD and CBD masses are much smaller than the inferred total binary mass of 0.8 , suggesting that the self-gravity of the disks is negligible compared to the gravitational field of the binary protostars.
| Disk | Weighting | aaAssuming =10–42 K and =0.053 cm2 g-1 . See texts for details. | ||||
|---|---|---|---|---|---|---|
| (AUAU) | () | () | (Jy) | (10-3 ) | ||
| Source A CSD | Natural | (401)(261) | 50 | 1443 | 0.34 | 5.0–43.2 |
| Uniform | (401)(261) | 49 | 1452 | 0.33 | 4.9–42.3 | |
| 450 mbbUniform weighting of the visibility data with the projected baseline lengths longer than 450 m. | (391)(221) | 56 | 1452 | 0.25 | 3.7–32.0 | |
| Source A CSD 7-mmccFrom the fitting of the JVLA 7-mm image to the NUKER function by Lim et al. (2016b). | Natural | 3720 | 58 | 1514 | ||
| Source B CSD | Natural | (362)(272) | 41 | 14711 | 0.13 | 1.9–15.9 |
| Uniform | (312)(242) | 40 | 14312 | 0.11 | 1.6–13.6 | |
| 450 mbbUniform weighting of the visibility data with the projected baseline lengths longer than 450 m. | (221)(131) | 52 | 1399 | 0.06 | 0.9–7.6 | |
| Source B CSD 7-mmccFrom the fitting of the JVLA 7-mm image to the NUKER function by Lim et al. (2016b). | Natural | 189 | 58 | 1525 | ||
| CBD | Natural | 600280ddFrom the approximate zeroth intensity level in Figure 1. | 62eeSee texts for details. | 167eeSee texts for details. | 0.60ffFlux density after the subtraction of the CSD components from the 2-dimensional Gaussian fitting in Figure 1. | 8.8–76.0ffFlux density after the subtraction of the CSD components from the 2-dimensional Gaussian fitting in Figure 1. |
3.2 Distributions of the Molecular-Line Emission in L1551 NE
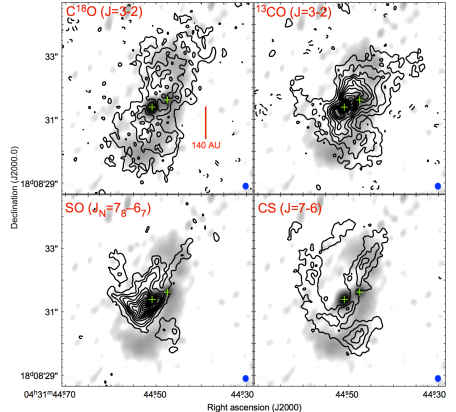
Figure 3 shows the total integrated intensity (moment 0) maps of the C18O (=3-2), 13CO (=3-2), SO (=78-67), and the CS (=7-6) lines (contours), superposed on the 0.9-mm dust-continuum image (gray scale). These four lines exhibit different spatial distributions. While the overall emission extent and the elongation of the C18O emission are consistent with those of the continuum emission, the 13CO emission distribution is different from the C18O distribution, and is more concentrated inside the arm-like features of the 0.9-mm dust-continuum emission. The SO emission is seen predominantly in the vicinity of Source A, and its peak brightness temperature is 46 K to the southeast of Source A. Recent ALMA studies of protostars in the SO (65-54; 219.949 GHz) line, found that the SO emission traces shocks associated with the accretion onto the central disks from the surrounding protostellar envelopes Sakai et al. (2014); Yen et al. (2014); Ohashi et al. (2014). It is thus possible that the intense SO emission in the vicinity of Source A also traces shocks associated with the accretion from the CBD to the CSD around Source A. The CS (7–6) emission exhibits a tilted -shaped feature, and it is not easy to correlate the CS emission distribution with the dust-emission distribution. These different molecular-line distributions imply significant chemical inhomogeneities in the CBD around L1551 NE.
Since the C18O emission appears to trace the CBD structure as seen in the 0.9-mm dust-continuum emission most straightforwardly, and since the velocity resolutions of the 13CO and the SO, CS data are a factor of 2 and 4 worse, respectively, in the following we will use the C18O line to discuss the velocity structures of the CBD and CSDs in L1551 NE.
3.3 C18O (3–2) Emission
Figure 4 shows the velocity channel maps of the C18O (3–2) line in contours, superposed on the 0.9-mm dust-continuum image of L1551 NE in gray scale. Our previous SMA and ALMA Cycle 0 observations of L1551 NE in the C18O (3–2) line have found that the systemic velocity of the CBD is =6.9 km s-1 Takakuwa et al. (2012, 2013, 2014, 2015). Centered on this systemic velocity, our ALMA Cycle 2 observation of L1551 NE detected the C18O emission from =3.0 to 10.7 km s-1. At the most blueshifted velocities, two compact C18O emission components, one to the northwest of Source A and the other northwest of Source B, are seen. To the southeast of Source A the redshifted counterpart is also seen at the most redshifted velocity, while such a redshifted counterpart is not seen to the southeast of Source B. At slightly lower velocities, the blueshifted C18O emission extends northeast from the midpoint between Sources A and B, while the redshifted C18O emission extends to the south and then southwest. The blueshifted C18O emission then expands to the western side too, and traces the entire northern side of the CBD. A similar tendency is also seen in the redshifted side, where the C18O emission extends to the east and traces the entire southern half of the CBD. Around the systemic velocity a characteristic “butterfly” pattern, a signature of a Keplerian disk Simon et al. (2000), is seen.
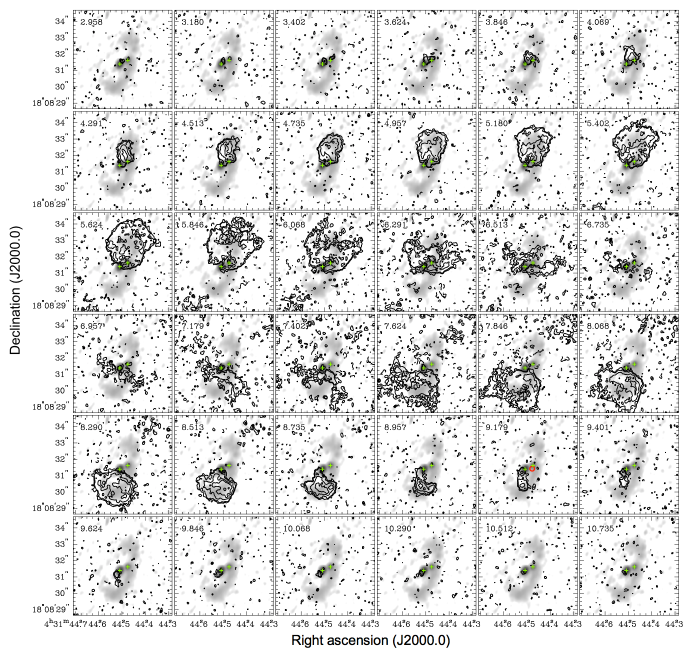
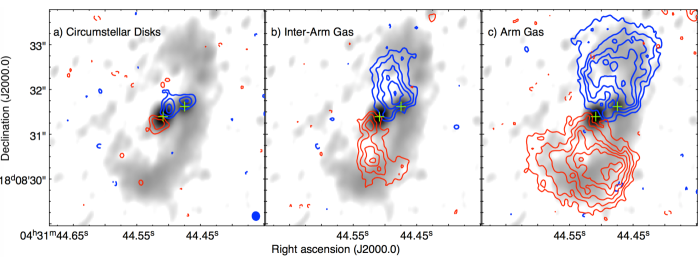
Figure 5 represents three primary components identified in the C18O maps; circumstellar-disk components, inter-arm gas, and arm-gas components. In Figure 5a, the blueshifted and redshifted C18O components are located symmetrically with respect to Source A, and these C18O components most likely trace the CSD as seen in the 0.9-mm dust continuum emission around Source A. In Figure 5b, the blueshifted C18O emission extends northward from the midpoint between Sources A and B, and the redshifted emission extends southward from the southeast of Source A. The tip of the blueshifted emission reaches to the eastern part of Arm A, and that of the redshifted emission reaches to the western part of Arm B. In Figure 5c, the blueshifted and redshifted C18O emission trace the structures of Arms A and B, respectively.
In Figure 5b, it is clear that to the east of Source A the C18O emission is redshifted and to the west blueshifted. Since the eastern and western sides of the CBD are near and far-side, respectively, the detected east (redshifted)-west (blueshifted) velocity gradient is consistent with an infalling gas motion toward Source A. In Figure 5a, another blueshifted C18O component is seen to the northwest of Source B, however, there is no redshifted counterpart seen to the southeast of Source B. In the 13CO (3–2) image cube, this redshifted counterpart in Source B, is not seen either above the 2 noise level (14.5 mJy), while the other components are clearly seen. These results imply that the blueshifted component to the northwest of Source B does not trace the CSD.
Below, we will discuss the C18O emission components associated with the CSDs and the CBD separately.
3.3.1 CSDs
From our previous SMA and ALMA studies of L1551 NE, the total binary mass, mass ratio, and the inclination and position angles of the CBD are estimated to be 0.8, 0.19, 62 and 167, respectively. Then, on the assumption of the circular Keplerian orbit of the binary system co-planar to the CBD, the line-of-sight velocities of Sources A and B are calculated to be = 7.0 km s-1 and 6.3 km s-1, respectively. The high-velocity blueshifted and redshifted C18O emission around Source A (Figure 5a) are located approximately symmetrically with this systemic velocity of Source A. In the case of Source B, the high-velocity blueshifted emission is seen around 3.4 km s-1, and thus the redshifted counterpart should appear around 9.2 km s-1. Such a redshifted component is, however, not seen in the C18O and 13CO image cubes. This lack of emission cannot be explained by the contamination from the CO emission in the CBD, as there is no CBD CO emission at the relevant location and velocity (see a red open circle in Figure 4).
Figure 6 (right) overlays the distribution of the high-velocity C18O emission (contours) on the higher-resolution 0.9-mm dust-continuum image (gray scale). In this continuum image emission structures originated from the CBD are resolved out, but the angular resolution is a factor 1.6 better than that with the Natural weighting (see Table 1). Thus, the elongations of the CSDs as seen in the 0.9-mm dust-continuum emission are better resolved. The position angle of the CSD around Source A as measured from this higher-resolution dust-continuum image (=1452; see Green lines in Figure 6) matches well with the axis connecting the blueshifted and redshifted C18O emission. These high-velocity C18O emission components associated with the CSD have been unveiled for the first time with the present higher-resolution and high-sensitivity Cycle 2 observation. Furthermore, the CSD major axis appears to be tilted with respect to the major axis of the CBD (Figure 6 left) 111In our numerical simulations the position and inclination angles of the CSDs are assumed to be the same as those of the CBD.. From our simplified uniform ring model fitting to the CBD image as described in section 3.1, the position angle of the CBD and its uncertainty is estimated to be = 160. While the lower bound of of the CBD and the upper bound of of the CSD around Source A slightly overlap, the probability to match the both values is only . In addition, the estimated inclination angle of the CBD and that of the CSDs around Sources A and B are also different by more than their uncertainties (see Table 2). These results imply that the CBD and the CSDs are misaligned and not co-planar with each other.
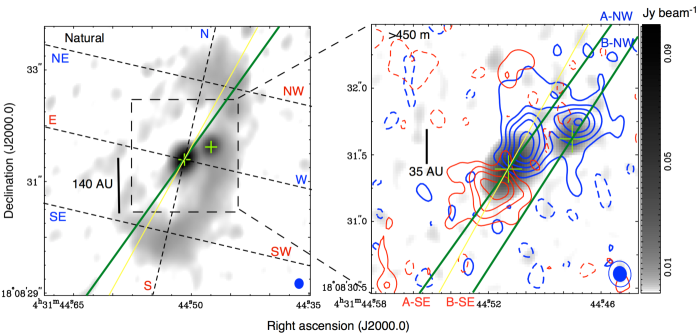
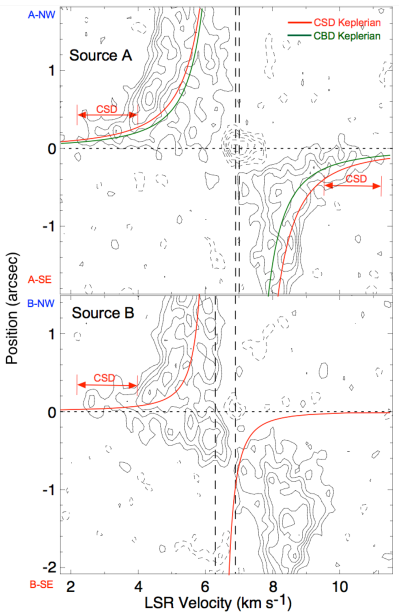
Figure 7 shows the Position-Velocity (P-V) diagrams of the C18O emission along the major axes of the CSDs of Sources A (upper panel) and B (lower panel) (see Figure 6). While the bulk of the C18O emission arises from the CBD, the C18O emission originated from the CSDs can be identified as emission protrusions at the highest velocities (red arrows in Figure 7). Red curves in the upper and lower panels of Figure 7 shows the inferred Keplerian rotation curves of the CSDs around Sources A and B, respectively. In the P-V diagram of Source A, the emission ridge originated from the CSD appears to trace the relevant Keplerian rotation curve. On the blueshifted side, the emission peak is located at the positional offset of 021 and 3.4 km s-1. At the same positional offset the Keplerian rotation curve yields = 3.5 km s-1. On the redshifted side, the offset position of the emission peak at = 9.8 km s-1 is 028, and at the same positional offset the Keplerian rotation curve predicts = 10.0 km s-1. The differences of the velocities are less than the observational velocity resolution (0.22 km s-1). As shown in Figure 6, the direction of the velocity gradient of the C18O emission is along the major axis of the CSD around Source A. These results imply that the high-velocity C18O emission associated with Source A traces the Keplerian rotation of the CSD around Source A. On the contrary, the ridge of the high-velocity blueshifted emission to the northwest of Source B deviates from the inferred Keplerian rotation curve. There are two peaks in the emission ridge; one at = 2.6 km s-1 and the other at = 3.7 km s-1, both of which have a similar positional offset 013. At the same positional offset the Keplerian rotation curve predicts = 4.7 km s-1, and hence the observed peak velocities are 1.0 km s-1 higher. This implies that the velocity of the blueshifted C18O emission around Source B is too high for the Keplerian rotation. In addition, the redshifted counterpart is not seen. These results suggest that the origin of the high-velocity blueshifted C18O emission to the northwest of Source B is unlikely to be the Keplerian rotation. Instead, this high-velocity blueshifted emission may trace a gas component flowing into the Roche lobe.
3.3.2 CBD
Figure 8 shows P-V diagrams of the C18O emission along the major and minor axes of the CBD. The central position of these P-Vs is adopted to be the position of Source A. Since the inferred binary mass ratio (0.19) is small, the exact dynamical center of the CBD is only 008 northwest from the Source A (= primary) position. We have confirmed that this small offset of the central position does not produce any recognizable change of the P-V diagrams. Thus, for simplicity, hereafter we will adopt the P-Vs passing though the position of Source A, to discuss the velocity structures of the CBD.
In the P-V diagram along the major axis, the bulk of the C18O emission traces the rotating CBD, and the spatial-velocity distribution is consistent with the Keplerian rotation curve on the assumption of the central stellar mass of 0.8 and the disk inclination angle of 62. At the highest velocities, emission components originated from the CSD of Source A are also present (arrows in Figure 8). In the P-V diagram along the minor axis, there are low-velocity blueshifted (5.0-6.7 km s-1) components to the east and west of Source A. These components trace the outer CBD components, including the “butterfly” emission components (see Figure 4). In addition to these low-velocity blueshifted components, there are high-velocity blueshifted and redshifted components in the close vicinity () of Source A (dashed ellipses in Figure 8). The high-velocity blueshifted and redshifted components are located to the west and east of Source A, respectively, and the sense of the velocity gradient is consistent with the infalling motion toward Source A. The peak of the high-velocity blueshifted emission resides at the positional offset of -011 and = 4.1 km s-1, and that of the high-velocity redshifted emission at +019 and = 9.1 km s-1. If the identified infall motion is free-fall toward the central stellar mass of 0.675 ( the inferred mass of Source A), at the positional offset of the blueshifted component, the line of sight velocity should be = 1.4 km s-1, which is much higher than the observed velocity (see green curves in Figure 8). Similarly, at the positional offset of the redshifted component the velocity should be = 11.0 km s-1, too high as compared to the observed velocity. Instead, if the central stellar mass is 0.2 (red curves in Figure 8), at the positional offsets of the blueshifted and redshifted emission peaks the velocities are calculated to be 3.9 and 9.1 km s-1, consistent with the observed velocities. These results indicate that the velocities of the identified infalling motion are smaller than those of free-fall.
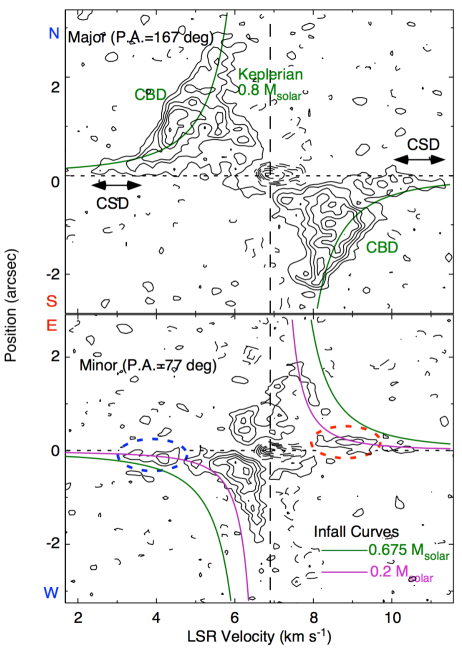
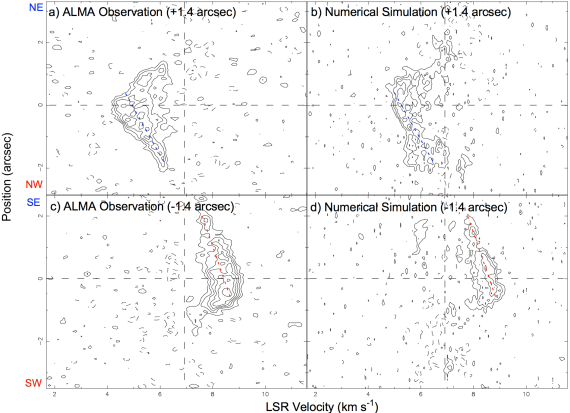
Figure 9 (left) shows the observed P-V diagrams of the C18O emission along the transverse directions of Arms A and B (NE-NW and SE-SW in Figure 6 left). Across Arm A, there is a velocity gradient where the eastern part is more blueshifted than the western part (blue dashed line in Figure 9). A similar velocity gradient is also seen across Arm B (red dashed line). Since the eastern part of the CBD is on the near-side and the western part is on the far-side, the identified velocity gradients across Arms A and B suggest presence of expanding gas motions in the arms, as already found with the previous Cycle 0 observation Takakuwa et al. (2014).
4 Discussion
4.1 Kinematics of the CBD
Our ALMA Cycle 2 observation of L1551 NE has resolved the CBD in the 0.9-mm dust-continuum emission into two arm-like features, Arms A and B, where Arm B is connected to the CSD around Source B. Furthermore, the western part of the CBD is much brighter than the eastern part, suggesting the presence of the mode of the material distribution. These observed continuum features are reproduced with our numerical simulation of the CBD.
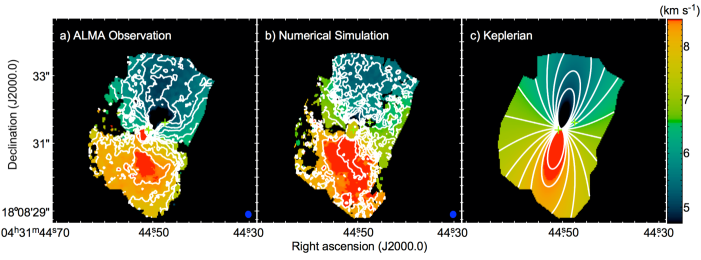
In the C18O line the global rotation of the CBD and the expanding gas motions in Arms A and B have been identified. Furthermore, the infalling gas components in the vicinity ( AU) of Source A have also been found. Figure 10 compares the observed C18O mean-velocity map, simulated C18O mean-velocity map, and the anticipated mean-velocity map of the circular Keplerian rotation with the central stellar mass of 0.8. In the case of the circular Keplerian rotation the mean velocity map should be symmetric with respect to the major axis. The observed and simulated mean-velocity maps show, however, slight deviations from the Keplerian rotation. In these maps the southwestern part is slightly more redshifted than the southeastern part, and the northeastern part is slightly more blueshifted than the northwestern part. These deviations from Keplerian reflect expanding gas motions in the arms. Indeed, the simulated P-V diagrams across Arms A and B shown in Figure 9 (right) reproduce the expanding motions in the arms found with our ALMA observation. We note that in the radiative transfer calculation, artificially high dust-opacity “masks” with a radius of 20 AU have been put at the locations of Sources A and B, to hide the two “sinks” adopted in our numerical simulation. Therefore, the observed infalling components in the vicinity of Source A cannot be reproduced with our model.
Our numerical simulation, as well as previous theoretical studies of CBDs around protostellar binaries Bate (2000); Günther & Kley (2002); Ochi et al. (2005); Hanawa et al. (2010); Young et al. (2015), predict that the non-axisymmetric gravitational torques from the binary, induce both inward and outward gas motions with slower and faster rotations than the Keplerian rotations, respectively, and creates spiral density patterns in the CBDs. At the radii outside the L2 and L3 Lagrangian points, spiral arms in the CBDs are the regions where the gravitational torques impart angular momenta and drive faster rotation than the Keplerian rotation. As a result the spiral regions expand radially. On the other hand, the gravitational torques extract angular momenta from the inter-arm regions, and thus drive infall. The observed expanding gas motions in Arms A and B, and infall in the inter-arm regions, can thus be interpreted as a result of the non-axisymmetric gravitational torques of the binary.
Our Cycle 2 observations have also unveiled that the material distributions in the CBD around L1551 NE, are not point-symmetric, but skewed to the western side (Figure 1a). The presence of such an mode is also reproduced by our numerical simulation as described above. The asymmetric structure of the CBD rotates in the direction of the orbital motion of the binary stars, and its angular velocity is lower than that of the orbital motions. The asymmetry therefore rotates with respect to the position angles of the binary stars. The adopted 73rd orbital period of the simulation, gives one of the best configurations of the asymmetry and the binary position angle, and shapes of the arms (Figures 1b and 1c.). The theoretical discussion on the asymmetry of the CBD will be presented in a forthcoming paper.
4.2 Infall onto the Protostellar Binary
As described in section 3.3.2, an infalling motion toward Source A, whose velocity is slower than the free-fall velocity, is observed in the CBD. The infalling motion in the CBD could determine the final binary mass and the mass ratio, as discussed in previous theoretical studies Bate (2000); Günther & Kley (2002); Ochi et al. (2005); Hanawa et al. (2010); Young et al. (2015). The mass of the infalling component () is estimated by integrating the blueshifted and redshifted C18O emission in the vicinity of Source A from Figure 5b, on the assumption of the excitation temperature of the C18O emission of 42 K Barsony & Chandler (1993); Moriarty-Schieven et al. (1994), (C18O)=1.710-7 Crapsi et al. (2004), and the LTE condition. The mass of the infalling component is estimated to be 8.110-5 . Then, the mass infalling rate () can be estimated as
| (2) |
and the value is 1.010-6 . From the accretion luminosity () can also be calculated as
| (3) |
where is the gravitational constant, is a mass of the central protostar, and is the terminal radius of the infall. If we assume that the infalling gas directly reaches to the surface of the protostar (i.e., = = 4) Stahler et al. (1980), the accretion luminosity is 5.4 , similar to the bolometric luminosity of L1551 NE (= 4.2 ; Froebrich 2005).
In the above estimates, we simply extracted the C18O emission with the east (red) to west (blue) velocity gradient in the vicinity of Source A, since the velocity gradient along the minor axis can be interpreted as an infalling motion. On the other hand, it is not straightforward to observationally identify infalling motions along the disk major axis, because the radial motion along the major axis does not have any velocity vector along the line of sight (LOS). Thus, the mass infalling rate estimated above should be regarded as the lower limit of the entire infall toward Source A. Toward Source B, our ALMA observations do not identify infalling motions (i.e., a velocity gradient along the minor axis centered on Source B). However, this does not indicate that there is no infall toward Source B, because infalling gas motions perpendicular to the observational line of sight can not be measured. Previous studies of infall in protostellar envelopes assume axisymmetric gas motions to estimate the entire mass infalling rate from the observed velocity gradient along the minor axis Momose et al. (1998); Takakuwa et al. (2007); Yen et al. (2010, 2011); Takakuwa et al. (2013). On the other hand, in the vicinity of protostellar binaries axisymmetric gas motions cannot be assumed because the gravitational field is non-axisymmetric. Thus it is much more difficult to observationally estimate the infalling rates, and compare the mass infalling rates onto the primary and secondary. Our numerical simulation of L1551 NE indeed shows highly asymmetric distributions of the radial (infall and expansion) motions (see Figure 9c in Takakuwa et al. 2014) as well as the azimuthal motions (Figure 9b). Detailed comparisons of our numerical simulations and the observational image cubes will be the subject to our forthcoming paper.
In addition to mass infall in CBDs onto the protostellar binaries, kinematics of surrounding protostellar envelopes which can replenish CBDs with fresh materials should also be taken into account. Our previous ASTE observations of the large-scale (20000 AU) protostellar envelope in L1551 NE have unveiled that the protostellar envelope is being dispersed by the redshifted outflow driven from the neighboring protostar, L1551 IRS 5 Takakuwa et al. (2015). While in the inner 1000 AU scale there is an infalling component Takakuwa et al. (2013), the mass of that component (0.002 ) is smaller than the CBD mass (0.009 – 0.076 ; Table 2). Thus, further mass supply from the protostellar envelope to the CBD in L1551 NE is not expected. The inferred present masses of Sources A and B are 0.68 and 0.13 , respectively, and even if all the amount of the material in the CBD plus the infalling component is accreted onto the binary, the binary mass and the mass ratio do not change much. Therefore, even though L1551 NE is a Class I protostellar binary associated with the CBD and the protostellar envelope, the mass and the mass ratio are already close to the final values.
4.3 Misalignments of the CSDs from the CBD in L1551 NE
Our high-resolution Cycle 2 observations of L1551 NE have resolved the elongation of the dust components around the individual binary protostars, and measured the position and inclination angles of the CSDs unambiguously. Furthermore, the high-velocity blueshifted and redshifted C18O emission are associated with the CSD of Source A, and the major axis of the CSD matches with the direction of the velocity gradient. The radii and velocities of the C18O emission are consistent with the Keplerian rotation with the inferred Source A mass of 0.675 (Figure 7).
As discussed in sections 3.1 and 3.3.1, the position and inclination angles of the CSDs around Sources A and B are different from those of the CBD. These results indicate that the CSDs are misaligned from the CBD, and that the CSDs are not co-planar with the CBD. Such a non-coplanar configuration could cause precessing motions of the CSDs, which are lighter than the CBD, on the time scale of the binary orbital period. The precessing amplitude must be on the order of the difference of the position angles between the CBD and the CSD (20). Previous NIR observations have found that Source A drives collimated jets along the northeast (red) to southwest (blue) direction Devine et al. (1999); Reipurth et al. (2000); Moriarty-Schieven et al. (2006); Hayashi & Pyo (2009). The jets consists of a chain of knots of HP2 (HH 454A), HH29 and 28 on the blueshifted side, and HP3, 4 (=HH 454B), 5, and 6 on the redshifted side. All of these knots are within 2 of a common jet axis at P.A. 61 (The P.A. of the minor axes of the CSD of Source A and the CBD are 54 and 77, respectively.). The proper motions of these HH knots are also measured to be 150 km s-1, and the dynamical timescale of the most distant HH knot, HH 28, is measured to be 2700 yr. For comparison, the orbital period of the Sources A and B binary system is calculated to be 1700 yr, on the assumption of the circular orbit. Thus, for the last 1.6 orbital periods there is no significant (within the P.A. difference between the jet and the CSD minor axis of 61-54 = 7) precession in the disk-jet system of Source A, and the misaligned configuration appears to be rather static.
In the presence of the misalignment between the CBD and CSDs, the infalling material and the angular momenta from the CBD do not smoothly connect to the outermost radii of the CSDs. The infalling materials should fall onto the disk surface or even onto the protostar directly. Indeed, from the argument in section 4.2 direct infall from the CBD onto the protostar is required to account for the protostellar luminosity with the accretion luminosity. Furthermore, if the infalling materials fall onto the disk surface, such direct impacts could affect the physical and chemical conditions of the CSD significantly, and the subsequent disk evolution into the planet formation stage. As shown in Figure 3, the SO (78–67) emission is concentrated around Source A, and the peak brightness temperature of the SO emission is 46 K to the southeast of Source A. In L1489 IRS Yen et al. (2014) and L1527 IRS Sakai et al. (2014); Ohashi et al. (2014), SO lines have been observed in the transitional regions from the infalling envelopes to the inner Keplerian disks. Such SO emission distributions can be interpreted as the presence of the accretion shocks, although in the other protostars the interpretation of the SO emission distributions is not straightforward Yen et al. (2017). It is thus possible that the observed intense SO emission in the close vicinity of Source A may also trace shocks associated with the impacts of the infalling materials from the CBD onto the CSD surface. Such SO emission distribution associated with the accretion onto CSDs from the CBD has indeed been found in another binary system of UY Aurigae Tang et al. (2014).
5 Summary
We have performed the ALMA Cycle 2 observations of the protostellar binary system L1551 NE in the 0.9-mm dust-continuum, C18O (=3-2), 13CO (=3-2), SO (=78-67), and the CS (=7-6) emission at an angular resolution of 018, four times higher than that of our previous Cycle 0 observations. The present Cycle 2 observations have unveiled the detailed structures and kinematics of the CBD in L1551 NE, and resolved the CSDs around the individual binary protostars. We have also performed numerical simulations and constructed the theoretically-predicted 0.9-mm and C18O images of L1551 NE, in order to interpret the observed structures and gas motions in the CBD. The main results are summarized below.
-
1.
The 0.9-mm dust-continuum emission traces two CSDs around the individual binary protostars, and the CBD in L1551 NE. The CSDs are spatially resolved and the deconvolved sizes, position and inclination angles of the CSD around Source A are measured to be 40 26 AU, , and , and those around Source B are 36 27 AU, = 147, and . The position and inclination angles of the CSD around Source A are different from those of the CBD ( and ), and the inclination angle of the CSD around Source B are also different from that of the CBD. The CBD exhibits two arm-like features (Arm A to the north and Arm B to the south), and Arm B connects to the CSD of Source B. Furthermore, the brightness distribution of the continuum emission is skewed to the western part of the CBD, suggesting the presence of the mode of the material distribution in the CBD. The masses of the CSDs around Sources A and B, and the CBD are estimated to be 0.005-0.043 , 0.002-0.016 , and 0.009–0.076 for = 10–42 K, respectively.
-
2.
The high-velocity blueshifted (3.0-3.6 km s-1) C18O emission is associated with the northwestern halves of the CSDs as seen in the 0.9-mm dust-continuum emission. The redshifted (9.6-10.7 km s-1) counterpart of the C18O emission is also seen in the southeastern half of the CSD of Source A, whereas such a redshifted counterpart is not found toward Source B. In Source A, the direction of the velocity gradient of the high-velocity blueshifted and redshifted C18O emission matches well with the major axis of the CSD. In the intermediate velocity ranges the blueshifted C18O emission (3.9-4.5 km s-1) connects between the midpoint between Sources A and B and the eastern part of Arm A, and the redshifted C18O emission (9.0-9.4 km s-1) between the southeast of Source A and the western part of Arm B. There is also a east (red)-west (blue) velocity gradient centered on Source A. In the lower velocity range the blueshifted emission extends to the western part of Arm A and the redshifted emission to the east of Arm B. This suggests the presence of east (blue)-west (red) velocity gradients across the arms, and the sense of those velocity gradients is opposite to that around Source A.
-
3.
The east (red)-west (blue) velocity gradient around Source A in the CBD represents infalling motion toward Source A, whereas the opposite velocity gradients seen across Arms A and B represent expanding motion in the arms. The two arm structures and the expanding motions, and the infall in the inter-arm regions, can all be reproduced with our numerical simulation. Our numerical simulation predicts that the non-axisymmetric gravitational torques of the binary, impart angular momenta to the spiral arms in the CBD and drive faster rotation than the Keplerian rotation and expansion, while the gravitational torques extract angular momenta from the inter-arm regions and thus drive infall. Furthermore, our numerical simulation also predicts the mode of the material distribution in the CBD.
-
4.
The spatial-velocity distributions of the high-velocity C18O emission associated with the CSD around Source A are consistent with the Keplerian rotations with the inferred central stellar masses (=0.68 ). Furthermore, the measured differences of the position and inclination angles of the CSDs around Sources A and B from those of the CBD imply that the CSDs are misaligned with respect to the plane of the CBD. As the axis of the NIR jet knots driven from Source A is close to orthogonal to the major axis of the CSD and appears unchanged over the past 1.6 orbital period of the binary system (1 orbital period 1700 yr), the misalignment of the CSD is rather static. Since the CSDs are likely misaligned from the CBD, the infalling materials and the angular momenta from the CBD do not smoothly connect to the outermost radii of the CSDs, but directly falls onto the surfaces of the CSDs. Such impacts of the infalling material could significantly change the physical and chemical condition of the CSDs. The concentrated SO emission in the vicinity of Source A may reflect shocks associated with the impact of the infalling material.
References
- Barsony & Chandler (1993) Barsony, M., & Chandler, C. J. 1993, ApJ, 406, L71
- Bate (2000) Bate, M. R. 2000, MNRAS, 314, 33
- Chen et al. (2013) Chen, X., Arce, H. G., Zhang, Q. et al. 2013, ApJ, 768, 110
- Chiang et al. (2012) Chiang, H.-F., Looney, L. W., & Tobin, J. J. 2012, ApJ, 756, 168
- Chou et al. (2014) Chou, T.-L., Takakuwa, S., Yen, H.-W., Ohashi, N., & Ho, P. T. P. 2014, ApJ, 796, 70
- Crapsi et al. (2004) Crapsi, A., Caselli, P., Walmsley, C. M., et al. 2004, A&A, 420, 957
- Demidova & Shevchenko (2015) Demidova, T. V., & Shevchenko, I. I. 2015, ApJ, 805, 38
- Devine et al. (1999) Devine, D., Reipurth, B., & Bally, J. 1999, AJ, 118, 972
- Duquennoy & Mayor (1991) Duquennoy, A., & Mayor, M. 1991, A&A, 248, 485
- Dutrey et al. (2014) Dutrey, A., Di Folco, E., Guilloteau, S., et al. 2014, Nature, 514, 600
- Dutrey et al. (2016) Dutrey, A., Di Folco, E., Beck, T., & Guilloteau, S. 2016, A&A Rev., 24, 5
- Froebrich (2005) Froebrich, D. 2005, ApJS, 156, 169
- Guilloteau et al. (2011) Guilloteau, S., Dutrey, A., Piétu, V., & Boehler, Y. 2011, A&A, 529, A105
- Günther & Kley (2002) Günther, R., & Kley, W. 2002, A&A, 387, 550
- Hanawa et al. (2010) Hanawa, T., Ochi, Y., & Ando, K. 2010, ApJ, 708, 485
- Hayashi & Pyo (2009) Hayashi, M. & Pyo, T.-S. 2009, ApJ, 694, 582
- Hildebrand (1983) Hildebrand, R. H. 1983, QJRAS, 24, 267
- Lim & Takakuwa (2006) Lim. J., & Takakuwa, S. 2006, ApJ, 653, 425
- (19) Lim. J., Yeung, P. K. H., Hanawa, T., et al. 2016a, ApJ, 826, 153
- (20) Lim. J., Hanawa, T., Yeung, P. K. H., et al. 2016b, ApJ, 831, 90
- Looney et al. (2000) Looney, L. W., Mundy, L. G., & Welch, W. J. 2000, ApJ, 529, 477
- Matsumoto (2007) Matsumoto, T. 2007, PASJ, 59, 905
- Maury et al. (2010) Maury, A. J., André, P., Hennebelle, P., et al. 2010, A&A, 512, 40
- Momose et al. (1998) Momose, M., Ohashi, N., Kawabe, R., Nakano, T., & Hayashi, M. 1998, ApJ, 504, 314
- Moriarty-Schieven et al. (1994) Moriarty-Schieven, G. H., Wannier, P. G., Keene, J., & Tamura, M. 1994, ApJ, 436, 800
- Moriarty-Schieven et al. (2006) Moriarty-Schieven, G. H., Johnstone, D., Bally, J., & Jenness, T. 2006, ApJ, 645, 357
- Murillo et al. (2013) Murillo, N. M., Lai, S.-P., Bruderer, S., Harsono, D., & van Dishoeck, E. F. 2013, A&A, 560, 103
- Ochi et al. (2005) Ochi, Y., Sugimoto, K., & Hanawa, T. 2005, ApJ, 623, 922
- Ohashi et al. (2014) Ohashi, N., Saigo, K., Aso, Y., et al. 2014, ApJ, 796, 131
- Ossenkopf & Henning (1994) Ossenkopf, V., & Henning, T. 1994, A&A, 291, 943
- Raghavan et al. (2010) Raghavan, D., McAlister, H. A., Henry, T. J., et al. 2010, ApJS, 190, 1
- Reipurth et al. (2000) Reipurth, B., Yu, K. C., Heathcote, S., Bally, J., & Rodríguez, L. F. 2000, AJ, 120, 1449
- Reipurth et al. (2002) Reipurth, B., Rodríguez, L. F., Anglada, G., & Bally, J. 2002, AJ, 124, 1045
- Reipurth et al. (2014) Reipurth, B., Clarke, C. J., Boss, A. P., et al. 2014, Protostars and Planets VI, 267
- Sakai et al. (2014) Sakai, N., Sakai, T., Hirota, T. et al. 2014, Nature, 507, 78
- Simon et al. (2000) Simon, M., Dutrey, A., & Guilloteau, S. 2000, ApJ, 545, 1034
- Stahler et al. (1980) Stahler, S. W., Shu, F. H., & Taam, R. E. 1980, ApJ, 241, 637
- Takakuwa et al. (2004) Takakuwa, S., Ohashi, N., Ho, P. T. P., et al. 2004, ApJ, 616, L15
- Takakuwa et al. (2007) Takakuwa, S., Ohashi, N., Bourke, T. L., et al. 2007, ApJ, 662, 431
- Takakuwa & Kamazaki (2011) Takakuwa, S., & Kamazaki, T. 2011, PASJ, 63, 921
- Takakuwa et al. (2012) Takakuwa, S., Saito, M., Lim, J., et al. 2012, ApJ, 754, 52
- Takakuwa et al. (2013) Takakuwa, S., Saito, M., Lim, J., & Saigo, K. 2013, ApJ, 776, 51
- Takakuwa et al. (2014) Takakuwa, S., Saito, M., Saigo, K., et al. 2014, ApJ, 796, 1
- Takakuwa et al. (2015) Takakuwa, S., Kiyokane, K., Saigo, K., & Saito, M. 2015, ApJ, 814, 160
- Tang et al. (2014) Tang, Y.-W., Dutrey, A., Guilloteau, S., et al. 2014, ApJ, 793, 10
- Tang et al. (2016) Tang, Y.-W., Dutrey, A., Guilloteau, S., et al. 2016, ApJ, 820, 19
- Tobin et al. (2013) Tobin, J. J., Chandler, C. J., Wilner, D. J., et al. 2013, ApJ, 779, 93
- Tobin et al. (2015) Tobin, J. J., Dunham, M. M., Looney, L. W., et al. 2015, ApJ, 798, 61
- Tobin et al. (2016) Tobin, J. J., Looney, L. W., Li, Z.-Y., et al. 2016, ApJ, 818, 73
- Wilner & Welch (1994) Wilner, D. J., & Welch, W. J. 1994, ApJ, 427, 898
- Yen et al. (2010) Yen, H.-W., Takakuwa, S., & Ohashi, N. 2010, ApJ, 710, 1786
- Yen et al. (2011) Yen, H.-W., Takakuwa, S., & Ohashi, N. 2011, ApJ, 742, 57
- Yen et al. (2014) Yen, H.-W., Takakuwa, S., Ohashi, N., et al. 2014, ApJ, 793, 1
- Yen et al. (2017) Yen, H.-W., Koch, P. M., Takakuwa, S., et al. 2017, ApJ, 834, 178
- Young et al. (2015) Young, M. D., Baird, J. T., & Clarke, C. J. 2015, MNRAS, 447, 2907