The Lyman Continuum escape fraction of faint galaxies at in the CANDELS/GOODS-North, EGS, and COSMOS fields with LBC††thanks: Based on observations made at the Large Binocular Telescope (LBT) at Mt. Graham (Arizona, USA).
Abstract
Context. The reionization of the Universe is one of the most important topics of present day astrophysical research. The most plausible candidates for the reionization process are star-forming galaxies, which according to the predictions of the majority of the theoretical and semi-analytical models should dominate the H I ionizing background at .
Aims. We aim at measuring the Lyman continuum escape fraction, which is one of the key parameters to compute the contribution of star-forming galaxies to the UV background. It provides the ratio between the photons produced at Å rest-frame and those which are able to reach the CGM/IGM, not being absorbed by the neutral hydrogen or by the dust of the galaxy’s ISM.
Methods. We have used ultra-deep U-band imaging ( at 1) by LBC/LBT in the CANDELS/GOODS-North field, as well as deep imaging in COSMOS and EGS fields, in order to estimate the Lyman continuum escape fraction of 69 star-forming galaxies with secure spectroscopic redshifts at to faint magnitude limits (, or equivalently ). The narrow redshift range implies that the LBC U-band filter samples exclusively the Å rest-frame wavelengths.
Results. We have measured through stacks a stringent upper limit (¡1.7% at ) for the relative escape fraction of H I ionizing photons from bright galaxies (), while for the faint population () the limit to the escape fraction is . We have computed the contribution of star-forming galaxies to the observed UV background at and we have found that it is not enough to keep the Universe ionized at these redshifts, unless their escape fraction increases significantly () at low luminosities ().
Conclusions. We compare our results on the Lyman continuum escape fraction of high-z galaxies with recent estimates in the literature and discuss future prospects to shed light on the end of the Dark Ages. In the future, strong gravitational lensing will be fundamental to measure the Lyman continuum escape fraction down to faint magnitudes () which are inaccessible with the present instrumentation on blank fields. These results will be important in order to quantify the role of faint galaxies to the reionization budget.
Key Words.:
Galaxies: distances and redshift - Galaxies: evolution - Galaxies: high redshift - Galaxies: photometry1 Introduction
The reionization of the Universe, related to the end of the so-called Dark Ages, is now located in the redshift interval . The lower limit is derived from observations of the Gunn-Peterson effect in luminous QSO spectra (Fan et al. (2006)), while the most recent upper limit, , comes from measurements of the Thomson optical depth in the CMB polarization map by Planck (Planck collaboration 2016). These limits are consistent with a rapid H I reionization at .
These main results have been corroborated by a number of confirmations: the so-called kinetic Sunyaev-Zel’dovich (kSZ) effect measured by the South Pole Telescope (SPT, Zahn et al. (2012)), when combined with the recent Planck 2016 maps gives a stringent limit of to the duration of reionization. Moreover, the redshift evolution of the luminosity function (Konno et al. (2014)) of Lyman- emitters (LAEs) and the sudden drop observed at in the fraction of Lyman-break galaxies (LBGs) with strong Lyman- in emission (e.g. Fontana et al. (2010); Pentericci et al. (2011); Ono et al. (2012); Treu et al. (2012); Pentericci et al. (2014), Schenker et al. 2014) are indicating that the Universe is becoming more neutral at . All these observations are favoring a late, and possibly inhomogeneous, reionization process.
While we have now significant information on the timing of the reionization process, we are still looking for the sources providing the bulk of the H I ionizing photons. Obvious candidates have been searched so far among high-redshift star-forming galaxies (SFGs) and/or Active Galactic Nuclei (AGNs).
At high redshift, bright QSOs () are quite rare as their space density declines rapidly. As such, their ionizing emissivity is quite low, and they are not enough to keep the intergalactic medium (IGM) ionized at (Haardt & Madau 1996, Cowie et al. (2009)). However Glikman et al. (2011) and Giallongo et al. (2015) have recently found a significant population of fainter () AGNs at , which could possibly provide the whole ionizing emissivity at high-z (Madau & Haardt (2015)).
In the last 15 years much effort has been given to high-z star-forming galaxies as emitters of ionizing radiation. This choice has been driven by four considerations: 1-early WMAP results, heavily affected by dust polarization of the Milky Way, indicated a much earlier reionization epoch, around (Hinshaw et al. (2013)); 2-the luminosity function of galaxies is gradually steepening with redshifts at (Finkelstein et al. (2015); Bouwens et al. (2015)); 3-numerous galaxies exist even at very faint absolute magnitudes () at (Livermore et al. (2017)); 4-at high redshifts galaxies could be efficient producers of ionizing photons (Bouwens et al. 2016b ). Their possible contribution crucially depends, however, on their ability to carve ionizing bubbles in their neighborhood, which is quantified by the Lyman Continuum (LyC) escape fraction parameter.
At , the highest redshift where the IGM absorption does not prevent this kind of measure, we still do not have a reliable estimate of the average escape fraction from the star-forming galaxy population. A few claimed detections (Steidel et al. (2001); Shapley et al. (2006); Nestor et al. (2011); Mostardi et al. (2013)) have been called into question due to possible contamination by low redshift interlopers (e.g. Vanzella et al. 2012a). Other datasets provide only upper limits at few percent levels (Giallongo et al. (2002); Grimes et al. (2009); Cowie et al. (2009); Siana et al. (2010); Bridge et al. (2010), Vanzella et al. 2010, Boutsia et al. 2011, Leitet et al. 2013, Grazian et al. 2016, Guaita et al. 2016, Japelj et al. 2017) or marginal detections (Marchi et al. 2017).
Very recently the situation has improved, especially at very low redshifts, thanks to observations by the COS instrument onboard HST. Escape fractions within 6-13% have been detected in five galaxies with large [OIII]/[OII] line ratio and high ionizing photon production efficiency. These ionizers appear compact with high star formation rate surface density (Izotov et al. 2016a,b, Verhamme et al. (2017); Schaerer et al. (2016)), resembling properties which are typical of Green Pea galaxies (Cardamone et al. 2009, Amorin et al. 2010, Amorin et al. 2012a, Henry et al. 2015). This key feature of the local ionizers is inducing a strong feedback on their ISM, through rapid outflows, which may be physically related to leakage of Lyman continuum radiation, as suggested e.g. by Heckman et al. (2011), Amorin et al. (2012b), Borthakur et al. (2014), and explored further with simulations by Sharma et al. (2016a,b). High [OIII]/[OII] line ratio seen in low-z blue compact dwarfs (BCDs) and high-z galaxies may be attributed to many possibilities such as low metallicity, high ionization parameter, hard ionizing radiation field and/or the presence of density-bound H II regions (Stasinska et al. 2015, Steidel et al. 2016, Nakajima et al. 2016). Similar results were also found by Leitet et al. (2013), Borthakur et al. (2014), Leitherer et al. (2016), Bergvall et al. (2016). Three out of the five galaxies by Izotov et al. (2016b) have been detected by the Wide-field Infrared Survey Explorer (WISE) at 22 micron, possibly indicating the presence of warm/hot dust, heated by a buried starburst or by an AGN. The luminosities of these LyC emitters are between and -21.3, thus around , hereafter . These five galaxies were selected from a sample of SDSS galaxies at , so it is not clear whether they represent a sparse minority of the SDSS sample, selected thanks to their peculiar properties (large [OIII]/[OII] line ratio).
Vanzella et al. (2016) and de Barros et al. (2016) found the first clear evidence of a LyC emitter at free from interloper contamination. This galaxy, dubbed Ion2, has peculiar properties similar to the five galaxies by Izotov et al. (2016b) mentioned above. Ion2 has a line ratio of [OIII]/[OII], strong Lyman- in emission and compact morphology. Galaxies with similar properties have been recently discovered and characterized by Amorin et al. (2017), who showed that they are relatively rare and good analogs of primeval galaxies at . However the spectral and physical properties of these objects are rather peculiar and it is not clear if a significant population with similar properties is common at high redshifts (Faisst 2016, Khostovan et al. 2016). Recently, Naidu et al. (2016) have found 6 LyC candidates out of 1124 galaxies at in the GOODS fields, confirming the peculiarity of these LyC emitters. Interestingly, at least 50% of these ionizing sources are confirmed as AGNs, with large escape fraction ().
Given the null result on the brighter SFGs, a crucial contribution on the reionization process by a faint population () at high redshift has been envisaged. This hypothesis has also been predicted by some theoretical models (e.g. Yajima et al. 2011, Razoumov & Sommer-Larsen 2010, but see also models by Gnedin et al. 2008, Ma et al. 2015, Sharma et al. 2016a,b for opposite conclusions).
From an observational perspective, however, there are several pieces of evidence suggesting that low luminosity galaxies may not contribute appreciably to the H I ionizing background. Among the most interesting results there is the large scale opacity fluctuations observed in the Lyman- forest of high-z QSOs by Becker et al. (2015). The large variance in the spatial scales of the transmission of the IGM at has been interpreted as due to bright and rare sources rather than to a diffuse population of faint galaxies (e.g. Chardin et al. 2017). This indication has been strengthen by non detection of LyC flux (escape fraction at 3) from a large sample of moderately star-forming galaxies at by Rutkowski et al. (2016).
An additional observational evidence is related to the sudden decrease in the number density of Lyman- emitters at . According to predictions by Dijkstra et al. (2016), the escape of Lyman- photons should be connected with the leakage of LyC radiation, since they are possibly linked to clear sight-lines in neutral hydrogen. The observed drop in Lyman- is interpreted as due to a rapid evolution of the ionization fraction of the intergalactic medium (IGM) in the Universe from to (Fontana et al. 2010, Pentericci et al. 2011, 2014, Schmidt et al. 2016). Moreover, the decrease in number density is differential, with a less pronounced and slower drop for brighter galaxies (Matthee et al. (2015); Santos et al. (2016), Vanzella et al. 2014, Oesch et al. 2015, Stark et al. 2017), which can be described as “Downsizing Reionization”. This behavior is commonly interpreted as a signature of inhomogeneous and patchy reionization (Treu et al. 2012, Pentericci et al. 2014) where ionizing bubbles expand first in cosmic time around brighter and more massive galaxies, possibly associated with over-dense regions (Castellano et al. 2016). The suggested average “Downsizing” scenario for the luminosity of the ionizing sources would possibly imply a minor, if any, contribution of faint galaxies to the reionization process. To improve our knowledge on Lyman continuum emitters among the SFGs, we started to analyze a relatively large sample of galaxies at , with specific attention to the fainter population.
In the COSMOS field, the LyC escape fraction of 45 bright () star-forming galaxies at has been studied by Boutsia et al. (2011) and Grazian et al. (2016). In a companion paper by Guaita et al. (2016) we have enlarged this sample adding 86 bright galaxies in the Extended Chandra Deep Field South. In the present paper we explore the H I ionizing contribution of fainter galaxies in the CANDELS/GOODS-North and EGS fields with the addition of crucial and unique ultra deep UV imaging from the LBC imager at the Large Binocular Telescope. We have also included in the analysis three galaxies affected by strong lensing, with the aim of probing the possible LyC contribution by intrinsically low luminosity galaxies down to .
This paper is organized as follows. In Sect. 2 we present the dataset, in Sect. 3 we describe the method adopted, in Sect. 4 we show the results for individual objects and for the overall sample as a whole, in Sect. 5 we provide an estimate of the ionizing background produced by these galaxies, in Sect. 6 we discuss our results and in Sect. 7 we provide a summary and the conclusions. Throughout the paper we adopt the -CDM concordance cosmological model (, and ), consistent with recent CMB measurements (Planck collaboration 2016). All magnitudes are in the AB system. All the limits to the escape fraction in this paper are at 1 level, unless we state otherwise.
2 Data
The sample used in the present analysis is based on new ultra-deep UV images obtained with the LBC instrument of spectroscopically confirmed galaxies in the GOODS-North field coupled with moderately deep LBC images in the EGS/AEGIS field and additional data on the COSMOS field, collected from the literature as described in the following.
2.1 The COSMOS, Q0933+28, and Q1623+26 fields
We started this project with deep LBC imaging of the COSMOS, Q0933+28, and Q1623+26 fields in the U and R bands, which have been used by Boutsia et al. (2011) and Grazian et al. (2016) to study the LyC escape fraction of 11 and 34 star-forming galaxies, respectively, with spectroscopic redshifts from the VIMOS Ultra Deep Survey (VUDS, Le Fèvre et al. (2015)). They constitute a mix of Lyman- emitters and Lyman-Break galaxies. This starting sample of 45 galaxies has been visually inspected against contamination by foreground objects and it has been discussed in detail in Grazian et al. (2016).
We added to this starting sample 7 galaxies with spectroscopic redshifts from Onodera et al. (2016) in the same COSMOS area covered by deep LBC data in the U and R bands. All these galaxies have magnitudes between and 26.0, with the exception of a very faint source with , and all the seven galaxies have a flux ratio between [OIII] and [OII] of and SFR of . An additional bright () star-forming galaxy (ID=53167 in Table 1) with Lyman- in emission at has been found serendipitously during a spectroscopic campaign with the LBT MODS1 optical spectrograph on the COSMOS field (PI F. Fiore). After visual inspection of these new eight galaxies with HST F814W high resolution imaging, none has been discarded due to evident contamination by foreground objects close to the line of sight of the galaxies. The limitation of this procedure, however, is that only with one HST band it is not possible to clearly spot possible blends of multiple sources. We end up with 8 additional SFGs in the COSMOS field which are enlarging the original sample adopted by Grazian et al. (2016).
2.2 The EGS field
In order to improve the significance of our results by increasing the number statistics, we included in the present analysis an additional sample of star-forming galaxies in the Extended Groth Strip (EGS/AEGIS) field (Davis et al. (2007)). An area of sq. arcmin. has been covered by two overlapping LBC pointings in the UV band for a total of 6.3 hours (PI H. Yan). The UV depth is 29.6 at a S/N=1, with an average seeing of 1.1 arcsec (Grazian et al. in prep. ). The magnitude limit has been computed through a PSF-fitting method, as described in the next section. Since no observations in the R band have been acquired by LBC on this specific pointing, we have used the R-band image taken by the “Deep” program of the CFHT Legacy Survey (hereafter CFHTLS111http://www.cfht.hawaii.edu/Science/CFHTLS/). In particular, we have used the final release (T0007) of the CFHTLS, which covers 1 sq. deg. of the EGS field at a depth of at an 80% completeness level for point sources. The CFHTLS image has been resampled to the same WCS astrometric grid of the LBC U-band image with Swarp222http://www.astromatic.net/software, preserving both the total fluxes of the objects and their original S/N ratios. A large number of spectroscopic redshifts are available in the EGS field from Steidel et al. (2003) and from the DEEP2 survey (Cooper et al. 2006). An initial sample of 16 galaxies has been selected with . One galaxy (Westphal MD99) has been discarded since it has been detected at 24 micron by Rigopoulou et al. (2006), suggesting possible AGN activity, and it is also contaminated by a foreground object. Thus, a final sample of 15 galaxies has been extracted from the EGS database.
2.3 The CANDELS/GOODS-North field
In order to explore the LyC radiation of faint galaxies, we successfully proposed an LBT Strategic Program (PI A. Grazian) during the Italian LBT Call for Proposals 2012B, with the aim of obtaining ultra deep imaging in the U and R bands of the CANDELS/GOODS-North field (Grogin et al. (2011); Koekemoer et al. (2011); Grazian et al. in prep. ) with the LBC instrument. The same area has been observed also by other LBT partners (AZ, OSURC, and LBTO), for a total exposure time of 33 hours in U band (seeing 1.1 arcsec) and 26 hours in R band (seeing 1.0 arcsec). The detailed description of this dataset is provided in a different paper (Grazian et al. in prep. ) summarizing all the LBC deep observations available in the CANDELS fields. The long exposure time and the relatively good seeing obtained allow us to reach a magnitude limit in the U band of 30.2 mag at S/N=1, resulting in one of the deepest UV images acquired so far (Ashcraft et al. (2016)). The LBC R band, instead, reaches a magnitude limit of 27.8 at 80% completeness level for point sources.
The GOODS-North field is one of the premier targets of spectroscopic campaigns with the Keck and other smaller telescopes, thanks to the multiwavelength coverage of this area from X-ray to the Far IR. In particular, Barger et al. (2008) collected 2907 spectroscopic redshifts for galaxies and stars in the ACS footprint (Giavalisco et al. (2004)), resulting in a 90% spectroscopic completeness at mag. Additional information has been provided by Cooper et al. (2011); Pirzkal et al. (2013); Wirth et al. (2015), just to mention few examples of the numerous work which provided spectroscopic redshifts in the GOODS-North area. We have selected from this large database 11 galaxies with , the redshift range suitable for LyC analysis with the LBC U-band filter. These galaxies are all the objects in this tiny redshift interval, without any biases against or in favour of Lyman- emitters. One of these galaxies (RA=12:37:33.2, DEC=+62:17:51.9) is extremely faint () and no meaningful constraint on the escape fraction can be achieved with the present depth of the LBC U-band image. Moreover, this galaxy is also contaminated by a brighter galaxy at less than 1.5 arcsec distance, so we decided to remove this object from our sample. In the end, the final sample in the GOODS-North field consists of 10 galaxies, of which two objects (with in Table 1) are outside the CANDELS area.
2.4 The faint lensed galaxy sample
To push our LyC analysis even deeper, we added the lensed galaxy by Amorin et al. (2014), at z=3.417 and magnified by a factor of 40, with intrinsic magnitude of , corresponding to (). The properties of this galaxy have also been discussed by van der Wel et al. (2013). Interestingly, this galaxy has been classified as a metal poor galaxy by Amorin et al. (2014), with (or equivalently ). In addition, it shows high ionization conditions, with [OIII]/H ratio and [OIII]/[OII]. We also consider two lensed galaxies at with properties similar to this object from the literature (Christensen et al. 2012, Bayliss et al. 2014), where upper limits to the LyC escape fraction have been provided. The properties of these galaxies resemble the Green Peas selected by Cardamone et al. (2009), and they are thus very promising candidates to investigate for their possible contribution to the H I ionizing background, as recently proposed by Izotov et al. (2016a), Vanzella et al. (2016), Schaerer et al. (2016), Stark et al. (2017), Verhamme et al. (2017).
2.5 The total sample
In total, a sample of 79 star-forming galaxies within the redshift range has been assembled, of which 45 have been already presented in Boutsia et al. (2011) and Grazian et al. (2016). The properties of the additional 34 galaxies are summarized in Table 1. The results on the LyC emission properties are instead based on the whole sample of these 79 star-forming galaxies with deep LBC data available and are summarized in the next sections. One of these 79 galaxies is the lens by Amorin et al. (2014). In the final sections, we also consider two additional lensed galaxies at from the literature, without LBC coverage (Christensen et al. 2012, Bayliss et al. 2014). They have been added to our sample since they are relatively faint galaxies (magnified by strong lensing) with an independent estimation of their LyC escape fraction.
3 The Method
3.1 Estimating the Lyman Continuum Escape Fraction of galaxies
We adopt here the same methodology described by Grazian et al. (2016) in order to estimate the individual values of the galaxy Lyman Continuum escape fraction and the sample mean at . In particular, we focus on the new sample of 34 galaxies with known spectroscopic redshifts and with wide and deep imaging from COSMOS, EGS, and CANDELS/GOODS-North. Briefly, we summarize here the adopted technique.
Following Grazian et al. (2016), we started from images by LBC in the U and R bands, which at are sampling the rest frame wavelengths at 900 and 1500 Å, respectively. The relevant galaxies have been selected in a narrow redshift range (), with the aim of measuring, with the U-band filter of LBC, only the wavelength region at Å rest frame (see Fig. 1 of Boutsia et al. 2011). The average Lyman continuum absorption by the IGM in the spectra of sources indeed increases rapidly towards bluer wavelengths. For this reason the search for any detection of hydrogen ionizing emission is quite inefficient below 850 Å rest, which is sampled by the LBC U-band filter in spectra of galaxies. The red leakage of the U-band filter of LBC is negligible333http://lbc.oa-roma.inaf.it/Filters/List.html, and it is not affecting the following results.
Crucially, almost all the new 34 galaxies have associated deep HST imaging from the COSMOS, EGS, and CANDELS/GOODS-North surveys (Scoville et al. (2007); Grogin et al. (2011); Koekemoer et al. (2011); Stefanon et al. (2017)) at several wavelengths from the V to the H bands (for the CANDELS/GOODS-North field the B band of HST is also available), which are essential in order to avoid spurious contamination by foreground sources. In the latter field, for example, there are three sources (ID=16479, 16169, 18979) with bright galaxies with close to their line of sights. Two (16169, 18979) are well separated ( arcsec), while source ID=16479 is closer ( arcsec) and results in a blend in the LBC images. We will discuss the properties of this source in the next sub-section.
The HST fields used here also have deep X-ray observations by the Chandra satellite (Alexander et al. (2003); Nandra et al. (2015); Civano et al. (2016)). We have used this information to avoid possible contamination by faint AGNs. None of our 34 galaxies shows any X-ray emission at the levels probed by the Chandra images, thus excluding the presence of an X-ray strong AGN nucleus inside.
As carried out in Grazian et al. (2016), we have measured the “relative” escape fraction, which is defined as the fraction of emitted Lyman continuum photons, IGM corrected, related to the observed fraction of photons at 1500 Å rest frame (Steidel et al. (2001); Siana et al. (2007)). The relative escape fraction is usually derived from the observations of the flux ratio between 900 and 1500 Å rest:
| (1) |
where is the ratio of the intrinsic luminosities at 1500 and 900 Å rest frame, is the ratio of the observed fluxes in the R and U band, is the optical depth of the IGM at 900 Å rest frame. The absolute escape fraction is defined as , where the first factor indicates the ISM extinction, while is the dust absorption coefficient at 900 Å rest frame. In this paper, as in Grazian et al. (2016), we adopt a value of 3. In Guaita et al. (2016) we have explored the dependencies of this quantity on the various population synthesis models, concluding that a reasonable range for this ratio can be between 2 and 7. In Grazian et al. (2016) we have considered the implications of different assumptions of the intrinsic luminosity ratio parameter on the estimations of the escape fraction and LyC emissivity.
To correct for the mean effect of the IGM absorption we have adopted the recent estimates by Worseck et al. (2014) and Inoue et al. (2014). Folding the IGM absorption at with the U-band filter of LBC and adopting the same procedure outlined in Boutsia et al. (2011), we obtain a mean IGM transmission at . In the next section we explore the implications of the variance of the IGM absorption along multiple lines of sight, using the same methodology adopted in Grazian et al. (2016).
For each galaxy we have computed the observed flux ratio from the LBC images in the U and R bands in the same way as in Grazian et al. (2016). Briefly, we detect the galaxy in the R band using SExtractor (Bertin & Arnouts (1996)), and measure the flux in the U band assuming the same profile of the galaxy in the R band through the ConvPhot software (De Santis et al. (2007)), taking into account the transfer function (convolution kernel) to change the spatial resolution of the R band into the U-band one. As discussed in Grazian et al. (2016), this PSF-matched photometry allows us to derive errors on fluxes which are typically a factor of 1.7 smaller than the ones measured by SExtractor through aperture photometry. In case of non-detection in the U band, a 1- upper limit to the flux in this filter is set by the flux error provided by ConvPhot. Assuming an average IGM transmission of 0.28 at , we compute the relative escape fraction for each individual galaxy adopting Eq.1, and provide the relevant quantities in Table 1.
| (deg) | (deg) | (AB) | (AB) | ||||||
| 53167 | COSMOS | 149.852446 | +2.397032 | 3.359 | 22.95 | 29.38 | -22.75 | 0.029 | No |
| 218783 | COSMOS | 149.920820 | +2.387060 | 3.297 | 24.49 | 29.39 | -21.21 | 0.118 | No |
| 223954 | COSMOS | 149.831880 | +2.404150 | 3.371 | 24.77 | 29.58 | -20.93 | 0.128 | No |
| 219315 | COSMOS | 149.839520 | +2.388460 | 3.363 | 25.21 | 29.70 | -20.49 | 0.171 | No |
| 215511 | COSMOS | 149.848260 | +2.376170 | 3.363 | 25.24 | 29.70 | -20.46 | 0.176 | No |
| 220771 | COSMOS | 149.836280 | +2.393190 | 3.359 | 24.84 | 29.22 | -20.86 | 0.188 | No |
| 217597 | COSMOS | 149.865340 | +2.382770 | 3.284 | 25.73 | 29.88 | -19.97 | 0.233 | No |
| 211934 | COSMOS | 149.847250 | +2.364040 | 3.355 | 26.86 | 29.64 | -18.84 | 0.827 | No |
| 59330a | COSMOS | 150.077045 | +2.360797 | 3.417 | 24.15 | 28.93 | -17.40 | 0.232 | No |
| 6328 | EGS | 214.586647 | +52.512559 | 3.357 | 24.26 | 29.89 | -21.44 | 0.060 | No |
| 9524 | EGS | 214.500676 | +52.477565 | 3.295 | 24.06 | 29.54 | -21.64 | 0.069 | No |
| 6439 | EGS | 214.552783 | +52.511284 | 3.392 | 24.15 | 29.56 | -21.55 | 0.073 | No |
| 724 | EGS | 214.501128 | +52.570535 | 3.353 | 24.76 | 30.06 | -20.94 | 0.081 | No |
| 6922 | EGS | 214.461916 | +52.505537 | 3.351 | 24.71 | 29.95 | -20.99 | 0.086 | No |
| 4580 | EGS | 214.508258 | +52.531509 | 3.279 | 24.79 | 29.90 | -20.91 | 0.096 | No |
| 8642 | EGS | 214.460301 | +52.487802 | 3.285 | 24.50 | 29.60 | -21.20 | 0.098 | No |
| 5197 | EGS | 214.283603 | +52.524388 | 3.271 | 24.52 | 29.15 | -21.18 | 0.150 | No |
| 6612 | EGS | 214.500033 | +52.509127 | 3.340 | 25.89 | 30.45 | -19.81 | 0.162 | No |
| 2783 | EGS | 214.554012 | +52.549350 | 3.272 | 25.70 | 30.02 | -20.00 | 0.200 | No |
| 12335 | EGS | 214.455464 | +52.446348 | 3.287 | 25.32 | 29.61 | -20.38 | 0.205 | No |
| 13346 | EGS | 214.413697 | +52.433529 | 3.307 | 24.73 | 28.87 | -20.97 | 0.237 | No |
| 7690 | EGS | 214.249912 | +52.497386 | 3.272 | 25.18 | 28.77 | -20.52 | 0.392 | No |
| 11372 | EGS | 214.407226 | +52.458201 | 3.294 | 25.36 | 28.48 | -20.34 | 0.603 | No |
| 14043 | EGS | 214.376422 | +52.424380 | 3.344 | 25.18 | 28.29 | -20.52 | 0.610 | No |
| 16428 | GDN | 189.216181 | +62.254036 | 3.333 | 23.91 | 29.82 | -21.79 | 0.048 | No |
| 19977 | GDN | 189.179397 | +62.276656 | 3.363 | 24.38 | 30.03 | -21.32 | 0.061 | No |
| 12305 | GDN | 189.219779 | +62.227532 | 3.369 | 25.09 | 30.35 | -20.61 | 0.087 | No |
| 4341 | GDN | 189.290579 | +62.171244 | 3.384 | 24.68 | 29.81 | -21.02 | 0.094 | No |
| 14132 | GDN | 189.206264 | +62.239252 | 3.367 | 25.44 | 30.23 | -20.26 | 0.135 | No |
| 91200 | GDN | 189.311200 | +62.311020 | 3.390 | 25.76 | 30.21 | -19.94 | 0.184 | No |
| 16169 | GDN | 189.215365 | +62.252800 | 3.364 | 25.42 | 29.67 | -20.28 | 0.214 | No |
| 18979 | GDN | 189.296340 | +62.270650 | 3.350 | 25.80 | 29.90 | -19.90 | 0.246 | No |
| 91000 | GDN | 188.999330 | +62.202417 | 3.300 | 26.53 | 30.21 | -19.17 | 0.377 | No |
| 16479 | GDN | 189.194532 | +62.254757 | 3.371 | 25.00 | 27.79 | -20.70 | 0.821 | Yes |
The galaxies have been sorted in ascending order of relative escape fraction in each field (COSMOS, EGS, GDN=CANDELS/GOODS-North). The identification number, , is the LBC one for COSMOS and EGS fields, while it is the CANDELS official identifier for the GOODS-North field. Two sources, indicated by , are outside the CANDELS/GOODS-North area. The non detections (i.e. ) in the LBC U-band, for which an upper limit (at ) to the relative escape fraction has been provided, are indicated by the and symbols, respectively. The last column, , indicates whether a galaxy is possibly contaminated by foreground objects. Notes on individual objects: (a): object ID=59330 in COSMOS is the lensed galaxy studied by van der Wel et al. (2013) and by Amorin et al. (2014). The U- and R-band magnitudes are the observed photometry for ID=59330, while the absolute magnitude provides the intrinsic luminosity after the correction by a magnification factor of .
3.2 Detailed analysis of the possible LyC emitters
In Grazian et al. (2016) we have discussed the issue of foreground contaminants mimicking significant LyC detection in the COSMOS field. In Table 1 there are two galaxies with significant () LyC relative escape fraction, ID=11372 in the EGS field and ID=16479 in GOODS-North. In order to check their reliability, we carried out some checks, as done in Grazian et al. (2016). In particular, we used HST data from the CANDELS and AEGIS surveys in order to evaluate the reliability of these LyC emitter candidates.
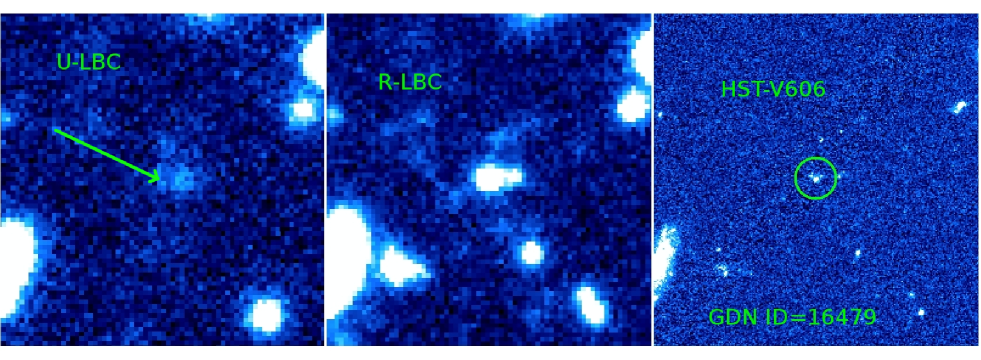
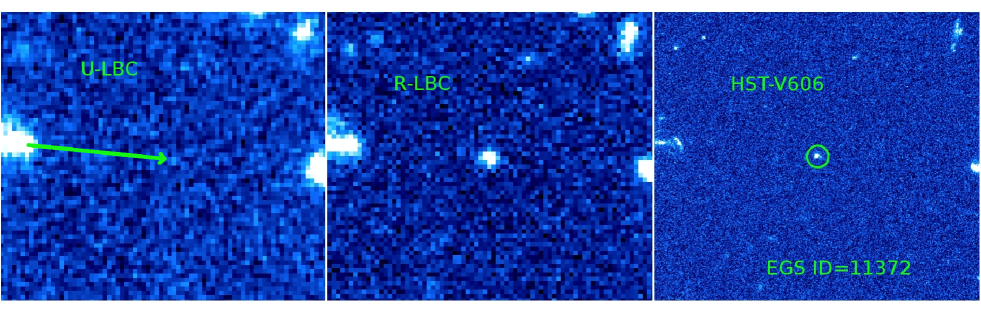
Figure 1 shows the galaxy ID=16479 in the CANDELS/GOODS-North field in the U and R band by LBC and in the HST V606 filter (the closest band to the LBC-R one). At the right of the galaxy (identified by a green circle in the HST thumbnail) there is a faint source at arcsec distance, which is clearly detected in the three bands. If we assume that the two sources are at the same redshift () and compute their escape fraction, we find . If we evaluate the escape fraction only of the fainter galaxy to the right (outside the green circle) and assuming it is at , we end up with . In this case, similar to that already reported by Vanzella et al. (2012a) and Grazian et al. (2016), the so-called “local” escape fraction (i.e. calculated in a small region showing LyC emission) is not compatible with the stellar population of a galaxy, indicating a clear sign of contamination by a lower-z interloper. In fact, even assuming a higher ionizing efficiency (i.e. a lower value of 2.0, instead of 3.0) and a more transparent line of sight with (i.e. the upper value of the IGM transmission at 95% c.l.), the resulting “local” escape fraction is 170%, confirming the interloper interpretation for this object. Indeed, the brighter galaxy at the center of the green circle in Fig. 1 has different colors with respect to the faint blob on the right, which is thus probably at a different redshift. This system has already been studied by Reddy et al. (2006), labeled as BX1334. Interestingly, it has been selected as a BX galaxy (with colors compatible with galaxies at photometric redshifts between 2.0 and 2.7, see Adelberger et al. (2004)), and it has NIR colors which are compatible with the distant red galaxy (DRG) criterion ( mag, according to Franx et al. (2003)). From the CANDELS photometry a redshift of has been derived for this close-by source, indicating that this is plausibly a lower-z contaminant.
Using HST data in the V606 band, it is possible to compute the relative escape fraction of the galaxy reducing the contamination by the foreground interloper on the right. Adopting as a prior for ConvPhot the HST image we obtain an U-band magnitude of 27.79, corresponding to . This could thus be a genuine LyC emitter at . However, close to the galaxy there are also two very faint blobs in the HST image, which are blended with the main target in the ground-based images by LBC. A faint off-center emission in the U band of LBC has been detected, and this is possibly associated to the faint blob close to the galaxy (towards the right). There is thus an indication of a possible contamination by foreground objects, even if in this case no firm conclusions can be drawn.
The second object ID=11372, shown in Fig. 2, is at best marginally detected at 1.5 in the U band, and its relative escape fraction is . This galaxy has been originally studied by Steidel et al. (2003) as the object C029 of the Westphal field. Its morphology in the HST V606 band is almost point-like, but no X-ray detection has been found for this galaxy, and thus an AGN classification for this object cannot be confirmed. Even for this object there is a hint in the HST image of a very faint blob close to the galaxy (at 0.1 arcsec towards the right), which can act as a possible faint contaminant, compatible with the marginal (1.5 sigma) detection in the U band. However, no firm conclusions can be drawn for this galaxy, and deeper data with LBC in the U band and HST in the V606 band are needed in order to understand its nature. It is possible indeed that the distribution of the escape fraction of galaxies is bimodal, with the bulk of the star-forming population showing small values of LyC emission, while few objects emit large amount of ionizing radiation (e.g. Ion2, Vanzella et al. 2016).
In Table 1, we mark the ID=16479 galaxy as possibly contaminated by a foreground object, while the galaxy ID=11372, where this hypothesis is weak, is considered as a possible LyC emitter, pending deeper observations. In the following sections we investigate the properties of the whole star-forming galaxy population at , relying on the stacking procedure of the LBC images.
In summary, the properties of the new sample of 34 galaxies at in the COSMOS, EGS, and CANDELS/GOODS-North fields have been collected in Table 1. They have been merged with the 45 SFGs at the same redshifts studied in Grazian et al. (2016) from the VUDS/LBC-COSMOS database, resulting in a total sample of 79 galaxies. However, not all of them have been used to compute the H I ionizing emissivity of the SFG population at . We have indeed discarded 9 galaxies possibly affected by contamination due to foreground objects. Of this sub-sample, eight galaxies were discussed in detail in Grazian et al. (2016) and an additional galaxy has been discarded from Table 1, i.e. ID=16479 in the CANDELS/GOODS-North field. The galaxy ID=59330 in the COSMOS field is the lensed object studied by Amorin et al. (2014) and it will not be considered in the stacking procedure, which is restricted to the 69 galaxies of luminosity .
4 Results
We consider here the stack of the cleaned sample in the U and R bands by LBC and provide the mean values for the whole population of 69 galaxies not affected by contamination and for various sub-samples at different R-band magnitudes.
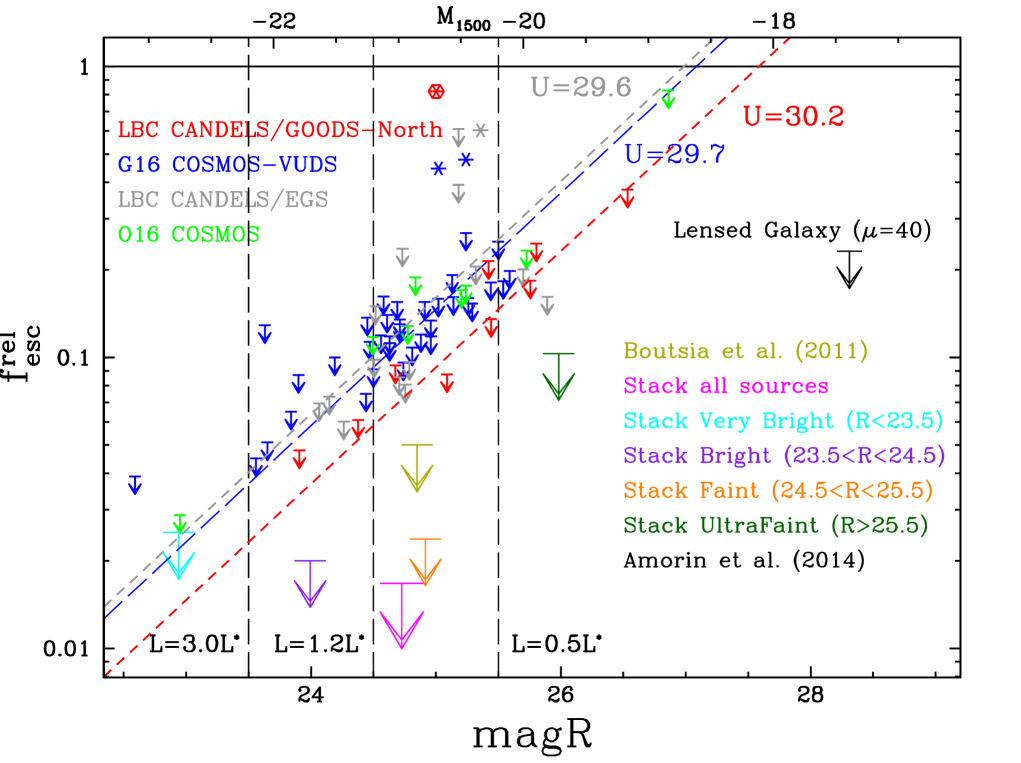
Fig. 3 summarizes the properties of the cleaned sample as a function of the observed R-band magnitude. In this plot, the blue symbols indicate the VUDS/LBC-COSMOS galaxies published in Grazian et al. (2016), while the green, red, and grey arrows are for sources in the COSMOS (Onodera et al. 2016), CANDELS/GOODS-North, and EGS fields, respectively. The small downward arrows indicate 1 upper limit for the individual , while asterisks show detections in LyC above 1. The hexagon upon the red asterisk indicates the galaxy ID=16479 in the CANDELS/GOODS-North field, which is probably affected by foreground contamination. The grey, blue, and red dashed lines show the escape fraction vs R-band magnitude corresponding to the depth of the U band in the EGS, COSMOS, and CANDELS/GOODS-North fields, respectively (U=29.6, 29.7, and 30.2), derived using Equation 1. The scatter of the observed galaxies around these lines is due to the small differences in depth on the images and on the different morphologies of the sources (more extended galaxies have slightly shallower magnitude limits).
4.1 Constraints on the escape fraction from stacking
We then proceed with the stacking of the LBC U and R bands of the clean sample in different luminosity intervals. We repeat the same procedures outlined in Grazian et al. (2016), which we summarize in the following. We cut a small thumbnail () of the LBC U- and R-band images centered on each galaxy, we mask all the nearby sources, detected in the R band, leaving unmasked the central region, then we compute the weighted mean of all the thumbnails in a given band using the inverse variance map as a weight. We measure the on the stacked images adopting the same technique outlined above, i.e. using ConvPhot.
We first proceed with the stacking in different R-band magnitude intervals, then we carry out the sum of all the galaxies in Grazian et al. (2016) and in Table 1, except for the contaminated object (ID=16479) in the CANDELS/GOODS-North field and the lensed galaxy by Amorin et al. (2014). We do not achieve any significant detection in the U-band above in the stacked images, resulting in several upper limits to the LyC escape fraction. We plot the results of the stacking in different luminosity intervals in Fig. 3 with large arrows, and summarize all the relevant values in Table 2.
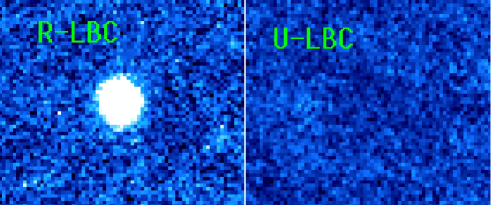
We do not detect for the stacks significant dependencies of on luminosity at , corresponding to , where a constant value of 2-2.5% has been determined (cyan, purple, and orange arrows in Fig. 3). Stacking of all the 69 galaxies (we do not consider the lensed galaxy by Amorin et al. 2014) in U and R band resulted in a non detection in the U band to a level of at 1 and a clear detection in the R band of at S/N=414, as shown in Fig. 4. This translates into a limit to the observed ratio between R and U band of , which is equivalent to an upper limit to the relative escape fraction of at 1 level at z=3.3 (magenta arrow in Fig. 3). This is the most stringent limit to the relative escape fraction for star-forming galaxies. The inclusion of the three galaxies detected in the U band (two galaxies discussed in Grazian et al. (2016) and ID=16479 in the CANDELS/GOODS-North field) does not change significantly the results of the stacking ().
The uncertainties on the relative escape fraction of the stack due to the IGM variance has been derived following the same procedures outlined in Grazian et al. (2016). Considering 69 lines of sight, the mean IGM transmission, folded with the U-band filter by LBC, has an uncertainty of . Using this error, the 68% confidence level for our value of is between 1.54 and 1.82%. In the following, we will use the derived limit , without considering its small associated uncertainty.
4.2 Constraints on the escape fraction from strong gravitational lensing
Ultra-deep UV imaging in blank fields with LBC are reaching a magnitude limit of (AB), but these depths do not allow us to push the constraints of the escape fraction below at . On the other hand, relatively deep LBC data in the U and R bands have been used to put a limit to the LyC escape fraction of the lensed galaxy by Amorin et al. (2014), thus allowing us to explore the regime of sub- galaxies at . A 1 upper limit to the escape fraction of 23.2% has been derived at , which can add new observational constraints to the theoretical models predicting that sub- galaxies at high-z have high escape fractions, and are thus the main drivers of the reionization of the Universe (e.g. Ferrara & Loeb (2013); Ellis (2014); Bouwens et al. (2015); Finkelstein et al. (2015)).
Other examples of strongly magnified galaxies at can be found in the literature. Christensen et al. (2012) reported the case of a lensed LBG (SMACS J2031.8-4036 ID 1.1) at with a LyC escape fraction estimate from their X-shooter spectrum. This galaxy has an absolute magnitude, after correction for magnification, of and the constraint on the escape fraction is . Their conservative upper limit for the escape fraction, thanks to strong lensing magnification, is fully consistent with the individual limits on galaxies at the depth of the CANDELS/GOODS-North U-band observations of this paper. The spectral properties of this peculiar galaxy are similar to the ones observed in Ion2 by Vanzella et al. (2016), and usually associated with possible LyC emissivity: this galaxy indeed shows low metallicity () and a high ionization parameter (), presenting high [OIII]/[OII] and [OIII]/H line ratios. Following recent claims (Vanzella et al. (2016); Izotov et al. (2016b); Schaerer et al. (2016); Nakajima & Ouchi (2014); Nakajima et al. (2016)), a much larger escape fraction should be expected for this object. Due to its bright observed magnitude () this galaxy could be an ideal target for future deep follow-up spectroscopy with efficient UV spectrographs in the LyC region.
Another interesting object is the Green Pea SGASJ105039.6+001730 at z=3.6252 studied by Bayliss et al. (2014). This galaxy has a magnification factor of , with an absolute magnitude of after corrections for strong lensing. Like the previous example, this object also shows line ratios ([OIII]/[OII] and [OIII]/H) and is expected to emit ionizing radiation with a large escape fraction, due to the significant ionization efficiency. Surprisingly, the spectroscopic data indicate that the neutral column density is and thus the escape fraction is negligible (%). It is worth noting that the profile of the Lyman- line in emission is also compatible with an associated absorption, in agreement with the measured high column density of neutral hydrogen. If its low is confirmed, this result gives stringent limits to the LyC escape fraction at which are comparable with the constraints we have obtained in this work by stacking 69 galaxies (). It thus stresses the importance of the lensing magnification for this type of studies, as also shown by Vasei et al. (2016) at . Similar studies will be important in the future to extend the investigated range of at very low luminosities.
| Sample | Rmag | |||
| (AB) | (1) | |||
| Very bright () | 2 | 22.94 | -22.8 | 0.025 |
| Bright () | 16 | 23.99 | -21.7 | 0.020 |
| Faint () | 42 | 24.92 | -20.8 | 0.024 |
| Ultra-faint () | 9 | 25.98 | -19.7 | 0.103 |
| Stack all sources | 69 | 24.73 | -21.0 | 0.017 |
| Lensed () | 1 | 28.31 | -17.4 | 0.232 |
| Christensen et al. (2012) | 1 | -20.4 | 0.11 | |
| Bayliss et al. (2014) | 1 | -20.5 | 0.01 |
The lensed galaxy with is described in Amorin et al. (2014). The galaxy by Bayliss et al. (2014) has , resulting in a null escape fraction. We provide here a very conservative upper limit of 1% for this object.
4.3 Does the escape fraction depend on luminosity ?
In Grazian et al. (2016) we have shown that star-forming galaxies brighter than 0.5 at cannot produce the UV background (UVB) as measured by the Lyman forest. Here we explore the role of fainter galaxies.
In Fig. 3 we observe an apparent trend of looser limits of the escape fraction with fainter R-band magnitudes. This correlation is clearly due to the U-band depth of our imaging database. At a given luminosity, indeed, the measured upper limits on the escape fraction of each individual galaxy depend on the different depths of the COSMOS, EGS, and CANDELS/GOODS-North fields, and they are not related to an intrinsic property in the population of star-forming galaxies.
The stacking at indicates that is below 2-2.5% level, while at fainter magnitudes the constraints are less well-determined, with at and at mag, even if in the latter case only one galaxy has been used to provide this limit, and uncertainties due to the IGM variance still hold.
Leethochawalit et al. (2016), using the gas covering fraction () of low ionization gas as an indirect proxy for the galaxy escape fraction ( neglecting dust absorption), found that there is a weak anti-correlation of the supposed with the SFR, with a typical value of for SFR of the order of 10-100 at . The range in SFR of their galaxies translates into an R-band magnitude of , so it is interesting to note that the value of inferred in their work is slightly higher than what we measure.
A rough explanation is that the gas covering fraction can provide only an upper limit to the LyC escape fraction, which in fact could be significantly lower. A notable example is the lensed galaxy by Vasei et al. (2016): it has a low gas covering fraction, mimicking an escape fraction of , but when a direct measurement is carried out, a upper limit of 8% has been derived, significantly lower than the value inferred from the gas covering factor (see also Dijkstra et al. 2016). These comparisons point thus to a possible inconsistency between the indirect results derived from the low covering fraction and the direct measurements of the LyC escape fraction. It is thus desirable that future claims of significant LyC emission be substantiated by direct detections. However, it is useful to recall here that the limits by Amorin et al. (2014) or Vasei et al. (2016) are based on single non-detections, which could be due also to a line of sight with substantial IGM attenuation, or to a patchy ISM. Larger databases of lensed, intrinsically faint galaxies are needed to distinguish these alternative hypotheses.
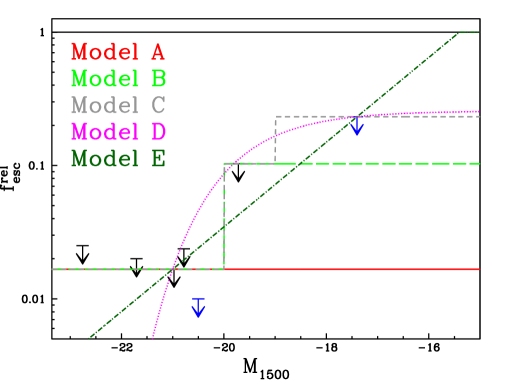
The data in Table 2 have been summarized in Fig. 5. Black arrows are the limits derived in this paper with LBC data through stacking, while blue arrows report constraints of individual lensed galaxies from the literature (Christensen et al. 2012, Amorin et al. 2014, Bayliss et al. 2014). We explore here different dependencies of the relative escape fraction with luminosity, with the aim of computing the total ionizing emissivity of faint galaxies. The galaxy by Bayliss et al. (2014) has , resulting in a very small () escape fraction. We provide here a very conservative upper limit of 1% for this galaxy in Fig. 5 only for graphical reasons. The real emissivity value will be probably lower than this limit.
Different parameterizations of the escape fraction as a function of luminosity have been explored in Fig. 5. It is worth stressing here that these dependencies are not the best fit to the observed data, but they are simply analytic functions (constant, exponential or power law) which are reasonably consistent with the observed stack limits, i.e. with looser constraints at fainter luminosities. These functions are not physically motivated, but they explore possible dependencies of the escape fraction on luminosity allowed by the observed constraints. Indeed, it is useful to recall that the contribution by bright galaxies does not change significantly if we impose or , due to the exponential cut-off of the luminosity function at the bright end.
We have explored in Fig. 5 five different parameterizations for :
-
•
A: constant at 1.7% at all luminosities (continuous red line). This is not consistent with the limit of Bayliss et al. (2014), but can be easily scaled to with a simple multiplicative factor.
-
•
B: two-step function: 1.7% at and 10.3% at fainter magnitudes (long-dashed green line).
-
•
C: three step function: 1.7% at , 10.3% at, and 23.2% at fainter magnitudes (short-dashed grey line).
-
•
D: exponential law , with and (dotted magenta line).
-
•
E: power law with and (dot-dashed dark green line).
The various evolutionary parameterizations of the escape fraction as a function of the galaxy luminosity will be used in the next section to derive different estimates of the average galaxy emissivity at .
5 Estimating the Ionizing Emissivity produced by star-forming galaxies at
The rate of ionizing photons produced by star-forming galaxies can be expressed as , where the three terms on the right side can be evaluated upon reasonable assumptions.
The first term, , is the emissivity of high-z star-forming galaxies, measured at a non-ionizing wavelengths, typically at 1500 Å rest frame. It can be obtained by integrating the luminosity function of galaxies, multiplied by their luminosities, down to faint limits, e.g. . The ionization efficiency measures the rate of ionizing photons produced by a given amount of UV (1500 Å rest frame) luminosity. It depends on the nature of the stellar populations that developed in distant galaxies (i.e. IMF, age, metallicity, binary fraction). Finally, the absolute escape fraction measures the percentage of ionizing radiation, produced by stars, which is not absorbed by gas and dust in the ISM and is finally emitted in the surrounding IGM. In practice, it is the ratio between the observed and produced fluxes at 900 Å rest frame. Numerous attempts have been carried out recently to evaluate the ionization efficiency of high-z galaxies (Dunlop et al. (2013); Robertson et al. (2013); Bouwens et al. 2016a just to mention several examples).
However, a number of assumptions are hidden on the calculations of the rate of ionizing photons , and its derivation suffers from intrinsic degeneracies between the physical properties assumed for the underlying stellar populations. More importantly, the two quantities and are by definition degenerate, since different combinations of absolute escape fraction and production efficiency of ionizing photons can give the same observed properties for a galaxy. It is not easy, indeed, to provide an unbiased estimation for the absolute escape fraction . Since the intrinsic SEDs of star-forming galaxies are not known a priori in the far UV, assumptions on the physical properties of the galaxies (stellar populations, age, star formation history, metallicity, etc.) must be adopted. In particular, the choice of stellar population synthesis model can change the intrinsic LyC emissivity up to a factor of 1.5 or 2, if prescriptions for the treatment of the stellar binaries are adopted (e.g. Eldridge & Stanway (2009); Stanway et al. (2016)). Moreover, since the age of our galaxies are not well constrained, the intrinsic LyC production is uncertain by a similar factor.
We choose, instead, an alternative approach based on the relative escape fraction, as described in Equation 1. Following Grazian et al. (2016), we choose to derive the ionizing emissivity adopting the following relation:
| (2) |
where the factor is proportional to . In this case the advantage, thanks to Equation 1, is that can be written as which is the product of two quantities less subject to systematic uncertainties or assumptions, and, neglecting the extinction by dust, it is equivalent to .
The “relative” escape fraction, by definition, depends on the assumed ratio and, as such, it is not free from assumptions on the physical properties of the galaxies. But its main advantage, as discussed in Grazian et al. (2016), is that its dependencies on the physical properties of the galaxies are canceled out when one computes the emissivity at Å rest, by combining Eq.1 with Eq.2. The only parameter critically affecting Eq.2 is the input luminosity density of non-ionizing radiation, . To obtain this value it is sufficient to integrate an observed luminosity function, multiplied by the absolute luminosity, down to a specific magnitude limit.
In addition, it is useful to express the LyC emissivity in terms of the H I photo-ionizing background , in units of photons per second. Following Grazian et al. (2016), we have:
| (3) |
where is the photo-ionization cross section of hydrogen at Å, is the spectral slope of the stellar ionizing radiation (see Faucher-Giguère et al. (2009)) and is the Planck constant. The mean free path of ionizing photons is 83.5 proper Mpc at z=3.3, following the fitting formula by Worseck et al. (2014).
We derive the relevant quantities needed to compute in the following sub-sections.
5.1 The luminosity function of galaxies at
An accurate estimate of the shape of the luminosity function at the faint end is crucial to quantify the luminosity density , and hence the H I photo-ionization rate produced by SFGs at . As in Grazian et al. (2016), we have explored different determinations for the luminosity function of star-forming galaxies at these redshifts. We have collected relevant luminosity functions at from the literature, exploring the last ten years. In Table 3 we have summarized the adopted parameters for the Schechter function (, , ) of those recent works. Fig. 6 shows the different shapes of the galaxy luminosity functions at .
| LF | Reference | Notes | |||
|---|---|---|---|---|---|
| 01 | -20.71 | 0.00055 | -1.94 | Alavi et al. (2016) | LF at 2.2¡z¡3.0 1500 Å rest frame |
| 02 | -20.20 | 0.00532 | -1.31 | Parsa et al. (2016) | LF at z=2.8 1500 Å rest frame |
| 03 | -20.71 | 0.00206 | -1.43 | Parsa et al. (2016) | LF at z=3.8 1500 Å rest frame |
| 04 | -20.61 | 0.00161 | -1.54 | Parsa et al. (2016) | best fit at z=3.3 1500 Å rest frame |
| 05 | -20.45 | 0.00410 | -1.36 | Weisz et al. (2014) | LF z=3.0 1500 Å rest frame |
| 06 | -21.40 | 0.00086 | -1.50 | Cucciati et. al. (2012) | 1500 Å rest frame |
| 07 | -20.94 | 0.00179 | -1.65 | van der Burg et al. (2010) | z=3.0 1600 Å rest frame |
| 08 | -20.97 | 0.00171 | -1.73 | Reddy & Steidel (2009) | z=3.05 1700 Å rest frame |
| 09 | -20.90 | 0.00167 | -1.43 | Sawicki & Thompson (2006) | z=3.0 1700 Å rest frame |
Cucciati et. al. (2012) didn’t actually measure the faint end slope at , but fixed this value based on lower-z luminosity functions.
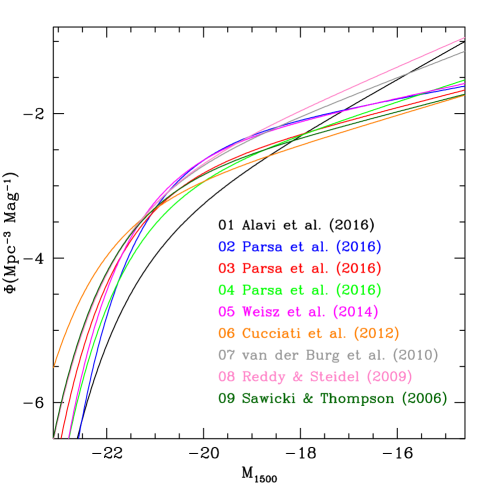
A recent collection of luminosity functions from the literature has been provided by Parsa et al. (2016). They computed the luminosity function in two redshift bins, and . Moreover, they also provide an analytic formula to derive the parameters of the Schechter function depending on redshift. In Table 3 we consider the best fit of the relations given by Parsa et al. (2016) at . The steep luminosity functions by van der Burg et al. (2010) and Reddy & Steidel (2009) are not in agreement with the flatter () functions at (Parsa et al. 2016). A notable exception is the result of Alavi et al. (2016), with a slope of -1.9 and extending down to , thanks to strong lensing magnification. It is interesting to note that the luminosity functions derived on lensing fields are usually steeper than the one obtained in blank fields (see also Livermore et al. (2017) and Bouwens et al. 2016b for similar comparisons at ). This fact could be related to possible, still unknown, biases linked to the lensing amplification or completeness corrections. However, the main aim here is not to do a critical review of all the luminosity functions in the literature, but to select a representative sample in order to explore the implications on the calculations of the photo-ionizing background.
From Fig. 6 we can notice a large variance in the galaxy number density, especially at faint luminosities. At luminosities brighter than () this scatter does not influence the estimate of the photo-ionization rate : as already shown by Grazian et al. (2016), the contribution of bright galaxies is not relevant, irrespective of the adopted parameterization of the luminosity function. This is mainly due to the relatively low escape fraction () and to the low number densities at these bright luminosities. At fainter magnitudes, we can identify in Fig. 6 three main families of luminosity functions: 1-high space densities both at intermediate and faint magnitudes, with at and at (07-van der Burg et al. 2010, 08-Reddy & Steidel 2009); 2-high space density at intermediate magnitudes but low density at fainter magnitudes, with at and at (02-Parsa et al. 2016 z=2.8, 05-Weisz et al. 2014); 3-low space densities both at intermediate and faint magnitudes, with at and at (03-Parsa et al. 2016 z=3.8, 04-Parsa et al. 2016 best fit at z=3.3, 06-Cucciati et al. 2012, 09-Sawicki & Thompson 2006). The luminosity function of Alavi et al. (2016) is an exception in these three groups, with very low space density around , but a steep faint end ().
In the next section we will use these luminosity functions to evaluate the photo-ionization rate for different evolving escape fraction with luminosities .
5.2 Estimating the H I photo-ionization rate
Table 4 summarizes the resulting photo-ionization rate for different parameterizations of and for different luminosity functions (Models A-E and luminosity functions 01-09, respectively). The relevant emissivities have been computed integrating the luminosity function from to mag, corresponding to luminosities . The lower bound in luminosity has been set to the faintest lensed galaxy for which we have an upper limit to the LyC escape fraction, the one by Amorin et al. (2014). We provide in Table 4 also the obtained extending the lower limit to mag, corresponding to a luminosity . For comparison, a recent estimate of the H I photo-ionization rate of at z=3.2 has been provided by Becker & Bolton (2013), hereafter BB13. We should take into account the contribution of the AGN population to : a conservative estimate by Haardt & Madau (2012) indicates at (see their Fig. 8a). Similarly, Cristiani et al. (2016) find a similar value at . Thus, a contribution by galaxies of at least is required in order to explain the measured UVB.
| Models | A | B | C | D | E | A | B | C | D | E |
|---|---|---|---|---|---|---|---|---|---|---|
| LF | ||||||||||
| 01 | 0.04 | 0.22 | 0.39 | 0.34 | 0.19 | 0.06 | 0.34 | 0.65 | 0.62 | 0.56 |
| 02 | 0.12 | 0.54 | 0.86 | 0.55 | 0.27 | 0.14 | 0.64 | 1.08 | 0.76 | 0.47 |
| 03 | 0.09 | 0.35 | 0.55 | 0.49 | 0.26 | 0.10 | 0.42 | 0.71 | 0.65 | 0.47 |
| 04 | 0.07 | 0.30 | 0.49 | 0.41 | 0.21 | 0.08 | 0.37 | 0.66 | 0.58 | 0.42 |
| 05 | 0.13 | 0.53 | 0.83 | 0.63 | 0.32 | 0.15 | 0.63 | 1.05 | 0.85 | 0.56 |
| 06 | 0.08 | 0.27 | 0.41 | 0.53 | 0.32 | 0.09 | 0.32 | 0.53 | 0.65 | 0.58 |
| 07 | 0.13 | 0.52 | 0.86 | 0.86 | 0.48 | 0.15 | 0.68 | 1.20 | 1.21 | 1.04 |
| 08 | 0.14 | 0.59 | 0.99 | 1.00 | 0.57 | 0.17 | 0.80 | 1.45 | 1.48 | 1.33 |
| 09 | 0.09 | 0.33 | 0.50 | 0.50 | 0.27 | 0.10 | 0.39 | 0.64 | 0.64 | 0.48 |
| Average | 0.10 | 0.41 | 0.65 | 0.59 | 0.32 | 0.12 | 0.51 | 0.89 | 0.83 | 0.66 |
In order to interpret Table 4, we can divide the Models A-E in three categories: the first one includes Model A (constant escape fraction of 1.7% at all luminosities), the second group (Model B and C) is characterized by low for galaxies brighter than and for fainter objects. Finally, a third group (Model D and E) has fainter than , and small values brighter than . As mentioned above, the luminosity functions can be divided as well in three main families, according to the space densities at and .
Looking at the left side of Table 4 (i.e. considering only galaxies brighter than ), it is easy to conclude that Model A has , much lower than the required UVB value of 0.4, for all the luminosity functions. Assuming a two-step function for (Model B), only the luminosity functions with high space density at can provide enough H I ionizing photons at . Models C and D are instead able to reach the required UVB for all the luminosity functions taken into account. If the LyC escape fraction raises exponentially at lower luminosities (Model E), then only the luminosity functions of van der Burg et al. (2010, LF=07) and Reddy & Steidel (2009, LF=08), with high space densities both at and , are able to reach the critical value for .
It is interesting to note that Model C has the maximum contribution to , w.r.t. the considered models A-E. Under this scenario, galaxies at could be the main contributors to the ionizing UVB and are crucial for our understanding of the role of star formation on the reionization and post-reionization phases.
The results above are valid if we take into account galaxies brighter than , or equivalently . If we extend the lower bound to (right side of Table 4) or even fainter, we obtain larger values of . In particular, all the considered luminosity functions are always able to reach the required UVB, except for constant escape fraction at the level of (Model A). Models with rapid increase of at faint luminosities (Models B, C, D, and E) give consistent with BB13, or even a factor of 2-3 higher when they are integrated down to . In this case, extremely faint galaxies, with luminosities between and are important for reproducing the UVB at , provided that the escape fraction is larger than 2% for all the faint star-forming galaxies. These regimes of luminosities will be hopefully investigated thanks to strong lensing magnification in the future (e.g. Vanzella et al. 2012b ).
6 Discussion
6.1 Comparison with predictions by theoretical models
It is interesting at this stage to compare the observed limits for shown in Fig. 5 with predictions from theoretical models. In general, many theoretical models predict ionizing escape fractions increasing for progressively fainter galaxies. A recent exception to this scenario is provided by the Sharma et al. (2016b) model where the escape fraction increases with the star formation surface density on scales of 1 kpc reaching 5% and 13% in galaxies with and , respectively. These predicted values are in contrast with our limits, which have been observed in galaxies in the same luminosity interval. We note that the starburst galaxy cited by Sharma et al. (2016b) as a clear prototypical example of luminous LyC emitter shows X-ray detection probably associated with AGN activity (see Guaita et al. 2016).
Price et al. (2016) and Faisst (2016) derived empirical constraints from low-redshift observations in order to get constraints on the escape fraction and LyC production efficiency of galaxies. They assume a redshift evolution of the absolute escape fraction starting at z=3.3 from values in the range , in tension with our observed value derived for bright galaxies (). Adopting values of 1-2%, in better agreement with our limits, would imply a rapid evolution of the escape fraction with a quick increase up to the maximum redshift allowed by the late reionization scenario suggested by the Planck 2016 data. It is also interesting to note that the empirical relation between [OIII]/[OII] ratio and adopted by Faisst (2016, Fig. 2) is not consistent with the observations of Christensen et al. (2012); Amorin et al. (2014); Bayliss et al. (2014). At and at relatively faint magnitudes, indeed, the latter have found that and 23% at and , respectively, while the observed line ratio is [OIII]/[OII]. It is thus important to note that a causal connection between the high ionization efficiency and the large escape fraction of ionizing radiation has not been established yet.
Anderson et al. (2016), Kimm et al. (2016), Gnedin (2016), Hassan et al. (2016), Xu et al. (2016), and Yoshura et al. (2016) have used numerical cosmological simulations and theoretical tools to analyze the contribution of faint galaxies to the reionization process. From these studies it appears that the contribution to the reionization by star-forming galaxies does not strongly depend on redshift. For this reason, their estimates can be compared to the lower average redshift of our sample. The predicted escape fractions are in general constant or increasing for progressively fainter galaxies, with values reaching up to % but keeping as low as few percent for the brighter fraction ().
In summary, all the recent theoretical models, with the exception of Sharma et al. (2016a) and Sharma et al. (2016b), tend to agree on relatively small values, of the order of few percent, for the escape fraction at and at luminosities close to . They are thus in agreement with the observational results summarized in Fig. 5.
6.2 Comparison with recent works on LyC escape fraction of star-forming galaxies
In this sub-section we compare our results, summarized in Fig. 5 and Table 2, with recent measurements of the escape fraction of star-forming galaxies at high-z. We have divided the literature papers in two main groups, the first containing results based on the indirect signatures of possible LyC emission, while the second one summarizes the evidences of direct LyC detections.
6.2.1 Indirect LyC measurements with other proxies
The long search for LyC emitters during the last 15 years has stimulated the investigation of indirect proxies to pinpoint robust samples of H I ionizers both in the local Universe and at high redshift. An efficient method, based on high [OIII]/[OII] line ratio or other high excitation lines, has been proposed by a number of works (Nakajima & Ouchi (2014); Stark et al. (2015); Schaerer et al. (2016), just to provide an example) and has been supported by the results of Izotov et al. (2016a, b), and Vanzella et al. (2016).
Usually, the high ionization efficiency of LyC emitter candidates is also associated with compact morphology and possibly strong outflows. Recently, Nakajima et al. (2016), Trainor et al. (2016), and Faisst (2016) have proposed to search for LyC emitters in galaxies with high ionizing ratio, possibly due to the low metallicity or to the harder ionization spectrum (e.g. by a top-heavy initial mass function). Reddy et al. (2016) and Leethochawalit et al. (2016), instead, suggested to search for LyC emitters among the sources with low covering fraction of neutral hydrogen, where the ISM is porous and has holes (the ionization-bound nebula of Zackrisson et al. 2013).
While all these methods are promising, it is worth stressing that they are however far from being robust indicators of appreciable LyC emission. Just to recall two notable examples discussed above, the galaxies by Amorin et al. (2014) and by Vasei et al. (2016) showed high [OIII]/[OII] line ratio coupled with upper limits on LyC escape fraction at level, obtained through direct measurements. Moreover, Rutkowski et al. (2016) find that strong H- emitters at , which are thought to be close analogs of high redshift sources of reionization, show an escape fraction (at ), again through direct LyC measurements. This suggests the need for more accurate calibrations of the indirect methods with direct LyC measurements.
6.2.2 Direct LyC measurements
Micheva et al. (2017) presented a sample of 18 LAEs and 7 LBGs detected in LyC out of a sample of 159 LAEs and 136 LBGs in the SSA22 field. The relative escape fraction for the LyC detected LAEs is , while for the LyC detected LBGs it is . However, a great fraction of the LyC candidates shows spatial offsets between the rest-frame non-ionizing detection and the LyC-emitting substructure or between the Lyman- emission and the H I ionizing radiation casting doubts on the fraction of contamination by lower redshift interlopers.
Smith et al. (2016) have used the Early Release Science (ERS) data of the UV sensitive WFC3 instrument onboard HST to measure the LyC escape fraction for a sample of 50 massive SFGs at . They reported a detection of at and a marginal LyC signal at . These data do not show any significant correlation of with the galaxy luminosity.
A different approach has been recently adopted by Shapley et al. (2016). They started from deep Keck/LRIS UV spectroscopy for a large sample of LBGs at , as described by Reddy et al. (2016). Roughly 10% of their galaxies show detections of LyC radiation (Steidel et al. in prep.). In particular, Shapley et al. (2016) studied the case of an intriguing spectroscopic LyC detection at corroborated by HST data, which allows them to exclude contamination by foreground objects. This galaxy has , but also shows evidence of high column density of neutral hydrogen, since the Lyman- and Lyman- lines in absorption are saturated. Moreover, the age of this galaxy (1.3 Gyr) is not as young as expected for strong LyC emitters, which should have young stellar populations of several Myr to provide the required ionizing photon efficiency.
Recently, starting from the stack spectrum of 33 galaxies at from the VUDS survey, Marchi et al. (2017) have derived a detection of LyC radiation, measuring . They also identified a possible LyC emitting galaxy at with high EW in Lyman-. These results are in agreement with previous results (Vanzella et al. 2010, Boutsia et al. 2011, Grazian et al. 2016, Guaita et al. 2016, Japelj et al. 2017) and with our findings that the contribution of the whole galaxy population to the ionizing background is probably modest, extending the study at .
In summary, the few detections of LyC emission from SFGs at indicate that they are rare events or that the distribution of escape fraction is bimodal. Only a limited sub-sample (few percent) of the distant galaxies presents significant () escape fraction, while the general galaxy population usually does not show large of ionizing photons (but see Steidel et al. in prep.). Our result, where no individual robust detection has been found out of a sample of 69 SFGs at , is in agreement with the recent achievements outlined above by Smith et al. (2016), Vanzella et al. (2016), Shapley et al. (2016), Guaita et al. (2016), Micheva et al. (2017), Japelj et al. (2017), Marchi et al. (2017). It is thus possible that the escape of ionizing radiation is a peculiar phenomenon, associated with particular phases of the galaxy lifetime or to the action of supernovae/AGN feedback on their ISM.
7 Summary and Conclusions
We have used ultra-deep observations ( hours) of the CANDELS/GOODS-North field with the LBC instrument in the U and R bands with the aim of determining the LyC escape fraction for a sample of faint () star-forming galaxies at . To this aim, we complemented the CANDELS/GOODS-North sample with additional galaxies from the EGS and COSMOS fields, reaching a total of 69 star-forming galaxies of in the redshift interval . This paper is thus an extension of the work by Grazian et al. (2016), both on the statistics (almost doubling the sample) and on the luminosity range analyzed.
Several ingredients are needed in order to reliably compute the LyC escape fraction: 1) very deep images at 900 and 1500 Å rest-frame, in this case the U and the R bands at ; 2) images with high spatial resolution, possibly from HST in different filters, in order to clean the sample from lower redshift contaminants; 3) high quality spectroscopic redshifts in a particularly narrow redshift range, in this case , allowing the U filter of LBC to sample only LyC photons close to 900 Å rest-frame; 4) high number statistics, in order to reduce the stochasticity of the IGM absorption; 5) deep X-ray data, in order to exclude the AGNs from our sample.
We have chosen the CANDELS/GOODS-North, EGS, and COSMOS datasets since in all the three fields we have these ingredients, i.e. deep LBC data in the U and in the R bands in wide areas, HST coverage from CANDELS, AEGIS, and COSMOS, X-ray images from Chandra, spectroscopic redshifts from the CANDELS, AEGIS, and VUDS-COSMOS databases. In particular, the critical ingredient of this work is the ultra-deep U-band image of LBC in the CANDELS/GOODS-North field, covering an area of sq. deg. to a limit of 30.2 AB mag (at 1 ). This image allows us to put stringent limits to the LyC escape fraction of faint star-forming galaxies at .
We have cleaned the sample from the contamination of AGNs and lower redshift interlopers, thanks to the Chandra and HST data. We have used an efficient technique to compute the escape fraction from deep LBC data, based on the PSF-matched photometry, as carried out in Grazian et al. (2016). This reduces the uncertainties on the photometry and thus on the leakage of ionizing photons.
In order to explore the very faint regime, we added to our sample a lensed galaxy studied by van der Wel et al. (2013) and Amorin et al. (2014). It is a star forming galaxy in the COSMOS field at z=3.4 lensed by an elliptical at . The upper limit in the U band by LBC allows us to place an upper limit to the escape fraction of 23% for an object with luminosity of . We added also other two lensed galaxies from the literature (Christensen et al. 2012, Bayliss et al. 2014). For the last two galaxies we do not have deep LBC images in the U band, and the upper limit to the LyC escape fraction comes from the estimate of the column density of neutral hydrogen from deep spectra in the Lyman- region. The lensed galaxies by Christensen et al. (2012); Amorin et al. (2014) and Bayliss et al. (2014) are particularly important since they are intrinsically faint (and low mass) objects with high [OIII]/[OII] line ratios. They thus represent the interesting sub-class of galaxies with high ionization efficiency, which are supposed to emit copious amount of ionizing photons.
We derive an upper limit to the LyC for each individual galaxy of the sample. We also stack the U and R bands of our sample to derive a limit for the whole population of SFGs at . The main results are the following:
-
•
Out of 69 galaxies, we detect LyC emission only in 3 (two discussed in Grazian et al. (2016) and the third one in the EGS field, ID=11372). The source ID=16479 in the CANDELS/GOODS-North field has been discarded since it is possibly affected by contamination.
-
•
Stacking the U- and the R-band images of the whole sample, we derive an upper limit of at S/N=1, more stringent than previous results (e.g. Chen et al. 2007, Vanzella et al. 2010, Boutsia et al. 2011, Grazian et al. 2016, Guaita et al. 2016, Japelj et al. 2017, Marchi et al. 2017).
-
•
Dividing the total sample in different luminosity intervals, we derive limits of , 2.0%, 2.4%, and 10.3% at , , , and , respectively. The apparent increase of the escape fraction toward faint luminosities is due to an observational limit in the depth of the U band.
-
•
We have explored different dependencies of the relative escape fraction on the galaxy luminosity, and provided different parameterizations to reproduce the observed trends of .
-
•
We have combined the derived parametric forms of with different realizations of the galaxy luminosity function at taken from the literature, and we have evaluated the emissivity at 900 Å rest-frame, .
-
•
Translating this quantity into a neutral hydrogen photo-ionization rate , we can conclude that galaxies brighter than have difficulties at providing the UVB measured in the Lyman forest at , especially if their LyC escape fraction is below 10%.
-
•
Fainter galaxies, with , can produce the observed UVB if their LyC escape fraction is above 10% at low luminosities. If a fainter limit of is adopted, then the constraints on can be relaxed.
-
•
For two lensed galaxies with extreme line ratio of [OIII]/[OII], there are stringent upper limits of and 23% at and , respectively (Bayliss et al. 2014, Amorin et al. 2014). Any causal connection between the high ionization efficiency and the large escape fraction of LyC radiation still awaits confirmations by a larger sample.
Placing these results in a cosmological context, it is interesting to note that if such low values of escape fraction will be found also at and for faint luminosities, then star-forming galaxies would be insufficient to cause the H I reionization process.
Future work will include the derivation of a robust estimate of the faint end of the luminosity function at in large areas thanks to the deep U-band images in the COSMOS (Boutsia et al. 2014), EGS, and ultra-deep CANDELS/GOODS-North data (Grazian et al. in prep. ). The combination of wide and deep data by LBC, together with large spectroscopic databases available in these fields, will allow us to measure the slope with unprecedented precision. This is a crucial item (as well as the measurements of the escape fraction) in the derivation of precise contribution of faint galaxies to the UVB at z=3. The CANDELS/GOODS-North sample can be used in the future also to confirm the spectroscopic redshifts for other star-forming galaxies at in the faint regime () with deep optical spectroscopy. At present, in fact, we are using in this work only 8 galaxies with spectroscopic redshifts available out of 48 (16%) galaxies at and in this field. While this spectroscopic sub-sample is relatively small, it is nonetheless representative for the faint star-forming galaxy population at , indicating that our results are not biased by low number statistics even at these faint limits. The spectroscopic completeness of galaxies at can be enhanced in the future by adding 40 galaxies and improving the limit of down to .
In the future, it will be crucial to measure the escape fraction at faint magnitudes, for a large number of galaxies. At this aim, strong lensing magnification (either through galaxy-galaxy lensing or by massive clusters) will be a crucial instrument to explore luminosity regimes which are otherwise inaccessible with the present instrumentation. The rapid activities on this side (e.g. SLACS, SL2S surveys for galaxy-galaxy lensing; HST Frontier Fields for lensing by clusters) will give fresh data in the near future.
Acknowledgements.
We warmly thank the anonymous referee for her/his useful suggestions and constructive comments that help us to improve this paper. We acknowledge financial contribution from the agreement ASI-INAF I/009/10/0. The LBT is an international collaboration among institutions in the United States, Italy, and Germany. LBT Corporation partners are The University of Arizona on behalf of the Arizona university system; Istituto Nazionale di Astrofisica, Italy; LBT Beteiligungsgesellschaft, Germany, representing the Max-Planck Society, the Astrophysical Institute Potsdam, and Heidelberg University; The Ohio State University; and The Research Corporation, on behalf of The University of Notre Dame, University of Minnesota, and University of Virginia. Based on observations collected at the European Organisation for Astronomical Research in the Southern Hemisphere under ESO programme(s) 185.A-0791. Based on observations obtained with MegaPrime/MegaCam, a joint project of CFHT and CEA/IRFU, at the Canada-France-Hawaii Telescope (CFHT) which is operated by the National Research Council (NRC) of Canada, the Institut National des Science de l’Univers of the Centre National de la Recherche Scientifique (CNRS) of France, and the University of Hawaii. This work is based in part on data products produced at Terapix available at the Canadian Astronomy Data Centre as part of the Canada-France-Hawaii Telescope Legacy Survey, a collaborative project of NRC and CNRS.References
- Adelberger et al. (2004) Adelberger, K. L., Steidel, C. C., Shapley, A. E., et al. 2004, ApJ, 607, 226
- Alavi et al. (2016) Alavi, A., Siana, B., Richard, J., et al. 2016, ApJ, 832, 56
- Alexander et al. (2003) Alexander, D. M., Bauer, F. E., Brandt, W. N., et al. 2003, AJ, 126, 539
- Amorin et al. (2010) Amorín, R., Perez-Montero, E., Vilchez, J. M., 2010, ApJ, 715, 128
- Amorin et al. (2012a) Amorín, R., Perez-Montero, E., Vilchez, J. M., Papaderos, P., 2012a, ApJ, 749, 185
- Amorin et al. (2012b) Amorín, R., Vilchez, J. M., Hagele, G. F., Firpo, V., Perez-Montero, E., Papaderos, P., 2012b, ApJ, 754, 22
- Amorin et al. (2014) Amorín, R., Grazian, A., Castellano, M., et al. 2014, ApJL, 788, 4
- Amorin et al. (2017) Amorín, R., Fontana, A., Perez-Montero, E., et al. 2017, Nat. Astron. 1, 0052; arXiv:1701.04416
- Anderson et al. (2016) Anderson, L., Governato, F., Karcher, M., Quinn, T., Wadsley, J., 2016, MNRAS, subm., arXiv:1606.05352
- Ashcraft et al. (2016) Ashcraft, T. A., Windhorst, R. A., Jansen, R. A., et al. 2016, in prep.
- Barger et al. (2008) Barger, A. J., Cowie, L. L., Wang, W.-H., 2008, ApJ, 689, 687
- Bayliss et al. (2014) Bayliss, M. B., Rigby, J. R., Sharon, K., et al. 2014, ApJ, 790, 144
- Becker & Bolton (2013) Becker, G. D. & Bolton, J. S. 2013, MNRAS, 436, 1023
- Becker et al. (2015) Becker, G. D., Bolton, J. S., Madau, P., et al. 2015, MNRAS, 447, 3402
- Bergvall et al. (2016) Bergvall, N., Marquart, T., Way, M. J., et al. 2016, A&A, 587A, 72
- Bertin & Arnouts (1996) Bertin, E. & Arnouts, S. 1996, A&AS, 117, 393
- Borthakur et al. (2014) Borthakur, S., Heckman, T. M., Leitherer, C., Overzier, R. A., 2014, Science, 346, 216
- Boutsia et al. (2011) Boutsia, K., Grazian, A., Giallongo, E., et al., 2011, ApJ, 736, 41
- Boutsia et al. (2014) Boutsia, K., Grazian, A., Giallongo, E., et al., 2014, A&A, 563A, 142
- Bouwens et al. (2015) Bouwens, R. J., Illingworth, G. D., Oesch, P. A., et al., 2015, ApJ, 811, 140
- (21) Bouwens, R. J., Smit, R., Labbé, I., et al. 2016a, ApJ, 831, 176
- (22) Bouwens, R. J., Oesch, P. A., Illingworth, G. D., et al. 2016b, ApJ submitted, arXiv:1610.00283
- Bridge et al. (2010) Bridge, C. R., Teplitz, H. I., Siana, B., et al. 2010, ApJ, 720, 465
- Cardamone et al. (2009) Cardamone, C., Schawinski, K., Sarzi, M., et al. 2009, MNRAS, 399, 1191
- Cassata et al. (2011) Cassata, P., Le Fèvre, O., Garilli, B., et al. 2011, A&A, 525A, 143
- Castellano et al. (2016) Castellano, M., Dayal, P., Pentericci, L., et al. 2016, ApJL, 818, 3
- Chardin et al. (2017) Chardin, J., Puchwein, E., Haehnelt, M. G. 2017, MNRAS, 465, 3429
- Chen et al. (2007) Chen, H.-W., Prochaska, J. X., Gnedin, N. Y., 2007, ApJL, 667, 125
- Christensen et al. (2012) Christensen, L., Laursen, P., Richard, J., et al. 2012, MNRAS, 427, 1973
- Civano et al. (2016) Civano, F., Marchesi, S., Comastri, A., et al. 2016, ApJ, 819, 62
- Cooper et al. (2011) Cooper, M. C., Aird, J. A., Coil, A. L., et al. 2011, ApJS, 193, 14
- Cowie et al. (2009) Cowie, L. L., Barger, A. J., Trouille, L., 2009, ApJ, 692, 1476
- Cristiani et al. (2016) Cristiani, S., Serrano, L. M., Fontanot, F., Vanzella, E., & Monaco, P. 2016, MNRAS, 462, 2478
- Cucciati et al. (2012) Cucciati, O., Tresse, L., Ilbert, O., et al. 2012, A&A, 539, A31
- Davis et al. (2007) Davis, M., Guhathakurta, P., Konidaris, N. P., et al. 2007, ApJ, 660L, 1
- de Barros et al. (2016) de Barros, S., Vanzella, E., Amorín, R., et al. 2016, A&A, 585A, 51
- De Santis et al. (2007) De Santis, C., Grazian, A., Fontana, A., Santini, P. 2007, New Astronomy, 12, 271
- Dijkstra et al. (2016) Dijkstra, M., Gronke, M., Venkatesan, A., 2016, ApJ, 828, 71
- Dunlop et al. (2013) Dunlop, J. S., Rogers, A. B., McLure, R. J., et al. 2013, MNRAS, 432, 3520
- Ellis (2014) Ellis, R. S., 2014, arXiv:1411.3330; Proceedings of the 26th Solvay Conference on Physics: “Astrophysics and Cosmology”, R. Blandford and A. Sevrin, eds., World Scientific
- Eldridge & Stanway (2009) Eldridge, J. J. & Stanway, E. R., 2009, MNRAS, 400, 1019
- Faisst (2016) Faisst, A. L., 2016, ApJ, 829, 99
- Fan et al. (2006) Fan, X., Strauss, M. A., Becker, R. H., et al. 2006, AJ, 132, 117
- Faucher-Giguère et al. (2009) Faucher-Giguère, C. A., Lidz, A., Zaldarriaga, M., & Hernquist, L. 2009, ApJ, 703, 1416
- Ferrara & Loeb (2013) Ferrara, A. & Loeb, A. 2013, MNRAS, 431, 2826
- Finkelstein et al. (2015) Finkelstein, S. L., Ryan, R. E. Jr., Papovich, C., et al. 2015, ApJ, 810, 71
- Fontana et al. (2010) Fontana, A., Vanzella, E., Pentericci, L., et al. 2010, ApJL, 725, 205
- Franx et al. (2003) Franx, M., Labbé, I., Rudnick, G., et al. 2003, ApJ, 587L, 79
- Giallongo et al. (2002) Giallongo, E., Cristiani, S., D’Odorico, S., & Fontana, A. 2002, ApJ, 568, L9
- Giallongo et al. (2015) Giallongo, E. Grazian, A., Fiore, F., et al. 2015, A&A, 578A, 83
- Giavalisco et al. (2004) Giavalisco, M., Ferguson, H. C., Koekemoer, A. M., et al. 2004, ApJL, 600, 93
- Glikman et al. (2011) Glikman, E., Djorgovski, S. G., Stern, D., et al. 2011, ApJL, 728, 26
- Gnedin et al. (2008) Gnedin, N. Y., Kravtsov, A. V., Chen, H.-W., 2008, ApJ, 672, 765
- Gnedin (2016) Gnedin, N. Y., 2016, ApJL, 825, 17
- Grazian et al. (2016) Grazian, A., Giallongo, E., Gerbasi, R., et al., 2016, A&A, 585A, 48
- (56) Grazian, A., et al., in prep.
- Grimes et al. (2009) Grimes, J. P., Heckman, T., Aloisi, A., et al., 2009, ApJS, 181, 272
- Grogin et al. (2011) Grogin, N. A., Kocevski, D. D., Faber, S. M., et al. 2011, ApJS, 197, 35
- Guaita et al. (2016) Guaita, L., Pentericci, L., Grazian, A., et al., 2016, A&A, 587A, 133
- Haardt & Madau (1996) Haardt, F. & Madau, P. 1996, ApJ, 461, 20
- Hassan et al. (2016) Hassan, S., Davé, R., Finlator, K., Santos, M. G., 2016, MNRAS, 457, 1550
- Heckman et al. (2011) Heckman, T. M., Borthakur, S., Overzier, R., et al. 2011, ApJ, 730, 5
- Henry et al. (2015) Henry, A., Scarlata, C., Martin, C. L., Erb, D., 2015, ApJ, 809, 19
- Hinshaw et al. (2013) Hinshaw, G., Larson, D., Komatsu, E., et. al., 2013, ApJS, 208, 19
- Inoue et al. (2014) Inoue, A. K., Shimizu, I., Iwata, I., Tanaka, M., 2014, MNRAS, 442, 1805
- Izotov et al. (2016a) Izotov, Y. I., Orlitová, I., Schaerer, D., et al. 2016a, Nature, 529, 178
- Izotov et al. (2016b) Izotov, Y. I., Schaerer, D., Thuan, T. X., et al. 2016b, MNRAS, 461, 3683
- Japelj et al. (2017) Japelj, J., Vanzella, E., Fontanot, F., et al. 2017, MNRAS subm., arXiv:1612.06401
- Khostovan et al. (2016) Khostovan, A. A., Sobral, D., Mobasher, B., et al. 2016, MNRAS, 463, 2363
- Kimm et al. (2016) Kimm, T., Katz, H., Haehnelt, M., et al. 2016, MNRAS, in press, arXiv:1608.04762
- Koekemoer et al. (2011) Koekemoer, A. M., Faber, S. M., Ferguson, H. C., et al. 2011, ApJS, 197, 36
- Konno et al. (2014) Konno, A., Ouchi, M., Ono, Y., et al., 2014, ApJ, 797, 16
- Leethochawalit et al. (2016) Leethochawalit, N., Jones, T. A., Ellis, R. S., et al. 2016, ApJ, 831, 152
- Le Fèvre et al. (2015) Le Fèvre, O., Tasca, L. A. M., Cassata, P., and the VUDS Team, 2015, A&A, 576A, 79
- Leitet et al. (2013) Leitet, E., Bergvall, N., Hayes, M., Linné, S., Zackrisson, E. 2013, A&A, 553A, 106
- Leitherer et al. (2016) Leitherer, C., Hernandez, S., Lee, J. C., Oey, M. S. 2016, ApJ, 823, 64
- Livermore et al. (2017) Livermore, R. C., Finkelstein, S. L., Lotz, J. M. 2017, ApJ, 835, 113
- Ma et al. (2015) Ma, X., Kasen, D., Hopkins, P. H., et al., 2015, MNRAS, 453, 960
- Madau & Haardt (2015) Madau, P. & Haardt, F. 2015 ApJL, 813, 8
- Marchi et al. (2017) Marchi, F., Pentericci, L., Guaita, L., et al. 2017, A&A, in press, arXiv:1611.05882
- Matthee et al. (2015) Matthee, J., Sobral, D., Santos, S., et al. 2015, MNRAS, 451, 400
- Micheva et al. (2017) Micheva, G., Iwata, I., Inoue, A. K. et al., 2017, MNRAS, 465, 316
- Mostardi et al. (2013) Mostardi, R. E., Shapley, A. E., Nestor, D. B., et al., 2013, ApJ, 779, 65
- Naidu et al. (2016) Naidu, R. P., Oesch, P. A., Reddy, N., et al. 2016, arXiv:1611.07038
- Nakajima & Ouchi (2014) Nakajima, K., Ouchi, M., 2014, MNRAS, 442, 900
- Nakajima et al. (2016) Nakajima, K., Ellis, R. S., Iwata, I., et al. 2016, ApJL, 831, 9
- Nandra et al. (2015) Nandra, K., Laird, E. S., Aird, J. A., et al. 2015, ApJS, 220, 10
- Nestor et al. (2011) Nestor, D. B., Shapley, A. E., Steidel, C. C., & Siana, B. 2011, ApJ, 736, 18
- Oesch et al. (2015) Oesch, P. A., van Dokkum, P. G., Illingworth, G. D., et al. 2015, ApJ, 804L, 30
- Ono et al. (2012) Ono, Y., Ouchi, M., Mobasher, B., et al. 2012, ApJ, 744, 83
- Onodera et al. (2016) Onodera, M., Carollo, C. M., Lilly, S., et al. 2016, ApJ, 822, 42
- Parsa et al. (2016) Parsa, S., Dunlop, J. S., McLure, R. J., Mortlock, A., 2016, MNRAS, 456, 3194
- Pentericci et al. (2011) Pentericci, L., Fontana, A., Vanzella, E., et al. 2011, ApJ, 743, 132
- Pentericci et al. (2014) Pentericci, L., Vanzella, E., Fontana, A., et al. 2014, ApJ, 793, 113
- Pirzkal et al. (2013) Pirzkal, N., Rothberg, B., Ly, C., et al. 2013, ApJ, 772, 48
- Planck Collaboration (2016) Planck Collaboration, Adam, R., Aghanim, N., Ashdown, M., et al. 2016, A&A, 596A, 108
- Postman et al. (2012) Postman, M., Coe, D., Benitez, N. et al. 2012, ApJS, 199, 25
- Prochaska et al. (2009) Prochaska, J. X., Worseck, G., & O’Meara, J. M. 2009, ApJL, 705, 113
- Razoumov & Sommer-Larsen (2010) Razoumov, A. O., & Sommer-Larsen, J. 2010, ApJ, 710, 1239
- Reddy et al. (2006) Reddy, N. A., Steidel, C. C., Erb, D. K., et al. 2006, ApJ, 653, 1004
- Reddy & Steidel (2009) Reddy, N. A. & Steidel, C. C. 2009, ApJ, 692, 778
- Reddy et al. (2016) Reddy, N. A., Steidel, C. C., Pettini, M., et al. 2016, ApJ, 828, 108
- Rigopoulou et al. (2006) Rigopoulou, D., Huang, J.-S., Papovich, C., et al. 2006, ApJ, 648, 81
- Robertson et al. (2013) Robertson, B. E., Furlanetto, S. R., Schneider, E., et al. 2013, ApJ, 768, 71
- Rutkowski et al. (2016) Rutkowski, M. J., Scarlata, C., Haardt, F., et al. 2016, ApJ, 819, 81
- Santos et al. (2016) Santos, S., Sobral, D., Matthee, J., 2016, MNRAS, 463, 1678
- Sawiki & Thompson (2006) Sawiki, M. & Thompson, D. 2006, ApJ, 642, 653
- Schaerer et al. (2016) Schaerer, D., Izotov, Y. I., Verhamme, A., et al. 2016, A&A, 591L, 8
- Schenker et al. (2014) Schenker, M. A., Ellis, R. S., Konidaris, N. P., Stark, D. P., 2014, ApJ, 795, 20
- Schmidt et al. (2016) Schmidt, K. B., Treu, T., Bradac, M., et al. 2016, ApJ, 818, 38
- Scoville et al. (2007) Scoville, N., Aussel, H., Brusa, M., et al. 2007, ApJS, 172, 1
- Siana et al. (2007) Siana, B., Teplitz, H. I., Colbert, J., et al., 2007, ApJ, 668, 62
- Siana et al. (2010) Siana, B., Teplitz, H. I., Ferguson, H. C., et al. 2010, ApJ, 723, 241
- Shapley et al. (2006) Shapley, A. E., Steidel, C. C., Pettini, M., Adelberger, K. L., & Erb, D. K. 2006, ApJ, 651, 688
- Shapley et al. (2016) Shapley, A. E., Steidel, C. C., Strom, A. L., et al. 2016, ApJL, 826, 24
- Sharma et al. (2016a) Sharma, M., Theuns, T., Frenk, C., et al. 2016a, MNRAS, 458, L94
- Sharma et al. (2016b) Sharma, M., Theuns, T., Frenk, C., et al. 2016b, arXiv:1606.08688v1
- Smith et al. (2016) Smith, B., Windhorst, R.A., Jansen, R.A., et al. 2016, ApJ submitted, arXiv:1602.01555
- Stanway et al. (2016) Stanway, E. R., Eldridge, J. J., Becker, G. D., et al. 2016, MNRAS, 456, 485
- Stark et al. (2015) Stark, D. P., Walth, G., Charlot, S., Clement, B., Feltre, A., et al. 2015, MNRAS, 454, 1393
- Stark et al. (2017) Stark, D. P., Ellis, R. S., Charlot, S., et al. 2017, MNRAS, 464, 469
- Stasinska et al. (2015) Stasinska, G., Izotov, Yu., Morisset, C., Guseva, N. 2015, A&A, 576A, 83
- Stefanon et al. (2017) Stefanon, M., Yan, H., Mobasher, B., et al. 2017, ApJS in press
- Steidel et al. (2001) Steidel, C. C., Pettini, M., Adelberger, K. L., 2001, ApJ, 546, 665
- Steidel et al. (2003) Steidel, C. C., Adelberger, K. L., Shapley, A. E., et al. 2003, ApJ, 592, 728
- Steidel et al. (2016) Steidel, C. C., Strom, A. L., Pettini, M., et al. 2016, ApJ, 826, 159
- Stevans et al. (2014) Stevans, M. L., Shull, J. M., Danforth, C. W., Tilton, E. M., 2014, ApJ, 794, 75
- Trainor et al. (2016) Trainor, R. F., Strom, A. L., Steidel, C. C., Rudie, G. C., 2016, ApJ, 832, 171
- Treu et al. (2012) Treu, T., Trenti, M., Stiavelli, M., et al. 2012, ApJ, 747, 27
- van der Wel et al. (2013) van der Wel, A., van de Ven, G., Maseda, M., et al. 2013, ApJL, 777, 17
- Vanzella et al. (2010) Vanzella, E., Giavalisco, M., Inoue, A. K., et al. 2010b, ApJ, 725, 1011
- Vanzella et al. (2012a) Vanzella, E., Guo, Y., Giavalisco, M., et al. 2012a, ApJ, 751, 70
- (133) Vanzella, E., Nonino, M., Cristiani, S., et al. 2012b, MNRAS, 424L, 54
- Vanzella et al. (2014) Vanzella, E., Fontana, A., Zitrin, A., et al. 2014, ApJL, 783, 12
- Vanzella et al. (2016) Vanzella, E., de Barros, S., Vasei, K., et al. 2016, ApJ, 825, 41
- Vasei et al. (2016) Vasei, K., Siana, B., Shapley, A. E., et al. 2016, ApJ, 831, 38
- Verhamme et al. (2017) Verhamme, A., Orlitova, I., Schaerer, D., et al. 2017, A&A, 597A, 13
- Wirth et al. (2015) Wirth, G. D., Trump, J. R., Barro, G., et al. 2015, AJ, 150, 153
- Worseck et al. (2014) Worseck, G., Prochaska, J. X., O’Meara, J. M., Becker, G. D., et al., 2014a, MNRAS, 445, 1745
- Xu et al. (2016) Xu, H., Wise, J. H., Norman, M. L., Ahn, K., O’Shea, B. W., 2016, ApJ, 833, 84
- Yajima et al. (2011) Yajima, H., Choi, J.-H., & Nagamine, K. 2011, MNRAS, 412, 411
- Yoshiura et al. (2016) Yoshiura, S., Hasegawa, K., Ichiki, K., et al. 2016, MNRAS submitted, arXiv:1602.04407
- Zahn et al. (2012) Zahn, O., Reichardt, C. L., Shaw, L., et al. 2012, ApJ, 756, 65