Connecting Clump Sizes in Turbulent Disk Galaxies to Instability Theory
Abstract
In this letter we study the mean sizes of H clumps in turbulent disk galaxies relative to kinematics, gas fractions, and Toomre . We use pc resolution HST images, IFU kinematics, and gas fractions of a sample of rare, nearby turbulent disks with properties closely matched to main-sequence galaxies (the DYNAMO sample). We find linear correlations of normalized mean clump sizes with both the gas fraction and the velocity dispersion-to-rotation velocity ratio of the host galaxy. We show that these correlations are consistent with predictions derived from a model of instabilities in a self-gravitating disk (the so-called “violent disk instability model”). We also observe, using a two-fluid model for , a correlation between the size of clumps and self-gravity driven unstable regions. These results are most consistent with the hypothesis that massive star forming clumps in turbulent disks are the result of instabilities in self-gravitating gas-rich disks, and therefore provide a direct connection between resolved clump sizes and this in situ mechanism.
1 Introduction
Galaxies in the distant past () were dominated by massive star-forming “clumps”, where star formation rates in clumps are 500 times higher than star-forming regions in the Milky Way (Elmegreen & Elmegreen, 2005; Genzel et al., 2011; Swinbank et al., 2012; Wisnioski et al., 2012; Guo et al., 2012). The “clumpiness” of galaxies is linked to star formation rate density of the Universe (Shibuya et al., 2016). However, due to current limits on resolution and sensitivity links between observed clump properties and theories of clump formation remain qualitative in nature.
Some authors propose that the large star forming regions in clumpy, turbulent galaxies are the result of instabilities which originate via self-gravity (Dekel et al., 2009; Genzel et al., 2011) similar to spiral galaxies in the local Universe(Kennicutt, 1989; Elmegreen, 1991; Wada et al., 2002). However, drastic differences between nearby spirals and turbulent disks (Förster Schreiber et al., 2009; Wisnioski et al., 2015) could possibly point to different mechanisms driving star formation. Alternatively, instabilities leading to clumps could be driven by interactions with other galaxies in which gas rich interactions maintain a disk(Robertson et al., 2006).
The most popular theory for clump formation is self-gravitating disk instability model. In this model, above a certain size rotation stabilizes against gravity driven fragmentation. The critical size is therefore the largest size structure that will form in an unstable disk. For circular orbits this rotation size scale (Toomre, 1964; Binney & Tremaine, 1987) can be expressed as
| (1) |
where is the angular rotation velocity of the disk, is the surface density of gas, and G is the gravitational constant. If self-gravity driven instabilities form clumps, then the size of the clumps must obey the relationship in Equation 1.
| Galaxy | z | SFR | Mstar | Type | R1/2(disk)aa is measured as twice for H light. | <R | fgasccGalaxy A04-3 does not have a CO(1-0) measurement, for this target we assume that MSFR, where SFR is calculated from the extinction corrected H luminosity using Hao et al. (2011) calibration. | |
|---|---|---|---|---|---|---|---|---|
| yr-1 | log() | kpc | kpc | |||||
| G04-1 | 0.12981 | 21.32 | 10.81 | disk | 2.75 | 0.46 0.26 | 0.19 0.09 | 0.33 0.04 |
| G20-2 | 0.14113 | 18.24 | 10.33 | disk | 2.1 | 0.66 0.29 | 0.49 0.07 | 0.21 0.05 |
| D13-5 | 0.0753 | 17.48 | 10.73 | disk | 2.04 | 0.41 0.15 | 0.24 0.02 | 0.36 0.02 |
| G08-5 | 0.13217 | 10.04 | 10.24 | disk | 1.84 | 0.37 0.07 | 0.26 0.07 | 0.3 0.05 |
| D15-3 | 0.06712 | 8.29 | 10.73 | disk | 2.2 | 0.22 0.09 | 0.19 0.02 | 0.17 0.02 |
| G14-1 | 0.13233 | 6.90 | 10.35 | disk | 1.12 | 0.45 0.17 | 0.51 0.07 | 0.77 0.08 |
| C13-1 | 0.07876 | 5.06 | 10.55 | disk | 4.21 | 0.34 0.11 | 0.13 0.04 | 0.06 0.02 |
| A04-3 | 0.06907 | 2.42 | 10.63 | disk | 3.58 | 0.17 0.10 | 0.05 0.03 | .01 0.01 |
| H10-2 | 0.14907 | 15.49 | 9.98 | merger | 2.55 | 0.82 0.21 | 0.95 0.34 | 0.67 |
| G13-1 | 0.13876 | 12.71 | 10.05 | merger | 2.59 | 0.55 0.13 | 0.68 0.03 | 0.13 |
In this letter we use the DYNAMO sample (Green et al., 2010) (DYnamics of Newly-Assembled Massive Objects). DYNAMO disks are very similar to main-sequence disks at , yet DYNAMO galaxies are at . DYNAMO disk galaxies have high star formation rates, gas fractions (%) (Fisher et al., 2014) and H velocity dispersions (30-80 km s-1) (Green et al., 2010; Bassett et al., 2014), similar to those of turbulent disks. In recent work(Fisher et al., 2017) we have shown that 8 of the 10 DYNAMO-HST galaxies (the sample analyzed in this work) pass definitions of clumpy galaxies used in other surveys (e.g. Guo et al., 2015), and show that when viewed at similar resolution, DYNAMO disks have essentially identical morphologies as those of galaxies.
Throughout this paper, we assume a concordance cosmology with = 67 km Mpc-1, , and .
2 Methods
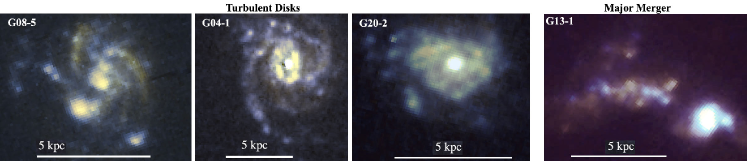
Our data set includes galaxies with H narrowband imaging from the Hubble Space Telescope with 0.05-0.2 kpc resolution. These DYNAMO-HST galaxies were imaged using the HST ramp filters FR716N and FR782N, which target the H emission line with a 2% bandwidth. In Fig. 1 we show examples of clumpy, dynamo disks from the DYNAMO-HST sample. This data set, measurement of clump properties, and disk/merger classification is described in detail in (Fisher et al., 2017). “Disk galaxies” in this work are those that show both signs of rotation and have exponentially decaying stellar surface brightness profiles.
Clump Sizes: Clumps were identified as 3 enhancements in an unsharp mask image created from the H maps. We did not place any size restriction on the sizes of clumps. Clumps that are co-located with the galaxy center (in the continuum) are removed from analysis. In the DYNAMO sample we identified 113 clumps for study in this work.
To estimate the sizes of star forming clumps, we fit Gaussian functions to the 2-D brightness distributions surrounding each peak in the H+[NII] map and set , where & are major and minor-axis. For our purposes, the characteristic clump size needs to reflect the full length of the collapsing region.We find a very strong correlation between and , where , and is much less affected by noise. We then define the size scale , which for perfect Gaussians would contain % of flux of each clump.
We define using HST H maps. Disk surface photometry is determined with elliptical isophote fits using the software described in Fisher & Drory (2008).
The median beam size of our maps is 0.088 arcsec, which is 100 pc at and 180 pc at . We subtract this beam size in quadrature from the clump sizes base on H+[NII] maps to yield the final clump size. Values for average are given in Table 1.
Kinematics: We determined kinematic properties, velocity dispersion (), and rotation velocity () of the 6 most distant () DYNAMO galaxies (D13-5, G04-1, G08-5, G14-1, G20-2 and H10-2) with Gemini GMOS observations (Bassett et al., 2014). The kinematics of the 4 nearer () DYNAMO galaxies (A04-3, C13-1, D15-3 and G13-1) were determined with AAT/WiFes observations (Green et al., 2014). The spatial resolution of the WiFes observations (1.4 arcsec) is lower than that of the GMOS. However, targets A04-3, C13-1 and D15-3 are roughly a factor of 2 closer () than most of the galaxies observed with GMOS (). The physical resolution for both kinematic data sets is kpc.
Emission line data cubes containing intensity, velocity dispersion and rotation velocity of each galaxy were then fit with kinematic models by method of least-squares using the GPU based software gbkfit (see Bekiaris et al., 2016). We model the rotation velocity, , with the function(Boissier et al., 2003)
| (2) |
Where and are free parameters were fit to the 2-D velocity profile. The software also fits velocity dispersion, assuming a flat velocity dispersion profile for the galaxy.
Gas Mass: We follow a similar procedure as in Fisher et al. (2014) to measure the gas fractions of DYNAMO galaxies. We observed the CO(1-0) line with Plateau de Bure interferometer in D configuration. Data were calibrated using standard methods at the IRAM facility, then binned into 20 km s-1 spectra.
The CO(1-0) flux was then converted to molecular gas mass () in the usual fashion, in which , where is the luminosity of CO(1-0), and is the CO-to-H2 conversion factor, including a 1.36 correction for heavier molecules. We adopted the standard value . For more discussion of this conversion factor in DYNAMO galaxies see Fisher et al. (2014) and White et al (in prep).
3 Results
3.1 Instabilities in a self-gravitating disk
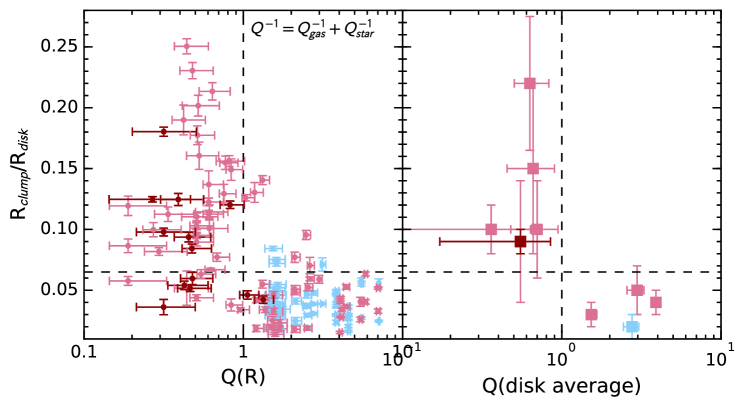
The parameter estimates the stability of a gravitating disk against collapse (Toomre, 1964; Safronov, 1960). For a gaseous disk , where is the epicyclic frequency and is the surface density of gas. A similar expression for stability exists for . Both components contribute to the gravitation field and thus both are important for stability of the disk; these are often combined in the so-called “two-fluid” model such that (Wang & Silk, 1994). Where , the disk is unstable.
Under the condition of , which is consistent with our data, it is straightforward to derive a direct, observable, relationship of increasing clump size with both gas fraction and from Equation 1. We use a derivation that balances the change in gravitational force of a collapsing element of gas with the centrifugal force induced by the differential rotation of the gas disk. We also make the assumption that the appropriate comparison is the “most unstable mode”, which is 1/2 the critical size (Binney & Tremaine, 1987). We find the following relationship,
| (3) |
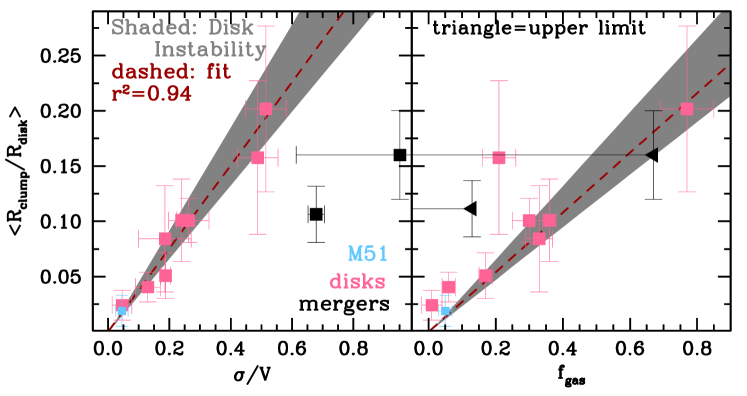
The constant relates , and for a typical disk varies from to (Binney & Tremaine, 1987). Substituting for returns a linear relationship between clump size and gas fraction (Glazebrook, 2013; Genzel et al., 2011). These capture the concept that in turbulent disks, the clumps are larger if the gas is more turbulent (higher ) and the disk is more gas rich (higher ). Similar correlations are discussed elsewhere in the literature (Escala & Larson, 2008; Dekel et al., 2009; Guo et al., 2012).
In Fig. 2 we show that for DYNAMO-HST disk galaxies, there is a very strong correlation between average and . The best fit relationships yields , consistent with the range to in Eq. 3. The correlation with is less strong. In the same figure we show the predictions based on the model of instabilities in a self-gravitating disk, Eq. 3. We find that correlations of clump sizes in DYNAMO disks with both and are consistent with predictions of the so-called “violent disk instability” model.
We also find that the (unnormalized) correlates well with . This is important because the relationship shown in Fig. 2 may be affected by a correlation between and . However, in our sample the correlation of with is roughly as robust, if not slightly stronger () than that of with ().
We note the assumptions for the geometry of the model, the method in which Eq. 3 is derived, and the measurement of clump sizes may all alter the proportionality constant in Eq. 3. For the most common assumption of a flat rotation curve () the simple fragmentation in a rotating disk and the derivation from the dispersion relation yield very similar results, and are both, within error bars, consistent with our data. It is, however, possible to construct different assumptions that may affect this. Nonetheless, the observation of strong, linear correlation between and is itself strongly consistent with Eq. 3independent of the proportionality constant.
To determine the azimuthally averaged we directly measure kinematics from the H emission line. The gas surface density was determined using the H surface density profile and assuming a constant ratio across the disk scaled to match our measurement of molecular gas mass. To ensure that individual is not merely a reflection of the clump brightness we compared H profiles in which clumps are masked to those without masked clumps, and found negligible differences. To calculate we used the HST continuum surface brightness profile with a single mass-to-light ratio determined from SDSS photometry. Bassett et al. (2014) measured stellar kinematics for 2 of our target galaxies. Based on results from these two targets we consider the following possibilities: (1) and , (2) km s-1, and (3) ). The differences between these three cases are reflected in the error bars in Fig. 3.
The self-gravity instability model of clump formation predicts that clumps will form in unstable regions of the disk. In the left panel of we show that in DYNAMO disks large clumps only exists in regions with , and conversely small clumps, %, only reside in stable regions. In Fig. 3 we highlight one galaxy, G04-1, to show that even within a single disk when becomes stable the clumps become small. Recall that the sub-galactic measurement is derived from azimuthally averaged profiles. This is intended to reflect the broad region of the disk containing the clump, and not merely the local vicinity of the clump. This is an important distinction as the formation of a clump in a region may lead to that region becoming non-linear in nature (Tamburello et al., 2015; Inoue et al., 2016).
In Fig. 3 we therefore also show galaxy averaged values for both and . The galaxies with low have larger clumps. The results we observe in Fig. 3 builds significantly on compelling early results(Genzel et al., 2011; Swinbank et al., 2012) by controlling for resolution effects(Fisher et al., 2017; Tamburello et al., 2016), measuring the full stability, and quantifiably showing the decrease in clump sizes toward stable regions. We find strong consistency of clump sizes with predictions of the model in which self-gravity is the origin of large clumps.
3.2 Mergers as drivers of clumps
Major Mergers: In our sample 2 galaxies G13-1 and H10-2 appear most consistent with a major-merger scenario. Simulations predict that at high gas fraction major mergers can generate disk like kinematic profiles (Robertson et al., 2006) and morpho-kinematic studies suggest that a significant fraction of star forming galaxies fit this picture (recently Rodrigues et al., 2017).
If the primary formation mechanism of massive clumps were the compression of gas in extremely gas rich major-mergers there is no clear reason for the relationships in Fig. 2 to hold. Furthermore, the effect of mergers on kinematics, even in gas rich mergers, is to drive up significantly. then increases, which is inconsistent with our result in Fig. 3. For the same average relative clump size DYNAMO merging galaxies (H10-2 and G13-1) are more dispersion dominated than the turbulent disks. Though the assumptions that are made for determining do not apply to merging galaxies, if one applies this formula to these two merging galaxies we find 6 and . This is consistent with the expectation that those clumpy galaxies that are independently identified as merging systems, not disks, are also those systems that deviate from the predictions of the self-gravitating disk instability model.
Minor Mergers: Assuming that the radial decay of a clump resulting from a minor merger heats the disk as it loses energy, in principle one can derive a similar linear relationship between and . However, we note that many assumptions required in this derivation are significantly uncertain. Though beyond the scope of this work, a comparison of simulation results would be helpful.
A clump with energy, , will loose energy as it radially decays. This energy is translated to an increase in disk velocity dispersion, . Using the average position of clumps in clumpy DYNAMO disks (2.7 kpc), the average size of disks in the same galaxies (5 kpc), and assuming , one derives . The assumption that neglects dark-matter and is thus questionable, however is necessary to derive . The quantity in gas mass or baryonic mass is not known. For DYNAMO H measurements we find . Note this assumes that the conversion of H flux to gas mass is the same for both the clump and the disk, which is also uncertain. This returns the relationship , which is much steeper than our result in Fig. 2. To match our observations would be necessary.
This derivation for minor-merger scenarios relies on multiple assumptions that may not apply to real galaxies. First, DYNAMO disks contain clumps per galaxy. Fisher et al. (2017) shows that the larger number of clumps compared to observations is likely a resolution effect. It seems unlikely that each clump represents a minor merger within the past 1 Gyr. Moreover, the local gravity and shear are very likely to alter the structure of a clump initiating from a minor merger. An alternate possibility is that clumps resulting from minor mergers reshape to match the stability conditions derived in Eq. 3. Ultimately a measurement of clump properties in Figs. 2 and 3 derived from minor mergers in simulations with realistic conditions would be useful.
To zeroth order, if all clumps result from minor-mergers there should be no dependence of on galactocentric radius. Conversely, in the disk-instability model should decrease with radius, until flattens, and therefore would decrease with galactic radius. In DYNAMO we find that clumps located in the central 20% of the disk have a median clump size of , where as the median of the rest of the disk is .
3.3 Non-axisymmetric instabilities
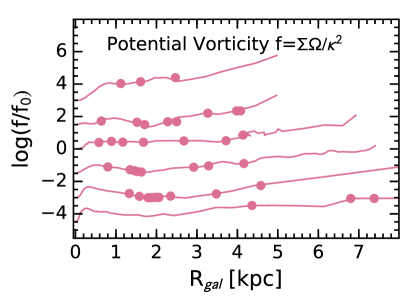
Yet another possible mechanism driving clump formation are non-axisymmetric instabilities(Lovelace & Hohlfeld, 2013). These instabilities do not require low , and thus it seems unlikely that we would observe such regularity in Fig. 2 in this case. The main criterion for non-axisymmetric instabilities is that the potential vorticity be a decreasing function of radius. For rotating disk galaxies potential vorticity, , is defined as
| (4) |
In Fig. 4 we plot profiles of for all DYNAMO galaxies that contain large clumps (%). If non-axisymmetric instabilities were driving clump formation, then we would expect clumps to be associated with decreasing f. Though some clumps are in decreasing sections of the profile, there is clearly no preferential relationship between clump locations and f, suggesting non-axisymmetric instabilities are not likely driving clump formation.
4 Discussion
In this letter we report the observation of positive, linear correlations between the average, normalized size of clumps () in turbulent disks with both the ratio of velocity dispersion-to-rotation speed () of the disk and the gas fraction () of the disk. These correlations in our data (Fig. 2) are consistent with predicted relationships that are derived from model in which clumps form via in situ instabilities in a self-gravitating disk (Eq. 3). We also find a correlation between the size of clumps and Toomre value such that large clumps are restricted to regions of the disk with (Fig. 3).
Minor-mergers could lead to a linear relationship between and ; however, at present it is not clear that the resulting correlation, nor assumptions necessary match real galaxies. Clump formation as a simple response to instabilities in self-gravitating disks is the most consistent model with our data.
DYNAMO disks are very similar to
main-sequence galaxies
Green et al. (2014); Fisher et al. (2014, 2017).
A common picture of
galaxy evolution, is that the tightness of the star forming main
sequence at a particular redshift intervals indicates that star
formation in these galaxies is driven by a slow extended mechanism
(e.g. Daddi et al., 2007; Dekel et al., 2009; Wuyts et al., 2011). Our results
therefore demonstrate a rigorous, quantifiable and direct connection between the
clumpy mode of star formation that dominates main-sequence
galaxies and a such a mechanism that occurs naturally in gas rich,
turbulent disks.
References
- Bassett et al. (2014) Bassett, R., Glazebrook, K., Fisher, D. B., et al. 2014, MNRAS, 442, 3206
- Bekiaris et al. (2016) Bekiaris, G., Glazebrook, K., Fluke, C. J., & Abraham, R. 2016, MNRAS, 455, 754
- Binney & Tremaine (1987) Binney, J., & Tremaine, S. 1987, Galactic Dynamics
- Boissier et al. (2003) Boissier, S., Prantzos, N., Boselli, A., & Gavazzi, G. 2003, MNRAS, 346, 1215
- Daddi et al. (2007) Daddi, E., Dickinson, M., Morrison, G., et al. 2007, ApJ, 670, 156
- Dekel et al. (2009) Dekel, A., Sari, R., & Ceverino, D. 2009, ApJ, 703, 785
- Elmegreen (1991) Elmegreen, B. G. 1991, ApJ, 378, 139
- Elmegreen & Elmegreen (2005) Elmegreen, B. G., & Elmegreen, D. M. 2005, ApJ, 627, 632
- Escala & Larson (2008) Escala, A., & Larson, R. B. 2008, ApJ, 685, L31
- Fisher & Drory (2008) Fisher, D. B., & Drory, N. 2008, 136, 773
- Fisher et al. (2014) Fisher, D. B., Glazebrook, K., Bolatto, A., et al. 2014, ApJ, 790, L30
- Fisher et al. (2017) Fisher, D. B., Glazebrook, K., Damjanov, I., et al. 2017, MNRAS, 464, 491
- Förster Schreiber et al. (2009) Förster Schreiber, N. M., Genzel, R., Bouché, N., et al. 2009, ApJ, 706, 1364
- Genzel et al. (2011) Genzel, R., Newman, S., Jones, T., et al. 2011, ApJ, 733, 101
- Glazebrook (2013) Glazebrook, K. 2013, ArXiv e-prints, arXiv:1305.2469 [astro-ph.CO]
- Green et al. (2010) Green, A. W., Glazebrook, K., McGregor, P. J., et al. 2010, Nature, 467, 684
- Green et al. (2014) —. 2014, MNRAS, 437, 1070
- Guo et al. (2012) Guo, Y., Giavalisco, M., Ferguson, H. C., Cassata, P., & Koekemoer, A. M. 2012, ApJ, 757, 120
- Guo et al. (2015) Guo, Y., Ferguson, H. C., Bell, E. F., et al. 2015, ApJ, 800, 39
- Hao et al. (2011) Hao, C.-N., Kennicutt, R. C., Johnson, B. D., et al. 2011, 741, 124
- Inoue et al. (2016) Inoue, S., Dekel, A., Mandelker, N., et al. 2016, MNRAS, 456, 2052
- Kennicutt (1989) Kennicutt, Jr., R. C. 1989, ApJ, 344, 685
- Lovelace & Hohlfeld (2013) Lovelace, R. V. E., & Hohlfeld, R. G. 2013, MNRAS, 429, 529
- Robertson et al. (2006) Robertson, B., Bullock, J. S., Cox, T. J., et al. 2006, ApJ, 645, 986
- Rodrigues et al. (2017) Rodrigues, M., Hammer, F., Flores, H., Puech, M., & Athanassoula, E. 2017, MNRAS, 465, 1157
- Safronov (1960) Safronov, V. S. 1960, Annales d’Astrophysique, 23, 979
- Shibuya et al. (2016) Shibuya, T., Ouchi, M., Kubo, M., & Harikane, Y. 2016, ApJ, 821, 72
- Swinbank et al. (2012) Swinbank, A. M., Smail, I., Sobral, D., et al. 2012, ApJ, 760, 130
- Tamburello et al. (2015) Tamburello, V., Mayer, L., Shen, S., & Wadsley, J. 2015, MNRAS, 453, 2490
- Tamburello et al. (2016) Tamburello, V., Rahmati, A., Mayer, L., et al. 2016, ArXiv e-prints, arXiv:1610.05304
- Toomre (1964) Toomre, A. 1964, ApJ, 139, 1217
- Wada et al. (2002) Wada, K., Meurer, G., & Norman, C. A. 2002, ApJ, 577, 197
- Wang & Silk (1994) Wang, B., & Silk, J. 1994, ApJ, 427, 759
- Wisnioski et al. (2012) Wisnioski, E., Glazebrook, K., Blake, C., et al. 2012, MNRAS, 422, 3339
- Wisnioski et al. (2015) Wisnioski, E., Förster Schreiber, N. M., Wuyts, S., et al. 2015, ApJ, 799, 209
- Wuyts et al. (2011) Wuyts, S., Förster Schreiber, N. M., van der Wel, A., et al. 2011, ApJ, 742, 96