Quantum Nuclear Pasta and Nuclear Symmetry Energy
Abstract
Complex and exotic nuclear geometries are expected to appear
naturally in dense nuclear matter found in the crust of neutron
stars and supernovae environment collectively referred to as
“nuclear pasta”. The pasta geometries depend on the average baryon
density, proton fraction and temperature and are critically
important in the determination of many transport properties of
matter in supernovae and the crust of neutron stars. Using a set of
self-consistent microscopic nuclear energy density functionals we
present the first results of large scale quantum simulations of
pasta phases at baryon densities
fm-3, proton fractions , and
zero temperature. The full quantum simulations, in particular, allow
us to thoroughly investigate the role and impact of the nuclear
symmetry energy on pasta configurations. We use the Sky3D
code that solves the Skyrme Hartree-Fock equations on a
three-dimensional Cartesian grid. For the nuclear interaction we use
the state of the art UNEDF1 parametrization, which was
introduced to study largely deformed nuclei, hence is suitable for
studies of the nuclear pasta. Density dependence of the nuclear
symmetry energy is simulated by tuning two purely isovector
observables that are insensitive to the current available
experimental data. We find that a minimum total number of nucleons
is necessary to prevent the results from containing
spurious shell effects and to minimize finite size effects. We find
that a variety of nuclear pasta geometries are present in the
neutron star crust and the result strongly depends on the nuclear
symmetry energy. The impact of the nuclear symmetry energy is less
pronounced as the proton fractions increase. Quantum nuclear pasta
calculations at MeV are shown to get easily trapped in
meta-stable states, and possible remedies to avoid meta-stable
solutions are discussed.
pacs:
07.05.Tp, 21.65.Ef, 26.50.+x, 26.60.-c, 26.60.Gj, 26.60.Kp, 97.60.JdI Introduction
The baryon matter in the Universe organizes itself based on the short range nuclear attraction and the long-range Coulomb repulsion. At densities much lower than the nuclear saturation density, fm-3, the nuclear and atomic length scales are well separated, so nucleons bind into nuclei that, in turn, are segregated in a Coulomb lattice. All terrestrial materials as well as the matter in the outer layers of the neutron star crust are expected to harbor such sites. However, the density of matter inside the neutron star crust—as well as in the regions of supernovæ–has a range that spans several orders of magnitude. In high-density regions, , which are expected in the core of neutron stars, the short range nuclear interaction significantly dominates over the atomic length scales and the matter assumes a uniform phase. At sub-saturation baryon densities, , a region expected at the bottom layers of the inner crust, these two length scales become comparable, and the matter develops complex and exotic structures as a result of the so-called Coulomb frustration. In this case, there is a strong competition between the Coulomb and the strong interaction, which leads to the emergence of various complex structures with similar energies that are collectively referred to as “nuclear pasta”. A significant progress has been made in simulating this exotic region Watanabe et al. (2003, 2005); Horowitz et al. (2004a, b, 2005); Schneider et al. (2013), since their initial prediction over several decades ago Ravenhall et al. (1983); Hashimoto et al. (1984); Lorenz et al. (1993). There are ongoing efforts aiming to determine the possible shapes of the nuclear pasta Horowitz et al. (2015), as it is believed that the elastic and transport properties—such as electrical and thermal conductivities, shear and bulk viscosities—of nuclear pasta play crucial role for thermal evolution, magnetic field evolution, rotation, and oscillations of neutron stars Lorenz et al. (1993); Levin and Ushomirsky (2001); Gusakov et al. (2004); Gearheart et al. (2011); Pons et al. (2013). Moreover, they can significantly impact neutrino opacities in the core-collapse supernovæ, which in turn strongly influences the dynamics of the core collapse and the cooling of proto-neutron stars Bethe (1990); Horowitz et al. (2004a); Alloy and Menezes (2011); Janka (2012). In this paper we will investigate large scale quantum simulations of nuclear pasta phases at baryon densities fm-3, proton fractions , and zero temperature by using a set of self-consistent microscopic nuclear energy density functionals, and discuss the role and impact of the nuclear symmetry energy.
The traditional approach to study nuclear pasta phases often involves symmetry arguments to determine what is the most favored structure at a given baryon density, , temperature, , and proton fraction, . The system is then minimized by either adding an external guiding potential or with some other sorts of biased initialization that explicitly makes assumptions about the geometrical shapes of the nuclear pasta. Some example model calculations include the use of the liquid-drop model Ravenhall et al. (1983); Pethick and Potekhin (1998); Nakazato et al. (2009), Thomas-Fermi and Wigner-Seitz cell approximations Lorenz et al. (1993); Williams and Koonin (1985); Lassaut et al. (1987); Oyamatsu (1993); Maruyama et al. (2005). Perhaps some of the most exotic phases obtained using pre-assumed shapes are the gyroid and diamond morphologies Nakazato et al. (2009); Schuetrumpf et al. (2015). There are other approaches that do not explicitly assume any shape for the nuclear pasta phase. These include calculations based on the Thomas-Fermi approximation Williams and Koonin (1985); Okamoto et al. (2012); Magierski and Heenen (2002); Grill et al. (2012), non-relativistic Skyrme Hartree-Fock methods Newton and Stone (2009); Schuetrumpf et al. (2013); Pais and Stone (2012); Sagert et al. (2016), relativistic density-functional theory Maruyama et al. (2005), relativistic mean field-approximation Gupta and Arumugam (2013); Avancini et al. (2008, 2009), quantum molecular dynamics (QMD) Maruyama et al. (1998); Watanabe et al. (2002, 2003, 2005); Watanabe and Sonoda (2005); Sonoda et al. (2008); Watanabe et al. (2009) and semi-classical molecular dynamics (MD) Horowitz et al. (2004a, b, 2005); Horowitz and Berry (2008); Piekarewicz and Toledo Sanchez (2012); Dorso et al. (2012); Caplan et al. (2015); Horowitz et al. (2015); Schneider et al. (2014); Berry et al. (2016); Schneider et al. (2016) simulations. Recently using MD simulations more exotic structures have also been identified, such as flat plates with a lattice of holes, termed as “nuclear waffles” Schneider et al. (2014), and flat plates that are connected by spiral ramps Berry et al. (2016).
For small systems, these studies are often performed in the unit cell filled with neutrons, protons and electrons alongside the specific symmetry assumptions and boundary conditions. The pasta matter is then described as a lattice made of a large number of these unit cells. When performing numerical studies, it is important to consider the non-trivial role of the simulation volume. Since only periodic geometries that fit into the unit cell can be explored, the simulation space must be sufficiently large to contain at least one unit cell of the pasta structure. Even if this condition is fulfilled, finite size effects such as dependence on the geometry of the simulation space Gimenez Molinelli et al. (2014) and numerical shell effects Newton and Stone (2009) may appear. As a result, the simulation volume needs to be maximized to ensure that finite size effects are minimal. Advances in computational power in the last decade have allowed for sophisticated fully self-consistent calculations by using Skyrme Hartree-Fock (SHF) calculations at finite temperature Newton and Stone (2009); Schuetrumpf et al. (2013); Pais and Stone (2012); Sagert et al. (2016). Whereas these computations showed a richer variety of pasta shapes than the original five geometries Hashimoto et al. (1984), consistent with results obtained by the MD simulations that use significantly larger simulation volumes, they are typically reproduced by assuming various symmetry arguments or an a priori assumed final pasta shapes. Moreover, due to the limitation of computational power, these calculations were often limited to a single periodic structure, therefore leading to the pasta shapes that may exhibit significant dependence on the finite size of the simulation box. Therefore, it is necessary to perform quantum simulations with a much larger number of nucleons to overcome finite size effects, as well as to minimize various numerical effects coming from different symmetry considerations. The progress in the high-performance computing in recent years allows us to take further steps in this direction, which is the main topic of this manuscript. Indeed, the recent decadal nuclear survey Council puts forward that “high performance computing provides answers to questions that neither experiment nor analytic theory can address; hence, it becomes a third leg supporting the field of nuclear physics.”
Calculations with more than a few thousand nucleons so far were only manageable by considerably simplifying the nuclear interaction. That is what was done in previous works that study nuclear pasta using classical or quantum MD simulations. The advantage of MD simulations lies in their ability to simulate large systems where the length of the simulation space is several hundred fermis, and therefore significantly exceeds the size of a unit cell. This allows to study pasta structures that are less bound to the geometry and boundary conditions of the simulation volume. However, although MD approaches can include quantum effects qualitatively, the nuclear interaction is typically given by a schematic two-body potential. For self-consistent quantum calculations that account for Pauli blocking, spin-orbit forces and nucleon pairing, simulations using microscopic energy density density functionals (EDF) in the form of SHF are usually performed. As mentioned above the current drawback of these methods is their high computational cost. As a consequence, the size of the system is typically chosen to be much smaller than the one for MD methods. By using nuclear configurations that conserve reflection symmetry in the three Cartesian directions, Ref. Newton and Stone (2009) were able to simulate effectively larger quantum systems by performing the computation only in one octant of the unit cell. In this study we will not restrict our simulation with nuclear configurations that assume any kind of spatial symmetries. In particular, we will perform quantum simulations of nuclear pasta using Skyrme Hartree-Fock model Maruhn et al. (2014) with no pre-assumed pasta geometries, and we will address the following main questions:
-
(a)
what is the minimum size of the simulation volume necessary to minimize finite size effects?
-
(b)
what is the role of nuclear symmetry energy in the nuclear pasta formation in neutron star crust and supernovae?
-
(c)
how does the initial configuration of the system impact on the converged pasta structure?
We have organized the paper as follows. In Sec. II we review the essential details required to simulate nuclear pasta. First, we modify the density dependence of the symmetry energy in the Skyrme force interaction UNEDF1 by adapting two purely isovector parameters. We present predictions for the ground state properties of several closed-shell finite nuclei using the original and the modified parametrizations. Then, we discuss the impact of the grid spacing, accuracy considerations, and optimum simulation runtime. Special attention is paid to the impact of finite size effects, in which we identify the minimum simulation volume that contains at least one period of the pasta structure. In Sec. III we discuss the outcomes of our results. First, we provide predictions for nuclear pasta with low proton fractions corresponding to the crust of neutron stars. Second, we explore a range of proton fractions corresponding to the matter found in supernovae. Last, we discuss the non-trivial effect of initial configurations on the final pasta configuration. Finally, we offer our conclusions in Sec. IV.
II Formalism
II.1 Nuclear Interaction and Symmetry Energy
To simulate the nuclear pasta structures we use the publicly
available Skyrme TDHF code Sky3D that solves the static
Skyrme Hartree-Fock equations in a three-dimensional Cartesian mesh
with a damped gradient iteration method on an equi-distant grid and
without symmetry restrictions Maruhn et al. (2014). For the nuclear
pasta simulations we use periodic boundary conditions that also
includes a homogeneous negative electron background to ensure the
charge neutrality of the system. This so-called jellium
approximation is suitable for the nuclear pasta studies as they are
expected to be present in charge neutral environments, such as in
the inner crust of neutron stars. A screened Coulomb interaction is
not considered, as its influence should be very small for the box
lengths considered in our study Alcain et al. (2014). For a full
description of the code and the Skyrme Hartree-Fock method we refer
the reader to Ref. Maruhn et al. (2014).
For the nuclear interaction we select a state-of-the-art Energy Density Functional (EDF) of Skyrme type. The total energy is given by
| (1) |
where is the kinetic energy, is the Skyrme contribution, and is the Coulomb contribution. The Skyrme energy function contains five contributions
| (2) |
which are in detail
| (3a) | |||||
| (3b) | |||||
| (3c) | |||||
| (3d) | |||||
| (3e) | |||||
for time-independent calculations, where is known as the zero-range term, as the effective mass term, as the finite-range term, as the density dependent term, and as the spin-orbit term. Here is the total particle density, is the total kinetic density and is the total spin-orbit density, and if a subscript is present it labels the densities of either neutrons or protons. The Coulomb energy consists of the standard expression for a charge distribution in its own field plus the exchange term in the Slater approximation:
| (4) |
where is the elementary charge. The parameters , and , are fitted to experimental data. We chose the UNEDF1 parametrization, whose parameters were fitted to a selected set of nuclear masses, charge radii, odd-even mass differences, and the experimental excitation energies of fission isomers in the actinides Kortelainen et al. (2012). Given that UNEDF1 was introduced to better study largely deformed nuclei, we find this Skyrme force very suitable for our studies of nuclear pasta that can take shapes of strongly elongated nuclei, in particular.
Although the current extensive experimental database is sufficient to constrain most of the parameters of the nuclear interaction, many nuclear forces widely disagree in their description of the isovector channel of the nuclear force due to poorly constrained isovector parameters. In the realm of nuclear matter this means that the density dependence of the nuclear symmetry energy remains poorly determined. Since nuclear pasta is expected to form in a neutron-rich environment, the role of the nuclear symmetry energy on the pasta formation and the pasta phase transition needs to be thoroughly analyzed. It has been shown by Oyamatsu and Iida that pasta formation may not be universal in the neutron star crust and that its existence is intimately related to the density dependence of the symmetry energy Oyamatsu and Iida (2007), where the pasta regime was predicted to appear when the density slope of the symmetry energy is MeV (see Ref. Horowitz et al. (2014) for definitions of symmetry energy parameters). Recently there have been several studies in the context of the Thomas-Fermi approximation that analyzed the impact of density slope of the nuclear symmetry energy on the pasta phase structure Grill et al. (2012); Bao and Shen (2014, 2015). In particular, it was found that whereas models with small value of exhibit a variety of pasta structures, most of these structures are faded away when one considers models with the large value of corresponding to the stiff nuclear symmetry energy.
Intensive efforts have been devoted to constrain the density dependence of the nuclear symmetry energy in recent years from using various approaches (please see Refs. Tsang et al. (2012); Lattimer (2012); Li and Han (2013) and references therein). These efforts have recently led to a close convergence of the value of symmetry energy at saturation being around MeV and its density slope of MeV. Nevertheless, the associated error-bars from different approaches vary broadly and the possibility that and parameters can be significantly different from these currently inferred values cannot be ruled out Li and Han (2013). For this reason, we have modified two purely isovector parameters of the UNEDF1 by following the tuning scheme as described in Ref. Fattoyev et al. (2012). In particular, we modify the Skyrme parameters and (Table 1), that in turn modify the parameters , , and of the EDF (Eqs. (3a) and (3d)) which are given by
| (5) |
in terms of the Skyrme parameters , , and . The tuning method allows one to generate a family of model interactions that are almost indistinguishable in their predictions for a large set of the nuclear ground state observables that are mostly isoscalar in nature, yet predict different isovector observables. As a contrast to the original UNEDF1 model that has a relatively soft symmetry energy with MeV, we generated a model that predicts a rather stiff symmetry energy of MeV.
| Model | |||||||||
|---|---|---|---|---|---|---|---|---|---|
| UNEDF1 | 0.0537569200 | 0.1624911700 | 0.1587 | -15.80 | 220.0 | -405.0 | 28.99 | 40.00 | 179.5 |
| UNEDF1⋆ | 0.3237259090 | 0.7725758299 | 0.1587 | -15.80 | 220.0 | -405.0 | 32.87 | 80.00 | 71.42 |
| Nucleus | Observable | Experiment | MeV | MeV |
|---|---|---|---|---|
| 16O | (MeV) | |||
| (fm) | ||||
| (fm) | — | |||
| 40Ca | (MeV) | |||
| (fm) | ||||
| (fm) | — | |||
| 48Ca | (MeV) | |||
| (fm) | ||||
| (fm) | — | |||
| 90Zr | (MeV) | |||
| (fm) | ||||
| (fm) | — | |||
| 132Sn | (MeV) | |||
| (fm) | — | |||
| (fm) | — | |||
| 208Pb | (MeV) | |||
| (fm) | ||||
| (fm) | — |
In Table 1 we present the nuclear matter bulk parameters
for these two interactions. And in Table 2 we show the
success of such tuning by presenting predictions for binding
energies and charge radii of several closed shell nuclei. We also
present the corresponding neutron skin thicknesses of
these nuclei. It is worth mentioning that the measurement of in 48Ca and 208Pb are of enormous significance due
to their very strong correlation to the slope of the symmetry energy
around saturation density Brown (2000); Furnstahl (2002); Centelles et al. (2009); Roca-Maza et al. (2011). The neutron skin thickness of
208Pb has been preliminarily measured by the PREX Collaboration
at Jefferson Laboratory Abrahamyan et al. (2012), and will be
measured with higher accuracy by the PREX-II
experiment Paschke et al. (2011) in 2017. An already approved CREX
experiment on the other hand aims to measure the neutron skin
thickness of 48Ca Paschke et al. (2013). The calculations of Table II is
performed using the Sky3D code with isolated boundary
conditions, for the Coulomb force. The charge radius is calculated
using the point-proton mean-square radius from Sky3D and the approximate analytic
formula Ong et al. (2010)
| (6) |
where fm2 and fm2 are the mean-square charge radii of the proton and the neutron, respectively, fm2 is the so-called Darwin-Foldy term, and is the relativistic spin-orbit correction. Notice, that the slope of the symmetry energy is closely related to the pressure of pure neutron matter at saturation density, i.e., . Therefore the larger results in the higher neutron pressure which leads to greater neutron radii and thicker neutron skins as neutrons are pushed out against surface tension.
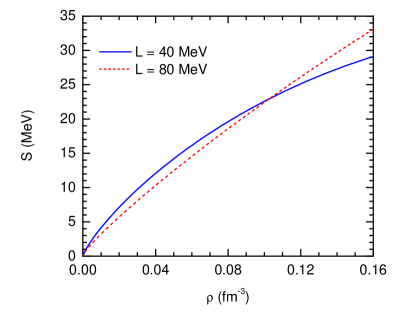
In Fig. 1 we display the resulting density dependence of the nuclear symmetry energy for these two interactions. The large magnitude of the density slope ensures that at sub-saturation densities pertaining to the crust of neutron stars the nuclear symmetry energy acquires smaller values. Thus for large it becomes energetically favorable for the system to become more neutron-rich at these densities. For the same reason, the proton fraction in the system increases, when is small (soft symmetry energy).
II.2 Grid Spacing and Accuracy Considerations
As noted above, in Sky3D the wave functions and fields are
defined on a three-dimensional regular Cartesian
grid Maruhn et al. (2014). In particular, in calculating the
values of Table 2 we used a cubic box with size
fm and grid spacing of fm in each direction. As
shown in Ref. Sagert et al. (2016), changing the box size to
larger values does not significantly change the total energies of
the ground state. In fact, doubling the box size can add an
additional energy of only less than 0.012%. On the other hand, the
choice of the physical spacing between the grid points can be more
important, especially when the grid spacing is larger than fm. The calculations presented in Table 2 uses a
very fine grid of fm. However this comes at a
significant cost on computational time. For accurate results in
finite nuclei calculations a typical value was suggested to be taken
as fm. Indeed, when we used
fm, the error is less than 0.013%, whereas the calculation speeds
up by about 100 times. Ideally, the computation time is expected to
scale as , where is the total number of the grid points in
one direction, . In Ref. Newton (2007), it was
shown that the maximum grid spacing for nuclear pasta calculations
may be taken as large as fm. Notice that the simulation
runtime also depends on the number of nucleons , and scales
approximately as due to diagonalization of the
Hartree-Fock hamiltonian. Thus for a fixed average baryon density
and fixed physical spacing between the grid points, doubling the
simulation volume (i.e ) makes the
simulation runtime approximately times longer.
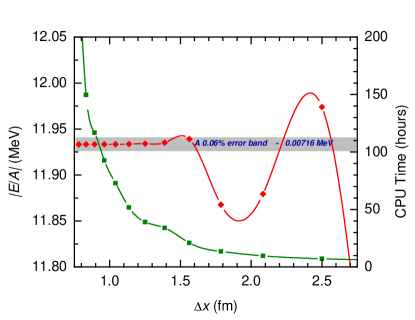
With the aim to maximize the volume of the nuclear pasta systems, we explored the optimal value of the physical grid spacings that allows one to perform nuclear pasta simulations without the loss of accuracy in energies. Notice that nuclear pasta phases are expected to be sensitive to the binding energy differences of as small as MeV per nucleon. In Fig. 2 we display the absolute values of the binding energy per nucleon for a system with nucleons as a function of the grid spacing. We initialize our system with all nucleons randomly distributed within the box, and the initial single-particle wave functions are given as a sum of 27 three-dimensional Gaussians with widths of fm that are centered at the nucleon coordinates with their closest images formed due periodic boundary conditions. As evident from Fig. 2—and as far as the binding energies are concerned—the accuracy of the results are maintained within 0.06% for grid spacings of as large as fm. Moreover, while the corresponding simulation runtime gets significantly reduced, an appreciable speed up in the convergence is not observed beyond fm. And since the number of grid points must be chosen as even numbers to preserve the reflection symmetry, we ensure that our grid spacings are chosen as large as possible but not larger than fm in our pasta calculations.
In Sky3D the coupled
mean-field equations are solved iteratively. The wave functions are
iterated with a gradient step method which is accelerated by the
kinetic-energy damping (see Ref. Maruhn et al. (2014) for
details):
where is the operator of kinetic energy, means orthonormalization of the whole set of new wave functions, is single-particle hamiltonian, and the upper index indicates the iteration number. The damped gradient step has two numerical parameters, the step size and the damping regulator . Ref. Maruhn et al. (2014) suggests a value of and MeV should be optimal. Larger values of yield faster iteration, but can run more easily into pathological conditions.
In an effort to optimize our simulation we introduced a variable step size that starts with an initial and is systematically increased by a factor of if the new single-particle energies are smaller than the one from the previous iteration, otherwise it is decreased by a factor of . This ensures in average an about three times faster convergence than when a constant is assumed.
To avoid getting trapped in a metastable state we run our simulations very long and have chosen our convergence criterion to be MeV, where is total energy per nucleon at a given iteration, and . The total energy of the ground state is then found as .
II.3 Finite Size Effects and the Minimum Number of Nucleons
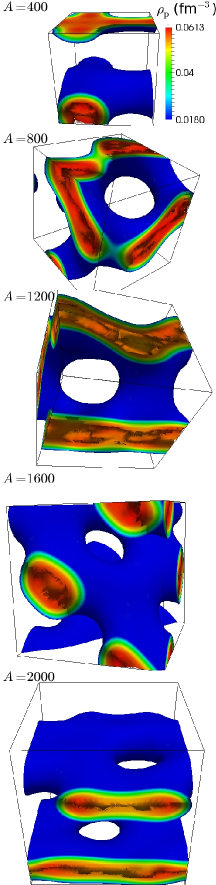
Having settled on the optimum choice of the grid spacing, in this subsection we explore the role of the finite size effects on the energetics and geometries of the nuclear pasta. In Fig. 3 we plotted the isosurface of proton densities for systems with , , , and nucleons, respectively, at a fixed average baryon density of fm-3 and proton fraction of . In Table 3 we present the corresponding energetics and maximum local densities.
It turns out, that all of these systems are energetically very close to one another with accuracy of less than 0.0445 MeV in the binding energy per nucleon. Nevertheless, as depicted in Fig. 3 the corresponding pasta phases assume a seemingly different shape for each case. Considering that these systems obey periodic boundary conditions it is not difficult to see that most of them are in the nuclear waffle state with the exception of and , where there are additional 3D connections Schneider et al. (2014). The existence of nuclear waffles as perforated plates was observed by Ref. Schneider et al. (2014) using MD simulations and also in Schuetrumpf et al. (2013), where it was denoted as the rod(2) shape. This phase is expected to lie in the transition between a phase made up of elongated cylindrical nuclei and a phase formed of a stack of parallel flat plates. Recently it was shown Sagert et al. (2016) that if the simulation is initialized from the single-particle wavefunctions constructed from a converged MD simulation, the waffle state remains stable even when quantum mechanical effects are considered. Even starting from a completely random initial configuration we confirm that the waffle state is a true stable nuclear pasta configuration in agreement with the results obtained by Ref. Schuetrumpf et al. (2013); Schneider et al. (2014). Looking more closely at the individual energy components as given in Table 3, we realize that the highest percentage error comes from the Coulomb energy contribution. This is because the Coulomb force has long-range interaction and can extend much beyond the boundaries of smaller boxes. The individual energy terms from Skyrme force have also larger percentage errors as opposed to the total energy. This is primarily due to the fact that the ground state is, by definition, obtained by minimizing the total energy. Therefore individual terms can have different values stemming from the competition between nuclear and electric forces and as a result of their overall effort to minimize the ground state energies. Thus, although the final ground state energies are close to one another, the final shape of the nuclear pasta depends on the system size as a result of such competition. Following Fig. 3 where we obtained at least two pasta structures for a system with an average baryon density of fm-3, in the next part of our discussions we assume systems containing nucleons.
III Results
III.1 Neutron Star Crust:
Every simulation described here has nucleons. These nucleons are initially randomly positioned within a cubic box with sides and corresponding initial single-particle wave functions are constructed by folding Gaussians over each nucleon. We present and discuss our results for a fixed proton fraction of . This condition mimics the matter content in the neutron star crust. For a proper description of the neutron-star matter, one must obtain proton fractions self-consistently by using the condition of chemical equilibrium:
| (7) |
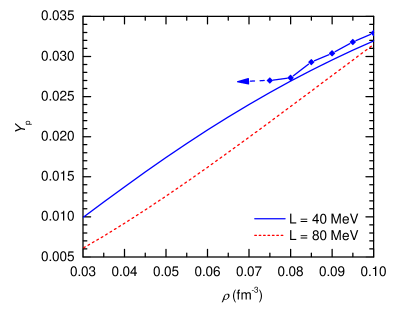
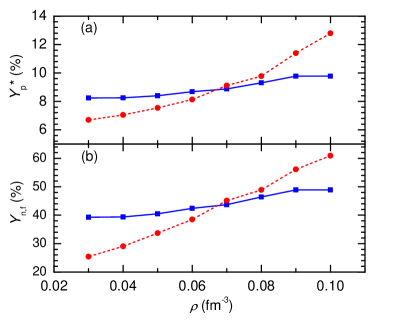
where is the chemical potential of species for neutrons, protons and electrons, respectively. Assuming a uniform nuclear matter in beta-equilibrium we find that both interactions predict proton fractions to be less than 5% at densities of where the emergence of nuclear pasta is expected, see Fig. 4. In this figure we also display proton fractions at a few fixed baryon densities which were obtained directly from the nuclear pasta simulations. For this we fixed the proton number at and varied the neutron number, , in search for the value of that satisfies the condition (7). Notice that this search is quite exhausting as far as the simulation computing times are concerned. Moreover, for realistic results one must choose proton numbers to be . We reserve to carry out such simulations in the future. However, we would like to point out that whereas at densities close to saturation the proton fractions closely match that obtained from a uniform matter distribution, at lower sub-saturation densities the realistic proton fractions can be larger due clustering effects as hinted by the left arrow in Fig. 4. The question of whether exotic structure phases can develop in a proton-deficient environment was critically analyzed by Ref. Piekarewicz and Toledo Sanchez (2012). In particular, they found an interesting behavior displayed in the structure factor that could be indicative of significant structural changes in the system. Nevertheless, it was concluded that no clear evidence exists either in favor or against the formation of the nuclear pasta at the neutron crust. To our knowledge, no other full quantum numerical simulations have been carried out with proton fractions less than .
| Model | (MeV) | (%) | ||||
|---|---|---|---|---|---|---|
| UNEDF1 | ||||||
| UNEDF1⋆ | ||||||
| UNEDF1 | ||||||
| UNEDF1⋆ | ||||||
| UNEDF1 | ||||||
| UNEDF1⋆ | ||||||
| UNEDF1 | ||||||
| UNEDF1⋆ | ||||||
| UNEDF1 | ||||||
| UNEDF1⋆ | ||||||
| UNEDF1 | ||||||
| UNEDF1⋆ | ||||||
| UNEDF1 | ||||||
| UNEDF1⋆ | ||||||
| UNEDF1 | ||||||
| UNEDF1⋆ |
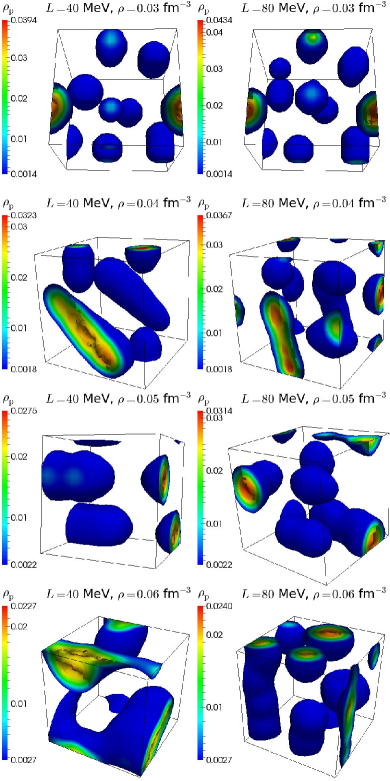
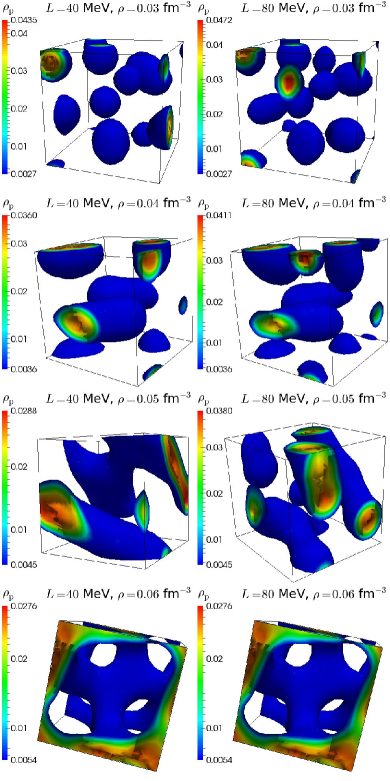
In Fig. 5 we plot the isosurface of proton densities for models with both soft, MeV, and stiff, MeV symmetry energies. At the lowest density of fm-3 considered in our simulations, we observe a combined total of spherical and deformed nuclei, unequal in size, in both models. Their location is randomly distributed within the box and do not form a lattice structure of any kind. Notice that such density already corresponds to a deeper layer of the inner crust. The transition from the outer crust to the inner crust is predicted to occur at about fm-3 Baym et al. (1971); Roca-Maza et al. (2008). Whereas at the top layer of the inner crust one expects a Coulomb crystal of neutron-rich nuclei immersed in a uniform electron gas and a dilute neutron vapor Piekarewicz and Toledo Sanchez (2012), at fm-3 the neutron vapor becomes much denser, and the crystalline structure is already destroyed. These so-called gnocchi phase could be said to form a liquid-like (or amorphous) structure with an approximate average charge of . This likely is because the system is not equilibrated. These nuclei are well separated from one another, and their sizes and shapes are mostly dictated by the Coulomb repulsion between protons and the surface energy of the system, which are almost identical in both cases. The corresponding total energies per nucleon in these two models are surprisingly different (see Table 4). This difference primarily comes from the zero-range term and density dependent term , whose values strongly depend on and Skyrme parameters, respectively Chabanat et al. (1997). Physically, a large slope parameter means that the symmetry energy at low densities is small, thus nuclei can easily become neutron-rich. On the other hand, the symmetry energy at fm-3 is larger for a model with small value of , thus it becomes energetically favorable for the system to maintain larger proton fractions. We further examined the single-particle energies and have found that the number of free neutrons, , identified as the number of neutrons with positive single-particle energies, is indeed smaller for MeV than MeV, see Table 4. Thus the system became effectively neutron-rich with an effective proton fraction being smaller in the former.
As the average baryon density increases to fm-3, the nuclei come closer, get fused and merge into super-elongated nuclei of rod-like structure, see Fig. 5. Whereas all of the 8 nuclei got merged to 3 rod-like structures in the model with the soft symmetry energy, only 1 rod-like structure and 5 nuclei are observed in the model with MeV, thus harboring a coexistence of two structures: spherical nuclei and super-elongated nuclei of rod-like behavior. Note again that this result is likely due to the system being not equilibrated. At even higher density of fm-3, the former now has 2 rod-like structures only, whereas the latter has 3 rod-like structures and 2 nuclei within the simulation box. The corresponding effective proton fractions rise in both models, meaning there are more free neutrons in the system now (see Table 4). Since the symmetry energy rises faster as a function of density in the model with MeV, the effective proton fraction also gets boosted further as evidenced by the results shown on Table 4 and displayed in Fig. 6.
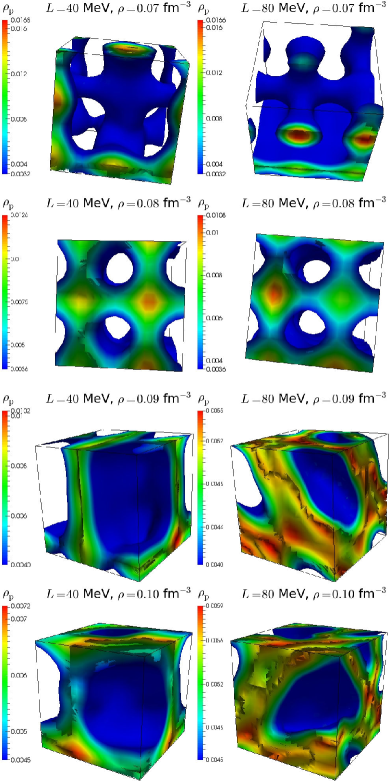
At fm-3, in UNEDF1, the rod-like structures now start getting fused in the perpendicular direction. As density is increased to fm-3 rods get further fused and the system is comprised of a continuous crest-like structure (recall that the system is periodic). On the other hand, at fm-3, the phase co-existence between rods and nuclei continue to exist in UNEDF1⋆, whereas at fm-3, we observe a combination of -surface Schuetrumpf and Nazarewicz (2015) and a flat plate, also known as the lasagna phase. This means that pure rod-like structures in models with the stiff symmetry energy can only exist within a very narrow region of densities. Correspondingly, only a very thin layer of such pasta can exist in the neutron star crust.
At fm-3 in both systems we observe hollow-tubes, also known as the bucatini phase. More neutrons become free than bound. The corresponding effective proton fractions, , and free neutron fractions, , as a function of density are plotted in the left and right panels of Fig. 6.
Finally, we observe spherical bubbles, also known as the Swiss cheese phase, at densities of fm-3 and fm-3. The sizes of spherical bubbles get smaller as the density increases and also depend on the two models considered above.
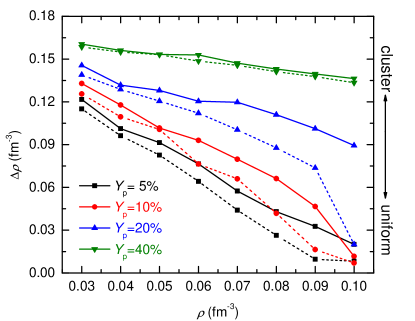
Particularly interesting is to observe the density contrast, , within the nuclear pasta systems described above. Here and are the maximum and the minimum local baryon densities within the simulation volume. In particular, is the baryon density at the central regions of pasta structures, whereas is the baryon density of the free neutron gas. The larger value of suggests that the system organized itself into complex clusters, whereas means the system is uniform. Considering Table 4 and Fig. 7 we see that a soft symmetry energy exhibits a pasta-rich system throughout the neutron star crust, whereas the clustered matter transforms quickly into the uniform matter when the symmetry energy is stiff (see Table 4).
III.2 Proto-Neutron Stars and Matter in Supernova
In cold neutron stars proton fractions of larger than can only occur at high densities and very low densities. At high densities pertaining to the core of the star the matter is uniform and no nuclear pasta phase is therefore expected. Similarly, at very low densities applicable to the outer crust, nucleons bind into nuclei that are then segregated in a crystal lattice. However, the low-density regions that contain proton fractions between can be present in dense proto-neutron stars (PNS) that are born subsequent to the core-collapse supernova explosion. The PNS is cooled primarily by neutrino emission which is driven by neutrino diffusion and convection within the PNS after the core bounces. It is therefore interesting to understand the role of the neutrino-matter interaction in the dynamics of the supernova explosion. The spectrum of neutrinos emerged from neutrino-sphere can be observed using the current and future terrestrial detectors as soon as the next galactic or near-galactic supernova goes off. This spectrum can provide a valuable information about the structure of the nuclear matter in these regions Horowitz et al. (2016).
III.2.1 Systems with
| Model | (MeV) | (%) | ||||
|---|---|---|---|---|---|---|
| UNEDF1 | ||||||
| UNEDF1⋆ | ||||||
| UNEDF1 | ||||||
| UNEDF1⋆ | ||||||
| UNEDF1 | ||||||
| UNEDF1⋆ | ||||||
| UNEDF1 | ||||||
| UNEDF1⋆ | ||||||
| UNEDF1 | ||||||
| UNEDF1⋆ | ||||||
| UNEDF1 | ||||||
| UNEDF1⋆ | ||||||
| UNEDF1 | ||||||
| UNEDF1⋆ | ||||||
| UNEDF1 | ||||||
| UNEDF1⋆ |
In proto-neutron stars, neutrinos are trapped for tens of seconds in the hot and dense nuclear medium Shen (2012). As neutrinos diffuse out of the PNS, the proton fraction in this beta equilibrium thermal matter also evolves. Therefore it is useful to explore a large range of proton fractions in the nuclear pasta formation. Notice that we use zero temperature in all of our simulations, whereas in reality, the temperature in the supernova environment can be from a few MeV to as high as MeV and even more.
At low densities, both models again feature similar geometries (see Fig. 8). We observe 8 elongated nuclei randomly located within the simulation box. The size of these structures vary from one another, and the average charge of an individual structure is . These structures significantly differ from the unstable neutron-rich nuclear isotopes with the same proton number. For example, the most neutron-rich terrestrial radioactive Mn isotope (with ) known today has neutrons. Surprisingly, the Coulomb frustration at fm-3 enables the formation of elongated nuclei with an average neutron number of ( MeV) or ( MeV). The concentration of free neutrons at this density now strongly depends on the interaction model (see Table 5). Although a significant fraction of neutrons carry positive kinetic energies, the overall energy of the ground state in this system remains negative.
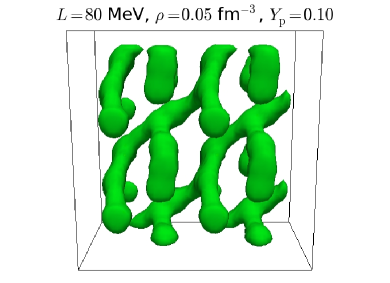
At fm-3, both models exhibit a very similar geometry: two nuclei within the simulation box fuse together to form one long rod-like structure. Thus a total of four superdeformed rod-like nuclei are formed. As the density increases, at fm-3, we observe that rod-like structures arrange themselves in a net-like structure for the model with MeV. Notice such structure was also observed for but at fm-3. On the other hand, for the system with MeV we observe a structure that resembles fibrous roots. To have a better view of this structure, in particular, we show four periodic copies of the isosurface of proton densities along two directions, mainly and , using the fact that our simulation volume is periodic. The resulting isosurface of proton densities are plotted in Fig. 9. Since the existence of many low-energy configurations is the benchmark of frustrated systems, we believe that this structure in particular could be in a metastable state. We expect that the true ground state is a -shaped junction that forms the backbone of a branched network of many frustrated systems such as the low-dimensional magnetic systems. Next, at fm-3 we observe almost identical net-like structures in both models. At an even higher densities the threads of these nets structures get thicker as a result of compression and they turn into the complex shapes previously referred to as rod(3) structures Newton and Stone (2009); Sebille et al. (2009); Pais and Stone (2012); Schuetrumpf et al. (2013). Notice this structure continue to exist in the model with soft symmetry energy even at fm-3, whereas the pasta structure almost disappears for MeV. And finally, at fm-3 both systems assume uniform phase.
III.2.2 Systems with
| Model | (MeV) | (%) | ||||
|---|---|---|---|---|---|---|
| UNEDF1 | ||||||
| UNEDF1⋆ | ||||||
| UNEDF1 | ||||||
| UNEDF1⋆ | ||||||
| UNEDF1 | ||||||
| UNEDF1⋆ | ||||||
| UNEDF1 | ||||||
| UNEDF1⋆ | ||||||
| UNEDF1 | ||||||
| UNEDF1⋆ | ||||||
| UNEDF1 | ||||||
| UNEDF1⋆ | ||||||
| UNEDF1 | ||||||
| UNEDF1⋆ | ||||||
| UNEDF1 | ||||||
| UNEDF1⋆ |
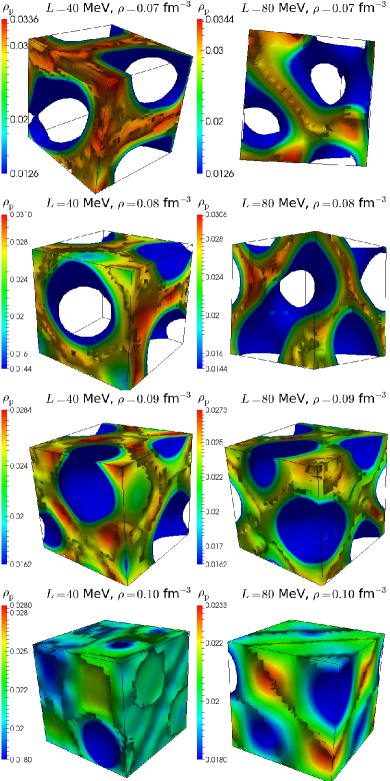
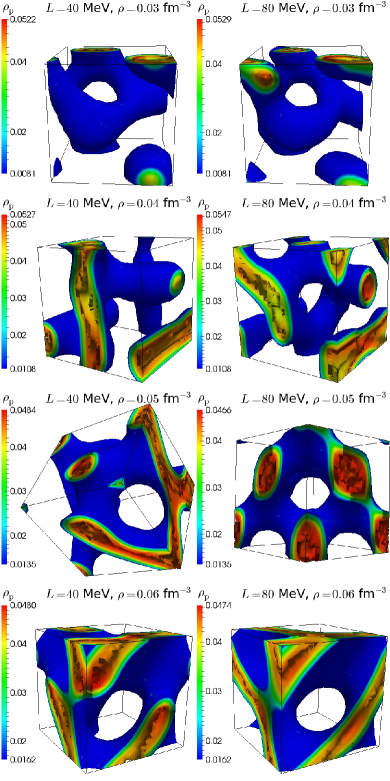
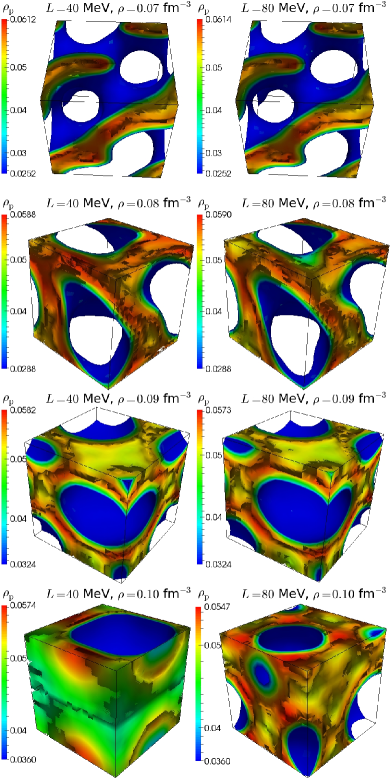
Let us now analyze the more widely studied case of systems with larger proton fractions. Such systems display a rich-variety of nuclear pasta even at high sub-saturation densities. For example, even at fm-3 the density contrast in the system is as large as fm-3 for the model with soft symmetry energy (see Fig. 7 and Table 6). Although the overall binding energy of the system is negative, there are still some free neutrons found in this system with (see Table 6). Nevertheless, the fractional population of free neutrons are much less than found before in systems with lower proton fractions. The corresponding effective proton fractions therefore do not deviate very much from 20%. All pasta structures are energetically very close to one another, yet we observe structures that are radically different in topology. Indeed, it has been first speculated by Ref. Hashimoto et al. (1984) that the transition from the highly ordered crystal to the uniform phase must proceed through a series of changes in the dimensionality and topology only that depends on density but not on total energy. We also observe that the dependence on the symmetry energy is significantly reduced both in total energies and in topology, even though the system is still relatively very neutron-rich.
At fm-3 we no longer observe a system purely made of nuclei (gnocchi phase). Instead we observe a coexistence of nuclei and rod-like structures. When the model with the soft symmetry energy is used we observe two nuclei and one rod in the simulation volume. However, for MeV we observe just one nucleus and a rod structure that is bent to assume a disconnected hook-shaped structure. At fm-3, the first system now assumes a connected hook-shaped structures that make a wave pattern, whereas the latter one assumes a structure that resembles donuts which are connected through -junctions. The lowest non-zero local baryon densities shown in Table 6 correspond to the density of background free neutron gas.
As we progressively increase the density, at fm-3 and fm-3, both systems proceed into having the donut-like shapes with less spatial separations. At higher densities the size of the openings become smaller making a transition to cylindrical holes at densities of fm-3 and eventually leading to spherical bubbles for models with the soft symmetry energy. A similar phase transition between pasta states is observed for models with the stiff symmetry energy, however the system becomes uniform at much lower densities. As can be seen from Table 6 at the average baryon density of fm-3, where the local deviation of the density within the simulation box is no more than fm-3. This result is also depicted in the lower right panel of Fig. 10.
III.2.3 Systems with
| Model | (MeV) | |||
|---|---|---|---|---|
| UNEDF1 | ||||
| UNEDF1⋆ | ||||
| UNEDF1 | ||||
| UNEDF1⋆ | ||||
| UNEDF1 | ||||
UNEDF1⋆
|
||||
| UNEDF1 | ||||
| UNEDF1⋆ | ||||
| UNEDF1 | ||||
| UNEDF1⋆ | ||||
| UNEDF1 | ||||
| UNEDF1⋆ | ||||
| UNEDF1 | ||||
| UNEDF1⋆ | ||||
| UNEDF1 | ||||
| UNEDF1⋆ |
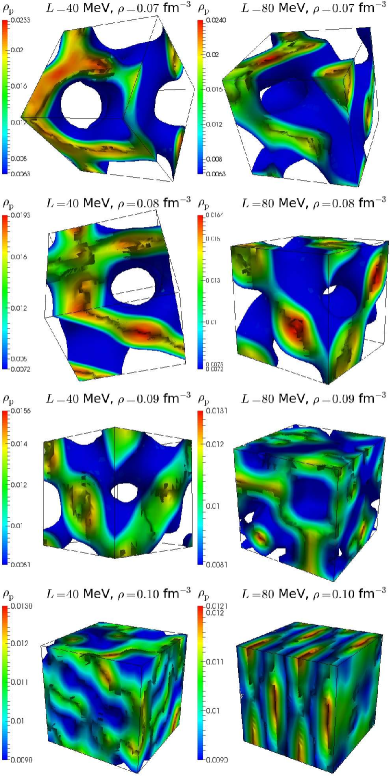
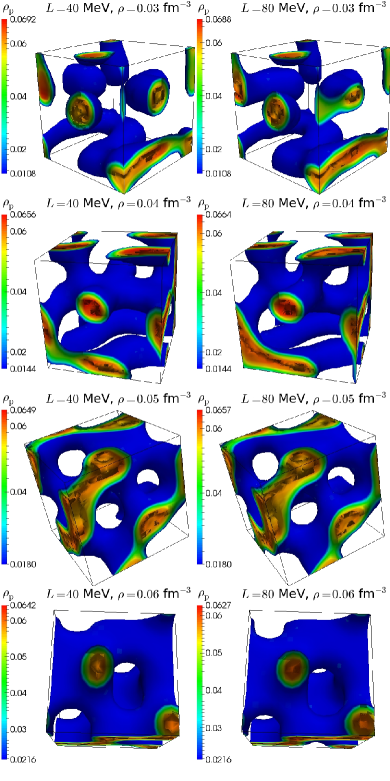
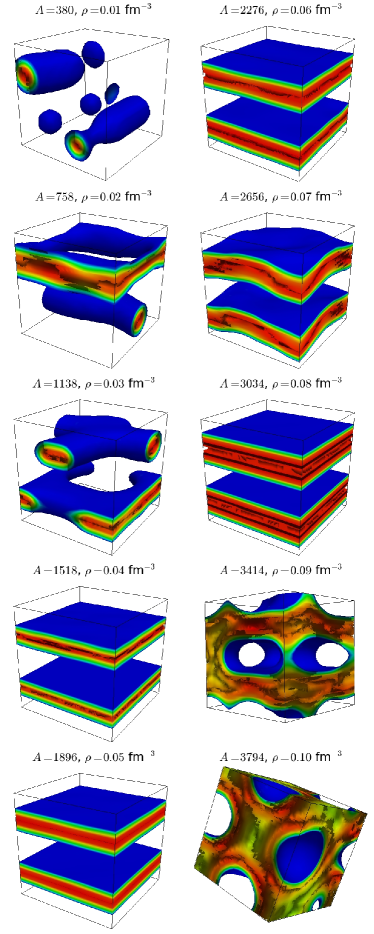
Turning to increasingly symmetric matter, in Fig. 11 we display the isosruface of the proton densities of various pasta phases for using both models with and MeV. It is observed that such systems exhibit a series of many complex geometries. We no longer observe spherical nuclei at an average density of 0.03 fm-3, which was chosen as the starting point of our simulations. Obviously, the gnocchi phase must have formed at an even lower density for . At the lowest density considered in our simulation we observe fibrous root-like structures, at 0.04 fm-3 we observe rod(3) structures. At densities of 0.05 and 0.06 fm-3 the pasta system is composed of circular perforated complex systems, at 0.07 and 0.08 fm-3 the nuclear pasta transitions to the bucatini phase, and finally at 0.09 and 0.10 fm-3 they form the Swiss cheese. The pasta systems are strongly bound with binding energies ranging from MeV for systems with average baryon density of 0.03 fm-3 to MeV for systems with fm-3 (see Table 7).
All neutrons strongly participate in forming the pasta structure, and there are no free neutrons left in the system. Thus the neutron gas background that was making the lowest density of the simulation box in the previous systems with lower proton fractions now simply vanishes. The vanishing of the neutron gas background for was also obtained earlier Ref. Schuetrumpf and Nazarewicz (2015). For this and larger proton fractions one can either plot the isosurface of proton densities or total densities that are both visually indistinguishable.
Perhaps the most interesting aspect of this system is to notice that the dependence on the nuclear symmetry energy has now become less prominent. The binding energies in all configurations are very close. The similarity of density contrasts for these configurations as predicted by both models suggest that the pasta structures should also be close to one another, which is confirmed by comparing them as displayed in Fig. 11. Thus while the symmetry energy plays a significant role for the nuclear pasta formation in the neutron star crust and for the the regions of Supernovae with low proton fractions its role becomes insignificant for pasta formation at . This result is one of the important findings of our work.
III.2.4 Systems with
| Model | (MeV) | |||
|---|---|---|---|---|
| UNEDF1 | ||||
| UNEDF1⋆ | ||||
| UNEDF1 | ||||
| UNEDF1⋆ | ||||
| UNEDF1 | ||||
| UNEDF1⋆ | ||||
| UNEDF1 | ||||
| UNEDF1⋆ | ||||
| UNEDF1 | ||||
| UNEDF1⋆ | ||||
| UNEDF1 | ||||
| UNEDF1⋆ | ||||
| UNEDF1 | ||||
| UNEDF1⋆ | ||||
| UNEDF1 | ||||
| UNEDF1⋆ |
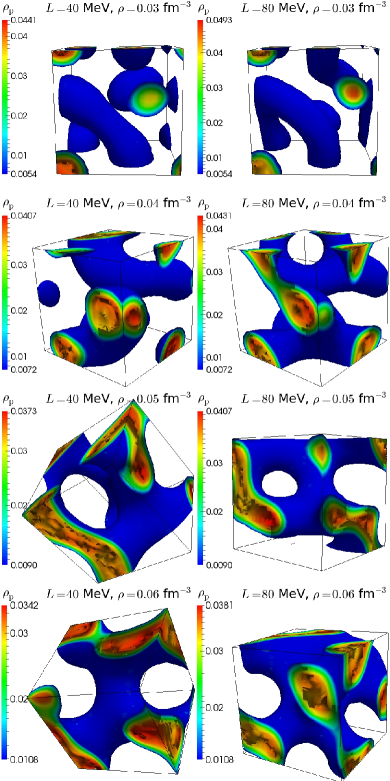
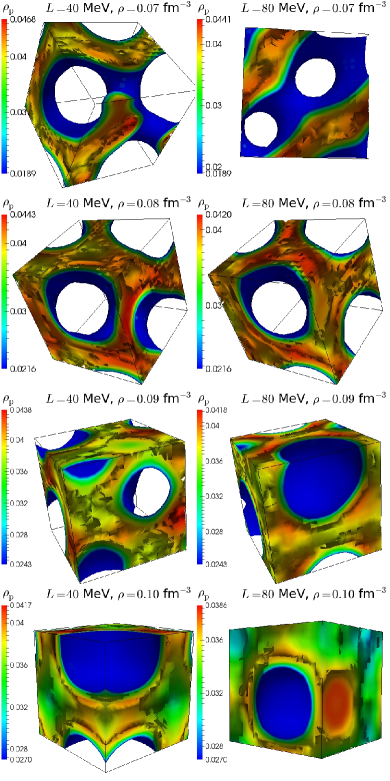
Finally, we study the case of . This proton fraction is roughly comparable to that found in the collapsing dense core of a supernovae, before the matter gets heated further by the shock wave. As confirmed in the previous subsection and given the fact that the matter is close to being isospin symmetric, the role of the symmetry energy becomes negligible. The maximum local density in the system is equal to that of the nuclear saturation density, fm-3. At densities of 0.03 and 0.04 fm-3 the pasta system is made of connected rod structures (see Fig. 12). At fm-3, rods merge to form complex structures with circular openings and at fm-3 they form states that closely resemble the perforated parallel plates, which are now connected along their normal direction. Again, as density increases, the matter forms cylindrical holes at and fm-3, and finally spherical bubbles are observed at higher densities.
The nuclear pasta at is strongly bound, no neutron background exists as in the case of . The binding energy per nucleon is much smaller than that of the uniform matter. For example, at fm-3 we have MeV, whereas the uniform nuclear matter predicts an almost twice smaller value of MeV. When symmetric nuclear matter (SNM) is considered a similarly large difference in the binding energies per nucleon would obviously be expected between the uniform nuclear matter and the nuclear pasta. Given this fact, a word of caution on the definition of the symmetry energy or the SNM is in order. The symmetry energy which is defined as the coefficient of expansion of the binding energy per nucleon, ,
| (8) |
where is the isospin asymmetry, usually represents the energy cost per nucleon of changing all the protons in SNM into neutrons. We should be wary about the latter description because the ground state of matter at sub-saturation densities is not that of a uniform matter. Therefore in this description where the usage of SNM appears, one should explicitly state that a hypothetical uniform nuclear matter has been considered, which can easily cluster if left alone.
III.3 Sensitivity of the “Ground State” to the Initial Configurations
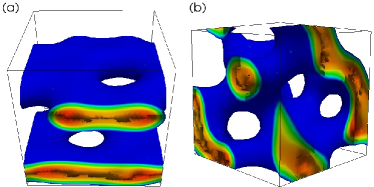
Notice that none of our simulations have produced parallel plates. One reason is because parallel plates might have formed in a very small density range not considered in our simulations. Indeed, using an almost times smaller number of particles, but exploring a density range of fm-3 with smaller steps of fm-3, Ref. Sch trumpf et al. (2014) has observed parallel plates to appear within a very short density range. The other reason is because our simulation could significantly depend on the initial configurations of the system. In most of other previous full quantum mechanical studies the existence of stable plate configuration was usually confirmed by assuming that the initial state of the system is already in the plate configuration and by using certain guiding potentials that lead to this form. Since we have started from a completely random distributions of nucleons, it is not guaranteed that our final configurations are in the true ground state of the nuclear pasta, but the solutions are driven to a meta-stable state.
We start the analysis by comparing two identical configurations with
fm-3, , and that have
started from different random initial configurations and different
grid spacings. At the final converged stated we obtained MeV and MeV, respectively. While these
states have similar energies, the final pasta shapes are not quite
identical. The first one gives two parallel plates with
wholes—nuclear waffle—whereas the second one gives perforated
plates with complex 3D connections, see Fig. 13. There
could be two reasons behind this difference. First reason is that
the grid spacings in two simulations were different, with the first
one being a fine grid spacing of fm, whereas with
the second one being fm. Our energy difference of
MeV at first suggests that perhaps a finer grid spacing
should be sought in the future simulations. However, earlier in
Section II.1 and Fig. 2 we have shown that the
dependence on the grid spacing should be minimal with energy
difference of less than MeV if started from the same initial
configuration. Whereas the difference of MeV is still tiny
(about only), the observed pasta topologies are quite
different. The second reason for this could therefore be that the
final state of the system is very sensitive to the initial
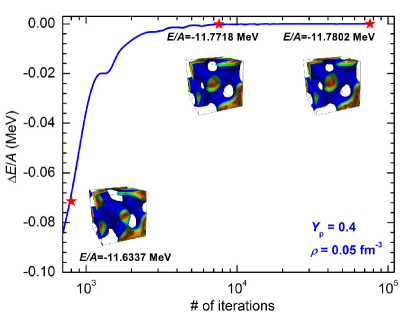
configurations. In Fig. 14 we compare intermediate pasta
states during the convergence at various iteration points. For the
first iterations the simulation converges quickly, and
in the remaining iterations we do not see a
significant change in both the energy and the topology of the
system. This suggests that the simulation gets trapped in a
meta-stable state after the first few thousands iterations. For
example, the energy difference of only MeV is observed in the last 68,400 iterations
corresponding to 28,700 CPU hours in the simulation runtime. This
suggests that it is not important to run the Sky3D
simulations over about, iterations, which saves a
considerable amount of CPU hours. The question then arises on how to
find the true ground state of the nuclear pasta.
To further study this in more details we have explored three possibilities. In addition to an already discussed case with the initial configuration of randomly distributed nucleons in the simulation volume, we have considered two other cases with initial configurations of: (a) parallel rods on a face-centered site (spaghetti phase) and (b) parallel plates (lasagna phase). The MD simulations for large proton fractions suggest that the spaghetti phase should appear at densities of fm-3, whereas the lasagna phase should appear at densities of fm-3 Schneider et al. (2013). Starting out from pre-assumed spaghetti and lasagna phases we therefore expect these pasta phases to remain stable at these densities.
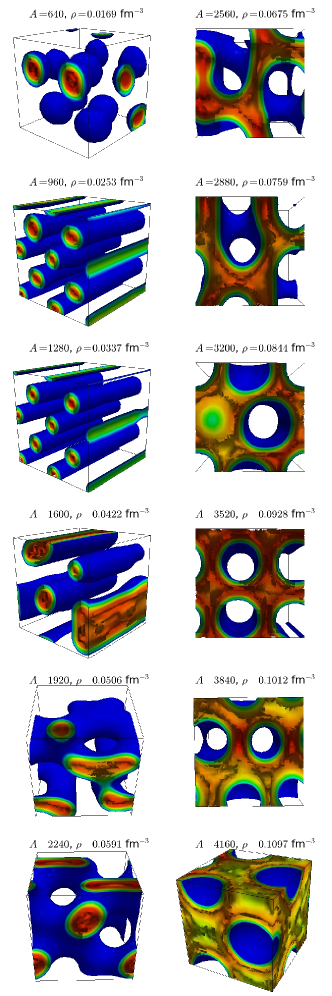
The spaghetti case is prepared as follows. We fixed the simulation volume to be cubic with sides of fm. The grid spacing was fixed at fm. A total of eight identical parallel rods whose axes align along the z-direction and are packed in a face-centered site were formed by randomly distributing neutrons and protons within the rod structure. Since each rod structure contains the same number of neutrons or protons, the total proton number and neutron number were therefore chosen as multiples of eight. Furthermore, since the volume of the system was fixed, the average baryon density cannot be set arbitrarily but is determined by the number of nucleons, . We considered a total of configurations with the number of nucleons ranging from . The corresponding average baryon densities are fm-3. In Fig. 15 we display our results for these simulations. At very low densities the system arranges itself into eight 32Ge isotopes. Notice that indeed the spaghetti phase remains stable in agreement with the MD simulations even when full quantum mechanical effects are considered. Whereas there is a qualitative agreement with the results displayed in Fig. 12 the overall topology is quite different in two cases. The complex perforated plates with normal connections are observed at densities of fm-3. At higher densities the nuclear pasta transitions into the bucatini phase (anti-spaghetti). It is very interesting to note that the cylindrical holes continue to exist even at a very high density of fm-3, where we observe a phase coexistence between the cylindrical holes and spherical bubbles. Recall that when we initialized the system with a randomly distributed nucleons this phase got diminished already at fm-3 (compare with Fig. 12). Moreover, to the best of our knowledge, cylindrical holes at densities as large as fm-3 have never been observed in the previous simulations that uses simplified interactions. And finally, regular spherical bubbles (anti-gnocchi) are formed at a very high density of fm-3. The system assumes a uniform phase at higher densities and we did not display our result here.
In the next case, we prepared our initial configurations assuming that all nucleons are evenly distributed to make two parallel plates. By folding Gaussians over each nucleon we constructed the initial single-particle wave functions and solved Hartree-Fock equations iteratively. When the simulation is converged we observe completely different topologies than the ones observed before (see Fig. 16). In particular, at a very low density of fm-3 we observe two super-elongated nuclei and two spherical nuclei (that resembles baseball bat and ball). At fm-3, a phase coexistence between two types of rods is observed. Particularly interesting is the nuclear waffle state that forms much earlier than observed before at the density of fm-3. And the initial lasagna phase remains stable over a large density region of fm-3. The anti-spaghetti phase is not observed at all within the density steps we considered in our simulations. After developing through spherical bubbles at 0.10 fm-3, the pasta structure completely disappears at fm-3.
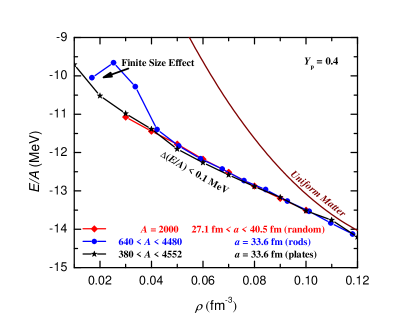
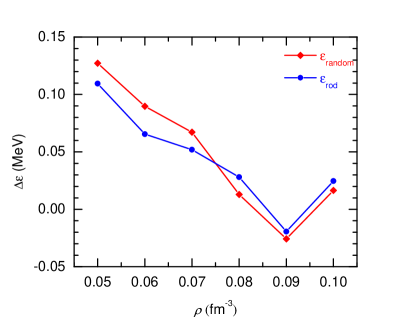
These results obtained above are the consequence of generic features of matter frustration that allows many different local energy minima, hence pasta topologies. Thus we have obtained a series of pasta geometries where matter got trapped in a quasi-ground state. In order to determine which of these states represent the true ground state, in Fig. 17 we plot the (quasi-) ground state energies per nucleon as a function of average baryon density for all three cases considered above. As evident from the figure, energetically these pasta structures are very close to one another. A careful observation of energies suggests that at densities of fm-3, for example, the system favors the lasagna phase (See Fig. 18). However, considering that we explored only few possibilities, it is difficult to predict the true ground state of the system—hence the formation of other pasta geometries—just by comparing these energies alone.
As a final note, we would like to point out that one way to get a time-efficient convergence is to start solving the Hartree-Fock equations by initializing the single-particle wave functions from an already converged classical or quantum MD simulations that have shown to give a full qualitative picture of nuclear pasta topologies. This will significantly reduce the simulation runtime, which in turn allows to explore much larger simulation volumes. Our preliminary calculations show that the ground state energies are slightly lower when the simulation is initialized from a converged state of classical MD simulations. Clearly, much work remains to be done in these fronts to determine the true ground state of the nuclear pasta.
IV Conclusions
In this work we performed large volume simulations of the nuclear
pasta using the Skyrme Hartree Fock calculations with Sky3D.
We considered a range of proton fractions with ,
, , and as well as the range of baryon
densities from fm-3, applicable to the
nuclear matter found in the neutron star crust and supernovae. We
discussed the role of the nuclear symmetry energy in the pasta
formation and have found that it strongly impacts the nuclear pasta
geometries in the neutron star crust but has negligible effect on
the nuclear pasta in the Supernovae, where the proton fraction is
large. In particular, the crust of the neutron star contains a
larger density regions with pasta if the nuclear symmetry energy is
soft. Various nuclear pasta geometries exist even if the density
slope of the nuclear symmetry energy is as large as MeV in
agreement with previous calculations. All pasta regions are found to
be filled with the neutron gas background for proton fractions
fm. At higher proton fractions, neutron gas
background vanishes, and all neutrons in the system strongly
participate in forming the pasta topology.
Particularly interesting is the nuclear waffle formation. Independently from the classical MD simulations, we confirmed that the nuclear waffle state forms naturally even when full quantum mechanical effects are considered. The existence of disconnected rod structures with -shaped junctions hints that many of these pasta geometries can be in the quasi-ground state. We have explored three possible scenario in which the initial state of the system was prepared by assuming that nucleons are randomly distributed within (1) the full simulation volume, (2) eight parallel rods on a face-centered site, and (3) two parallel plates. The resulting energies of the system are very close to one another with MeV. Nevertheless, the final “ground” state in each scenario have distinct pasta geometries. Determination of the true ground state requires the exploration of all possible probes which is quite tedious in practice. As a possible alternative, we suggest to initiate simulations from the final state of various classical or quantum MD solutions. This way the system will be converged time-efficiently, MD pasta geometries can be tested for stability against density fluctuations by using full quantum simulation, and quantitatively accurate results can be presented.
Acknowledgements.
FJF and CJH are supported by the U.S. Department of Energy (DOE) grants DE-FG02-87ER40365 (Indiana University), DE-SC0008808 (NUCLEI SciDAC Collaboration) and by the National Science Foundation through XSEDE resources provided by the National Institute for Computational Sciences under grant TG-AST100014. BS is supported by DOE grant DE-SC0008511 (NUCLEI SciDAC-3 collaboration). This work benefited in parts from discussions at the Frontiers in Nuclear Astrophysics meeting supported by the National Science Foundation under Grant No. PHY-1430152 (JINA Center for the Evolution of the Elements). The authors would like to thank the developers of the codeSky3D and are grateful to Indiana
University for accessing to the resources at the Big Red II
supercomputer.
References
- Watanabe et al. (2003) G. Watanabe, K. Sato, K. Yasuoka, and T. Ebisuzaki, Phys. Rev. C68, 035806 (2003) .
- Watanabe et al. (2005) G. Watanabe, T. Maruyama, K. Sato, K. Yasuoka, and T. Ebisuzaki, Phys. Rev. Lett. 94, 031101 (2005) .
- Horowitz et al. (2004a) C. J. Horowitz, M. A. Perez-Garcia, and J. Piekarewicz, Phys. Rev. C69, 045804 (2004a) .
- Horowitz et al. (2004b) C. J. Horowitz, M. A. Perez-Garcia, J. Carriere, D. K. Berry, and J. Piekarewicz, Phys. Rev. C70, 065806 (2004b) .
- Horowitz et al. (2005) C. J. Horowitz, M. A. Perez-Garcia, D. K. Berry, and J. Piekarewicz, Phys. Rev. C72, 035801 (2005) .
- Schneider et al. (2013) A. S. Schneider, C. J. Horowitz, J. Hughto, and D. K. Berry, Phys. Rev. C88, 065807 (2013) .
- Ravenhall et al. (1983) D. G. Ravenhall, C. J. Pethick, and J. R. Wilson, Phys. Rev. Lett. 50, 2066 (1983).
- Hashimoto et al. (1984) M. Hashimoto, H. Seki, and M. Yamada, Prog. Theor. Phys. 71, 320 (1984).
- Lorenz et al. (1993) C. P. Lorenz, D. G. Ravenhall, and C. J. Pethick, Phys. Rev. Lett. 70, 379 (1993).
- Horowitz et al. (2015) C. J. Horowitz, D. K. Berry, C. M. Briggs, M. E. Caplan, A. Cumming, and A. S. Schneider, Phys. Rev. Lett. 114, 031102 (2015) .
- Levin and Ushomirsky (2001) Y. Levin and G. Ushomirsky, Mon. Not. Roy. Astron. Soc. 324, 917 (2001) .
- Gusakov et al. (2004) M. E. Gusakov, D. G. Yakovlev, P. Haensel, and O. Y. Gnedin, Astron. Astrophys. 421, 1143 (2004) .
- Gearheart et al. (2011) M. Gearheart, W. G. Newton, J. Hooker, and B.-A. Li, Mon. Not. Roy. Astron. Soc. 418, 2343 (2011) .
- Pons et al. (2013) J. A. Pons, D. Vigano’, and N. Rea, Nature Phys. 9, 431 (2013) .
- Bethe (1990) H. A. Bethe, Rev. Mod. Phys. 62, 801 (1990).
- Alloy and Menezes (2011) M. D. Alloy and D. P. Menezes, Phys. Rev. C83, 035803 (2011) .
- Janka (2012) H.-T. Janka, Ann. Rev. Nucl. Part. Sci. 62, 407 (2012) .
- Pethick and Potekhin (1998) C. J. Pethick and A. Y. Potekhin, Phys. Lett. B427, 7 (1998) .
- Nakazato et al. (2009) K. Nakazato, K. Oyamatsu, and S. Yamada, Phys. Rev. Lett. 103, 132501 (2009) .
- Williams and Koonin (1985) R. D. Williams and S. E. Koonin, Nucl. Phys. A435, 844 (1985).
- Lassaut et al. (1987) M. Lassaut, H. Flocard, P. Bonche, P. H. Heene, and E. Suraud, Astron. Astrophys. 183, L3 (1987).
- Oyamatsu (1993) K. Oyamatsu, Nucl. Phys. A561, 431 (1993).
- Maruyama et al. (2005) T. Maruyama, T. Tatsumi, D. N. Voskresensky, T. Tanigawa, and S. Chiba, Phys. Rev. C72, 015802 (2005) .
- Schuetrumpf et al. (2015) B. Schuetrumpf, M. A. Klatt, K. Iida, G. E. Schroeder-Turk, J. A. Maruhn, K. Mecke, and P. G. Reinhard, Phys. Rev. C91, 025801 (2015) .
- Okamoto et al. (2012) M. Okamoto, T. Maruyama, K. Yabana, and T. Tatsumi, Phys. Lett. B713, 284 (2012) .
- Magierski and Heenen (2002) P. Magierski and P.-H. Heenen, Phys. Rev. C65, 045804 (2002) .
- Grill et al. (2012) F. Grill, C. Providencia, and S. S. Avancini, Phys. Rev. C85, 055808 (2012) .
- Newton and Stone (2009) W. Newton and J. Stone, Phys. Rev. C79, 055801 (2009).
- Schuetrumpf et al. (2013) B. Schuetrumpf, M. A. Klatt, K. Iida, J. Maruhn, K. Mecke, and P.-G. Reinhard, Phys. Rev. C87, 055805 (2013) .
- Pais and Stone (2012) H. Pais and J. R. Stone, Phys. Rev. Lett. 109, 151101 (2012).
- Sagert et al. (2016) I. Sagert, G. I. Fann, F. J. Fattoyev, S. Postnikov, and C. J. Horowitz, Phys. Rev. C93, 055801 (2016) .
- Gupta and Arumugam (2013) N. Gupta and P. Arumugam, Phys. Rev. C87, 028801 (2013) .
- Avancini et al. (2008) S. Avancini, D. Menezes, M. Alloy, J. Marinelli, M. Moraes, et al., Phys. Rev. C78, 015802 (2008).
- Avancini et al. (2009) S. Avancini, L. Brito, J. Marinelli, D. Menezes, M. de Moraes, et al., Phys. Rev. C79, 035804 (2009) .
- Maruyama et al. (1998) T. Maruyama et al., Phys. Rev. C57, 655 (1998) .
- Watanabe et al. (2002) G. Watanabe, K. Sato, K. Yasuoka, and T. Ebisuzaki, Phys. Rev. C66, 012801 (2002) .
- Watanabe and Sonoda (2005) G. Watanabe and H. Sonoda, (2005), cond-mat/0502515 .
- Sonoda et al. (2008) H. Sonoda, G. Watanabe, K. Sato, K. Yasuoka, and T. Ebisuzaki, Phys. Rev. C77, 035806 (2008), [Erratum: Phys. Rev.C81,049902(2010)] .
- Watanabe et al. (2009) G. Watanabe, H. Sonoda, T. Maruyama, K. Sato, K. Yasuoka, et al., Phys. Rev. Lett. 103, 121101 (2009) .
- Horowitz and Berry (2008) C. J. Horowitz and D. K. Berry, Phys. Rev. C78, 035806 (2008) .
- Piekarewicz and Toledo Sanchez (2012) J. Piekarewicz and G. Toledo Sanchez, Phys. Rev. C85, 015807 (2012) .
- Dorso et al. (2012) C. O. Dorso, P. A. Gimenez Molinelli, and J. A. Lopez, Phys. Rev. C86, 055805 (2012) .
- Caplan et al. (2015) M. E. Caplan, A. S. Schneider, C. J. Horowitz, and D. K. Berry, Phys. Rev. C91, 065802 (2015) .
- Schneider et al. (2014) A. S. Schneider, D. K. Berry, C. M. Briggs, M. E. Caplan, and C. J. Horowitz, Phys. Rev. C90, 055805 (2014) .
- Berry et al. (2016) D. K. Berry, M. E. Caplan, C. J. Horowitz, G. Huber, and A. S. Schneider, Phys. Rev. C94, 055801 (2016) .
- Schneider et al. (2016) A. S. Schneider, D. K. Berry, M. E. Caplan, C. J. Horowitz, and Z. Lin, Phys. Rev. C93, 065806 (2016) .
- Gimenez Molinelli et al. (2014) P. A. Gimenez Molinelli, J. I. Nichols, J. A. Lopez, and C. O. Dorso, Nucl. Phys. A923, 31 (2014).
- (48) National Research Council, “Nuclear physics: Exploring the heart of matter,” (The National Academies Press, Washington DC).
- Maruhn et al. (2014) J. A. Maruhn, P. G. Reinhard, P. D. Stevenson, and A. S. Umar, Comput. Phys. Commun. 185, 2195 (2014) .
- Alcain et al. (2014) P. N. Alcain, P. A. G. Molinelli, J. I. Nichols, and C. O. Dorso, Phys. Rev. C89, 055801 (2014) .
- Kortelainen et al. (2012) M. Kortelainen, J. McDonnell, W. Nazarewicz, P. G. Reinhard, J. Sarich, N. Schunck, M. V. Stoitsov, and S. M. Wild, Phys. Rev. C85, 024304 (2012) .
- Oyamatsu and Iida (2007) K. Oyamatsu and K. Iida, Phys. Rev. C75, 015801 (2007) .
- Horowitz et al. (2014) C. J. Horowitz, E. F. Brown, Y. Kim, W. G. Lynch, R. Michaels, A. Ono, J. Piekarewicz, M. B. Tsang, and H. H. Wolter, J. Phys. G41, 093001 (2014) .
- Bao and Shen (2014) S. S. Bao and H. Shen, Phys. Rev. C89, 045807 (2014) .
- Bao and Shen (2015) S. S. Bao and H. Shen, Phys. Rev. C91, 015807 (2015) .
- Tsang et al. (2012) M. Tsang et al., Phys. Rev. C86, 015803 (2012) .
- Lattimer (2012) J. M. Lattimer, Ann. Rev. Nucl. Part. Sci. 62, 485 (2012) .
- Li and Han (2013) B.-A. Li and X. Han, Phys. Lett. B727, 276 (2013) .
- Fattoyev et al. (2012) F. Fattoyev, W. Newton, J. Xu, and B.-A. Li, Phys. Rev. C86, 025804 (2012) .
- Piekarewicz and Centelles (2009) J. Piekarewicz and M. Centelles, Phys. Rev. C79, 054311 (2009) .
- Brown (2000) B. A. Brown, Phys. Rev. Lett. 85, 5296 (2000).
- Furnstahl (2002) R. J. Furnstahl, Nucl. Phys. A706, 85 (2002) .
- Centelles et al. (2009) M. Centelles, X. Roca-Maza, X. Vinas, and M. Warda, Phys. Rev. Lett. 102, 122502 (2009) .
- Roca-Maza et al. (2011) X. Roca-Maza, M. Centelles, X. Vinas, and M. Warda, Phys. Rev. Lett. 106, 252501 (2011) .
- Abrahamyan et al. (2012) S. Abrahamyan, Z. Ahmed, H. Albataineh, K. Aniol, D. Armstrong, et al., Phys. Rev. Lett. 108, 112502 (2012) .
- Paschke et al. (2011) K. Paschke, K. Kumar, R. Michaels, P. A. Souder, and G. M. Urciuoli, Proposal to Jefferson Lab PAC 38 (2012), http://hallaweb.jlab.org/parity/prex/prexII.pdf .
- Paschke et al. (2013) K. Paschke, K. Kumar, R. Michaels, P. A. Souder, and G. M. Urciuoli, Proposal to Jefferson Lab PAC 40 (2013), http://hallaweb.jlab.org/parity/prex/c-rex2013_v7.pdf .
- Ong et al. (2010) A. Ong, J. C. Berengut, and V. V. Flambaum, Phys. Rev. C82, 014320 (2010) .
- Newton (2007) W. Newton, The Phase Transition to Uniform Nuclear Matter in Supernovae and Neutron Stars, Ph.D. thesis, University of Oxford (2007).
- Henderson (2007) A. Henderson, “Paraview guide: A parallel visualization application,” (Kitware, Incorporated, 2007).
- Baym et al. (1971) G. Baym, C. Pethick, and P. Sutherland, Astrophys. J. 170, 299 (1971).
- Roca-Maza et al. (2008) X. Roca-Maza, M. Centelles, F. Salvat, and X. Vinas, Phys. Rev. C78, 044332 (2008) .
- Chabanat et al. (1997) E. Chabanat, J. Meyer, P. Bonche, R. Schaeffer, and P. Haensel, Nucl. Phys. A627, 710 (1997).
- Schuetrumpf and Nazarewicz (2015) B. Schuetrumpf and W. Nazarewicz, Phys. Rev. C92, 045806 (2015) .
- Horowitz et al. (2016) C. J. Horowitz, D. K. Berry, M. E. Caplan, T. Fischer, Z. Lin, W. G. Newton, E. O’Connor, and L. F. Roberts, (2016), arXiv:1611.10226 [astro-ph.HE] .
- Shen (2012) G. Shen, (2012), arXiv:1202.5791 [astro-ph.HE] .
- Sebille et al. (2009) F. Sebille, S. Figerou, and V. de la Mota, Nucl. Phys. A822, 51 (2009).
- Sch trumpf et al. (2014) B. Sch trumpf, K. Iida, J. A. Maruhn, and P. G. Reinhard, Phys. Rev. C90, 055802 (2014) .