-Ray Puzzles in Cygnus X: Implications for High-Energy Neutrinos
Abstract
The Cygnus X region contains giant molecular cloud complexes and populous associates of massive young stars. The discovery of spatially extended, hard -ray emission in Cygnus X by both Milagro and Fermi indicates that Cygnus X is also a potential source of high-energy Galactic neutrinos. Here, we adapt our single-zone model for cosmic ray interactions in the central molecular zones of starburst galaxies for use in Cygnus X. We calculate the potential neutrino flux corresponding to the hard -ray emission from the “Cygnus Cocoon” and to the soft, diffuse interstellar -ray emission. We check our results by comparing the corresponding -ray emission against the Fermi interstellar emission model and Milagro, ARGO-YBJ, and HAWC observations. In comparing our results against a recent IceCube analysis and the current sensitivity limits, we find that neutrino emission from the Cocoon has a large enough flux that it could plausibly be detected, provided hadronic interactions are occurring at sufficiently high energies. High-energy neutrinos from Cygnus X would provide direct evidence for the presence of as yet unidentified PeV energy accelerators in the Galactic disk.
I Introduction
The detection of high-energy astrophysical neutrinos by IceCube has opened a new window into cosmic ray astrophysics and a new path for studies of potential cosmic particle accelerators operating at PeV energies (e.g., Aartsen et al., 2014, 2016, a). Unlike their high-energy cosmic ray counterparts, neutrinos can pass through galactic and intergalactic magnetic fields without changing their direction, and as such, neutrinos can be traced back to their original sources. This combined with the relatively low rates of interaction with intervening materials allows sources with high cosmic-ray hadronic number densities to be identified.
The detection of TeV energy -ray sources in the Galactic plane by Milagro and ARGO-YBJ provides potential clues for finding high-energy neutrino sources and cosmic accelerators (Halzen et al., 2008). Energetic sources in the Galactic plane are likely to be in the Milky Way and, thus, sufficiently nearby to be studied in detail. In a recent review of several Galactic TeV -ray sources, (Halzen et al., 2017), the authors note that MGRO J2031+41, which is spatially coincident with the well-studied Cygnus X complex, is promising as a nearby source of high-energy neutrinos that can be detected by IceCube (Ackermann et al., 2011; Aharonian et al., 2002; Anchordoqui et al., 2009; Grenier et al., 2013; Tchernin et al., 2013; Gonzalez-Garcia et al., 2014; Aartsen et al., 2015; Nierstenhöfer et al., 2015; Halzen et al., 2017).
The Cygnus X region is a nearby ( kpc) example of a giant star-forming complex containing massive molecular gas clouds, rich populations of young stars, and luminous HII regions (Baars and Wendker, 1981; Leung and Thaddeus, 1992; Kiminki et al., 2015). Cygnus X is a bright source of -rays containing both soft and hard spatially extended components and multiple point sources, including supernova remnants and pulsars (Ackermann et al., 2011). The presence of a hard -ray spectrum, in combination with dense molecular clouds (Gottschalk et al., 2012; Schneider et al., 2016) and a large number of young OB stars (Wright et al., 2015), suggests that the Cygnus X region could be a source of recently accelerated cosmic rays and high-energy astrophysical neutrinos (Aharonian et al., 2002; Ackermann et al., 2011; Grenier et al., 2013; Tchernin et al., 2013; Gonzalez-Garcia et al., 2014; Aartsen et al., 2015; Nierstenhöfer et al., 2015).
The Cygnus X region was tentatively detected in -rays by EGRET (Chen et al., 1996), and this observation was later used to confirm the Cygnus X region as a source differing from the Cyg X-3 binary by (Mori et al., 1997). Hard -ray emission from the region was confirmed with HEGRA by (Aharonian et al., 2002). Properties of the -rays from the Cygnus X region have since been extensively explored at both GeV and TeV energies with Milagro (Abdo et al., 2007a), MAGIC (Albert et al., 2008), Fermi (Ackermann et al., 2011, 2012a), ARGO-YBJ (Bartoli et al., 2014), and VERITAS (Aliu et al., 2014; Popkow, ).
The differing fields of view and energy discrimination between the various -ray detectors and the combinations of point sources and extended emission all make interpretation of the -ray data complex. Additionally, near-infrared observations of the stellar populations of Cygnus X reveal a significant range of ages among the young stars, which suggests that there may be unidentified accelerators and sources, such as pulsar wind nebulae (PWNe) or supernova remnants (SNRs), in the region (Comerón et al., 2016). Aside from the many point sources present in Cygnus X, another important feature of -ray observations of the region is the hard, extended emission, referred to as the Cygnus Cocoon by the Fermi collaboration.
The Cocoon, defined as ‘an extended excess of hard emission above the modeled background,’ was first detected by (Ackermann et al., 2011) by subtracting out the isotropic -ray background, point sources in the region, and the modeled interstellar -ray radiation from the total -ray emission from the Cygnus region. Further, extended emission has been detected at TeV energies (by Milagro, ARGO-YBJ, VERITAS, HAWC) that is spatially coincident with small portions of the Cocoon. It has yet to be established whether the Cocoon is a single entity, potentially coming from a region covering deg2 on the sky, or some combination of unresolved point sources and smaller regions of extended emission.
In this paper, we develop models for the possible neutrino fluxes from Cygnus X based on the spatially extended -ray observations. We derive gas column densities for atomic, molecular, and neutral hydrogen gas from recent Planck observations of the Galactic plane and calculate the interstellar radiation field in Cygnus X from IRAS 100 micron observations. Combining this model for the interstellar medium with local cosmic ray observations Vos and Potgieter (2015), we calculate the soft, extended -ray component in Cygnus X and compare our findings with the Galactic Interstellar Emission Model (GIEM) adopted by the Large Area Telescope (LAT) Collaboration. We also calculate the neutrino flux and compare the results with the current IceCube sensitivity limits. Finally, we compute an upper limit for the possible neutrino flux from the giant molecular cloud in CygX-North and from the collective Cygnus Cocoon, assuming hadronic -ray emission only.
II Model Setup
II.1 Theoretical Approach
II.1.1 Primary and Secondary Cosmic Rays
For simplicity’s sake, we begin by assuming that the cosmic ray spectrum observed at Earth is representative of a cosmic ray spectrum distributed uniformly throughout the galaxy. A parametrization of this spectrum, fit to observations from Voyager, AMS, and Pamela, is given by (Vos and Potgieter, 2015)
| (1) |
where is the kinetic energy of the cosmic-ray proton. Similarly, a parameterization of the cosmic-ray electron spectrum is given by (Potgieter et al., 2015)
| (2) |
Both equations are given in units of particles cm-3 GeV-1.
Inclusion of secondary cosmic rays produced in proton-proton interactions is critical to accurately modeling Cygnus X as the region is known to contain molecular clouds with high column densities (e.g., cm-2 (Schneider et al., 2006)). The main products of proton-proton interactions are charged and neutral pions. The source function for these pions depends on the ISM density () and the proton energy spectrum () such that
| (3) |
where is the pion multiplicity and , with being the fraction of proton kinetic energy transferred to the resulting pion (Kelner et al., 2006).
For charged pions, the multiplicity, , is taken from the ratio of the inclusive cross sections found in (Dermer, 1986) such that (Murphy et al., 1987). For neutral pions, the multiplicity is merely .
As pions are relatively short lived particles, it is their decay products (electrons, positrons, neutrinos, and -rays) which we will focus on. Charged pions decay into charged muons which subsequently decay into secondary electrons and positrons. The source function for secondary electrons and positrons is given by
| (4) |
where111Note that the factor of in this equation does not appear in the cited texts as the original units for were cm-3 s-1 instead of GeV-1 cm-3 s-1. , , and the electron/positron distribution in the muon’s rest frame is (Jones, 1963; Ramaty and Lingenfelter, 1966; Ginzburg, 1969; Schlickeiser, 2002). The similar rest masses of pions and muons allows us to make the substitution (Schlickeiser, 2002).
Because the region in which the secondary cosmic rays are produced is the same as the interaction region, we can take advantage of the approximation that is used in our semianalytic modeling approach in (Yoast-Hull et al., 2013), hereafter known as the YEGZ models. Thus,
| (5) |
The cosmic ray lifetime includes advection and diffusion timescales and an additional energy loss lifetime such that . These timescales are given by
| (6) | ||||
| (7) | ||||
| (8) |
Energy loss mechanisms for cosmic ray electrons include ionization, bremsstrahlung, inverse Compton, and synchrotron; the energy loss rates can be found in (Yoast-Hull et al., 2013). Due to the high gas densities and photon energy densities found in Cygnus X, the effects of both advection and diffusion are negligible for secondary electrons and positrons. Thus, the timescale for secondaries is effectively reduced to the energy loss lifetime.
Our advection timescale is assumed to be energy independent, where is the depth of the region and the wind advection speed is assumed to be km s-1, which is within a factor of a few of the Alfvén speed of the cosmic rays. In regards to the diffusion timescale, we assume an diffusion coefficient of cm s-1 and a spectral index of , consistent with scattering by a Kolmogorov spectrum of turbulence. Also, note that we assume a standard galactic magnetic field strength of 5 G throughout the region (Ferrière, 2001).
II.1.2 Gamma-Rays and Neutrinos
As noted above, charged pions decay into muons and subsequently into secondary electrons and positrons. In conserving the lepton number of these weak interactions, two muon neutrinos and an electron neutrino are also produced: and .
Because three-particle decays are quite complex, we use the analytical approximations, found in (Kelner et al., 2006), which are based on the SYBILL code for secondary particles with energies above 100 GeV. Based on Eqs. (71) and (72) in (Kelner et al., 2006), the neutrino emissivity can be represented as
| (9) |
where and . Expressions for each of the neutrino distribution functions and can both be approximated as . The equations for and correspond to Eqs. (62)–(65) and Eqs. (66)–(69) in (Kelner et al., 2006).
In addition to secondary cosmic rays and neutrinos, -rays also result from the decay of pions from proton-proton interactions. To conserve momentum, neutral pions decay in to two -rays and the emissivity for this process is given by (Stecker, 1971)
| (10) |
where .
To calculate the total -ray spectrum, we must also include leptonic production processes and account for the combined spectrum from both primary electrons and secondary electrons and positrons, [in units of cm-3 GeV-1], following from Eqs. (1), (4), (5), and (6). Cosmic-ray electrons and positrons produce -rays via bremsstrahlung in their interactions with the ISM. The emissivity for -rays from bremsstrahlung is given by
| (11) |
where (Blumenthal and Gould, 1970). The differential cross section is given by
| (12) |
where the scattering functions and is given by (Ginzburg, 1969; Blumenthal and Gould, 1970; Dermer and Menon, 2009)
| (13) |
Lastly, interactions between cosmic-ray leptons and interstellar radiation, primarily infrared and starlight, result in -rays via inverse Compton. The inverse Compton -ray emissivity is given by
| (14) |
The minimum cosmic ray energy is given by (Schlickeiser, 2002)
where is the energy of the resulting -ray, is the energy of the incident photon, and is the energy of the electron. The function is part of the Klein-Nishina cross section and is given by (Blumenthal and Gould, 1970)
where
For the infrared and stellar radiation fields, we assume an isotropic, diluted, modified blackbody spectrum (Casey, 2012)
| (15) |
where is a spatial dilution factor (given by the normalization ) and corresponds to m.
II.2 Observational Inputs
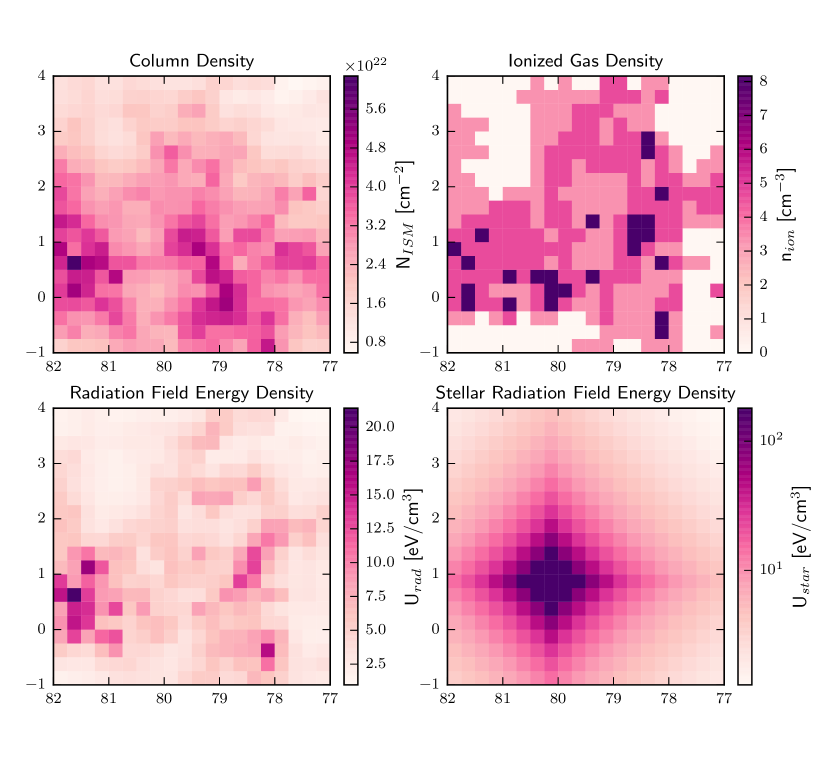
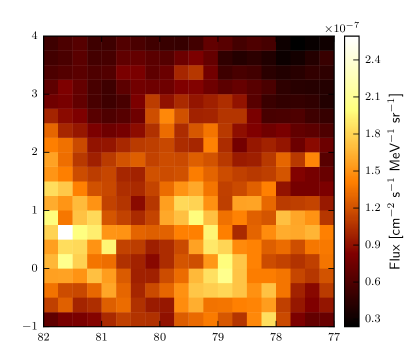
The diffuse -ray and neutrino fluxes from pion decay in Cygnus X primarily depend on the density of interstellar protons, , and the energy density in cosmic rays, . Our model assumes that the cosmic ray spectrum observed at the Sun [see Eq. (1)] pervades Cygnus X. Given , the -ray and high-energy neutrino fluxes could be accurately derived from the distribution of gas in three dimensions, information that is not available. We, therefore, approximate the interstellar gas in Cygnus X by determining the column density of protons, in 0.0625 deg2 pixels; see Fig. 1. Our single-zone YEGZ models are then applied to each pixel; see Fig. 2.
Note that while the pion and -ray source functions, and , are sensitive to the physical depth of the gas column because of their dependence on the average gas density, , the -ray flux is independent of the assumed depth. Instead, the -ray flux (from neutral pion decay and bremsstrahlung) depends on the column density and the assumed angular size of the pixels as
| (16) |
where kpc is the distance to Cygnus X, pc is the length of the side of each 0.25 deg 0.25 deg pixel, and pc is the assumed depth of the region which is equal to an angular diameter of 5 deg at the assumed distance.
Measurements of are subject to a number of uncertainties. For this calculation, we derive in the neutral and molecular interstellar media from optical depth maps obtained by the Planck collaboration. We use this information in the form of estimates of the interstellar extinction color excess that depends on the optical depth and, thus, column density of interstellar dust. Following (Draine, 2011), we assume a uniform ratio of dust-to-gas and adopt cm-2. We used this ratio to convert the Planck maps to a mean map for each deg2 pixel in the Cygnus X region; see Fig. 1. Our value for is a compromise that is 1 higher than the Planck Galactic mean value. The Planck mean value, however, does not include “dark” molecular gas, i.e. molecular gas not detected via microwave emission from CO, and therefore is a lower limit to the true ratio.
The distribution of photoionized gas is derived from thermal radio emission maps in (Xu et al., 2013). These were placed on our pixel grid via a simple visual estimation from the published figures; see Fig. 1. We converted the observed thermal brightness temperatures to an emission measure following standard techniques. The mean density of ionized gas was found by assuming the HII gas is distributed over a depth of pc in Cygnus X with a gas filling factor of . This approach is adequate as the ionized gas has only a small affect on the results from our model.
Cosmic ray interactions with the radiation fields within Cygnus X also contribute to the production of diffuse -rays. The energy density from thermal emission by interstellar dust grains in the far infrared spectral region, , is estimated from the 100 m intensity maps obtained with IRAS. The intensity observed in each pixel was converted to a mean energy density by adopting a uniform radiation temperature of 25 K in combination with the modified black body radiator model in (Casey, 2012); see Fig. 1.
The distribution of direct radiation from the Cygnus OB2 stellar association was calculated assuming a stellar population with stellar ages of Myr and a stellar mass of from (Wright et al., 2015). Our luminosity estimate for Cyg OB2, , comes from STARBURST99 models relating the ages and masses of stellar populations to total luminosities. We assume that this source is a blackbody, with K, whose flux follows an inverse square law. This leads to an overestimate of in regions such as Cygnus X with significant levels of dust absorption; however, our models show that even the unattenuated stellar radiation field is not an important source for -rays from inverse Compton.
III Results
III.1 Diffuse Interstellar Emission
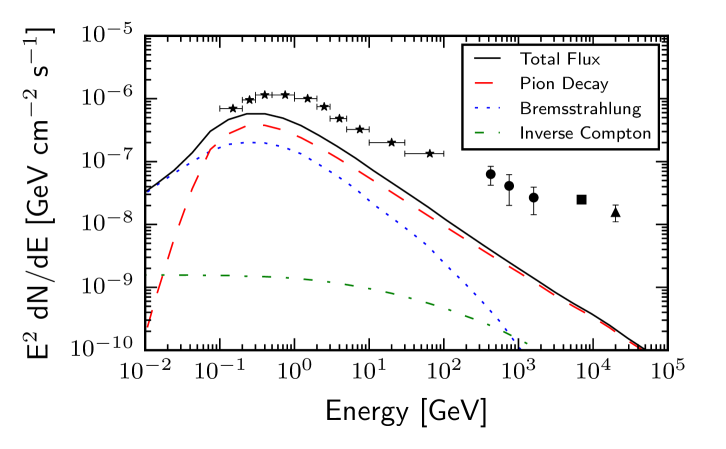
To model the soft, diffuse interstellar -ray emission in the Cygnus region, we apply the single-zone YEGZ models, using the theoretical framework outlined above and in (Yoast-Hull et al., 2013, 2014, 2015), to each pixel in the maps in Fig. 1. Summing the fluxes from each pixel, we find that at the lowest energies ( GeV) the -ray spectrum is dominated by the flux from bremsstrahlung. Contributions from neutral pion decay become competitive above GeV and dominate entirely by – GeV, see Fig. 2(a). -ray emission from inverse Compton is negligible due to the steepness of the cosmic ray electron spectrum at higher energies.
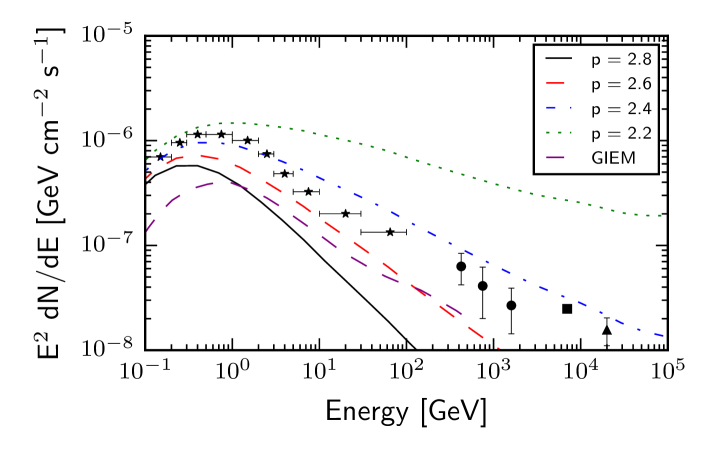
In addition to assuming a steep () local cosmic ray spectrum, we test cosmic ray spectra with harder spectral indices; see Fig. 2(b). By varying the second exponent in Eq. (1) from -3.93 to -3.73, -3.53, and -3.33, we test cosmic ray spectra with indices of , respectively. None of the spectral shapes match well to the observed -ray spectrum, indicating additional sources of emission as expected, and for the harder spectra (), we overestimate the observed -ray flux entirely.
To compare our YEGZ models to the GIEM adopted by the LAT Collaboration, we downloaded the most recent version available for use with the LAT Pass 8 data, gll_iem_v06.fits. The GIEM templates for interstellar gas are derived from spectral line surveys of HI and CO, with corrections for neutral gas and optical depth effects from infrared observations (Ackermann et al., 2012b). These templates are used to calculate -ray emission from neutral pion decay and bremsstrahlung. In combination with a calculation of the inverse Compton emission from GALPROP simulations, the combined templates are fit to the LAT data in each of 14 logarithmically spaced energy bins from 50 MeV to 50 GeV; for further details, see (Acero et al., 2016).
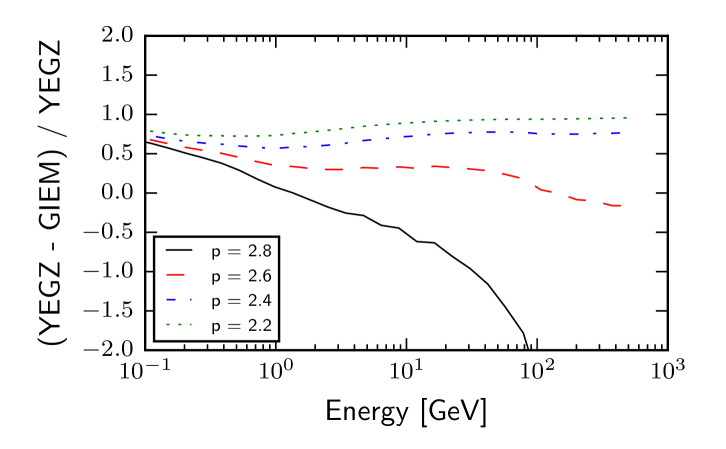
Considering the energy spectra of the different models, we find that the GIEM presents a harder spectrum than our baseline () YEGZ model and has a spectral index closer to . This can be seen in Fig. 2(c), where we plot the differences between the YEGZ models and the GIEM. The residuals for the GIEM versus of model with is relatively flat and lies the closest to the zero mark. In contrast, the residuals for increase with energy and the residuals for steeply decline with energy.
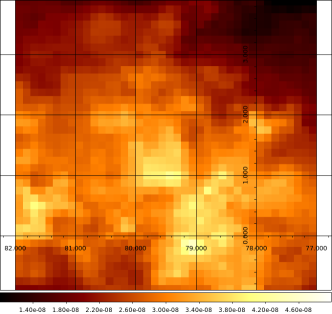
In addition to looking at the energy spectra, we also extracted maps of the total -ray emission at GeV from both our baseline () YEGZ model and the GIEM for comparison; see Fig. 3. After converting to the same units, we find reasonable agreement of the structures in the -ray emission between the maps. Further, differences in resolution between the two models account for the larger dynamical range in the total flux in our YEGZ model.
Having established that our YEGZ models for soft, diffuse emission in Cygnus X are in rough agreement with the GIEM, and, thus, Fermi observations, we then calculated the associated neutrino spectrum for the models with spectral indices of . The resulting flux is well below the IceCube sensitivity limits for extended sources at 1 PeV (Aartsen et al., 2014, b).
III.2 The Cygnus Cocoon
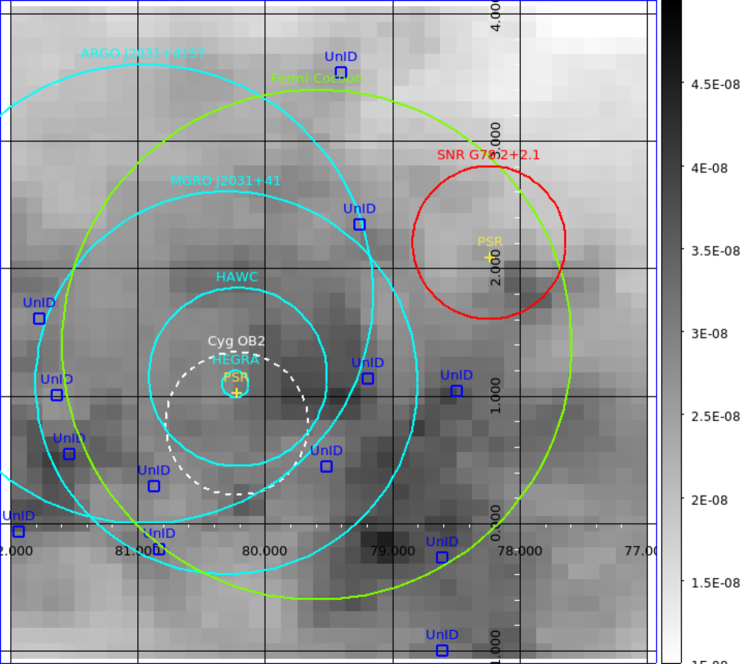
In (Ackermann et al., 2012a), only 11 individual sources were identified in the Cygnus region. Looking at the third Fermi LAT source catalog (3FGL), there are now 24 sources identified within a radius of the center of Cygnus X. These sources include 4 pulsars (PSR), 2 active galactic nuclei (AGN),and 1 SNR with an additional point sources with a potential association with a SNR or PWN, and 16 unassociated (UnID) point sources; see Fig. 4. To be able to compare our YEGZ models with Fermi -ray data for the Cygnus region, we must include these sources from the 3FGL, along with the Cygnus Cocoon and the isotropic -ray background.
We compare the combined -ray spectrum for Cygnus X with observations from Fermi, ARGO-YBJ, HAWC, and Milagro; see Figs. 4 and 5(a). The spectral fits provided in the 3FGL are only valid between 100 MeV and 300 GeV. However, for the Cocoon, we extrapolated with spectral fit to higher energies to compare with TeV energy -ray observations. For the pulsars, we include only the off-pulse emission for the 3 brightest pulsars (J2021+3651, J2021+4026, J2032+4127). The isotropic -ray background is taken from the LAT background model P8R2_SOURCE_V6.
Each of the -ray data points included in Fig. 5(a) were initially given in units of GeV cm-2 s-1 sr-1. We scaled the Fermi (Ackermann et al., 2012a) and ARGO-YBJ (Bartoli et al., 2015) data down to a region of as these observations covered a larger region and the emission outside our selected region is largely negligible. For the Milagro observations (Abdo et al., 2007b), the data originally covered a region with a radius of ; see Fig. 4, and we scaled the data to a region covering in radius, equivalent to a box of . For the HAWC observations (Abeysekara et al., ), we scaled the data point to a region covering in radius as their data originally covered a region of only in radius.
Combining the -ray spectrum for the Cocoon, extrapolated to TeV energies, with our modeled diffuse emission and the -ray spectra for point sources in the region gives a total -ray spectrum that is in agreement with both the GeV and TeV energy -ray data; see Fig. 5(a). While we find only rough agreement between our model and the Fermi data, we find agreement between our model and nearly all available data. This agreement between the models and observations will allow us to use the existing Cocoon spectrum to model further hard neutrino emission from the Cygnus region.
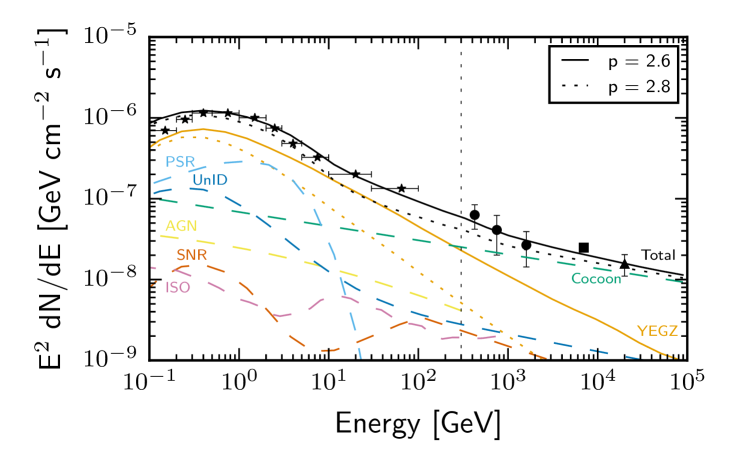
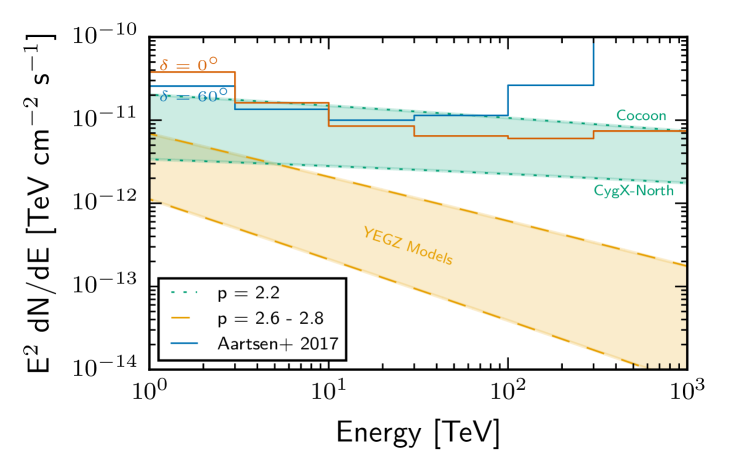
To calculate an upper limit on the potential neutrino emission from the Cocoon, we assume that the Cocoon is a single source and is dominated by -rays from neutral pion decay. Using our single-zone YEGZ interaction model (Yoast-Hull et al., 2013), we approximate the spectrum of cosmic-ray protons necessary to reproduce the observed -ray spectrum. Assuming there is no steepening of the cosmic-ray proton spectrum at higher energies, we find that the neutrino flux () at 1 PeV is a just above the differential discovery potential point sources for IceCube, based on 7 years of data (Aartsen et al., 2017); see Fig. 5(b). As the discovery potential for extended sources should be at least a factor of a few lower (see Fig. 8.1 in (Aartsen et al., b)), the possibility of detecting the Cocoon is even greater, provided the cosmic ray spectrum is hadronic and extends to PeV energies.
It is likely that several different accelerators and interaction processes produce the hard emission that has been designated the Cocoon, and it is unclear whether the total -ray emission from the Cocoon is dominated by hadronic processes. As such, we also consider a smaller portion of the Cocoon coincident with a large molecular gas cloud complex which is most likely to be dominated by hadronic emission and could potentially be due to a single, hidden accelerator (a SNR or a PWN). The region we consider is in CygX-North centered on which is to the left of Cyg OB2; see Fig. 7 in (Schneider et al., 2006).
Again, using our single-zone YEGZ model (Yoast-Hull et al., 2013), we match a cosmic-ray proton spectrum to the -ray spectrum for this subregion given in the supplementary materials of (Ackermann et al., 2011); see Fig. S6. We find that the neutrino flux at 1 PeV is a factor of below IceCube’s differential discovery potential (Aartsen et al., 2017); see Fig. 5(b). This indicates that CygX-North is unlikely to be detected by IceCube as a point source and the possibility of being detected as an extended source is slim.
IV Summary & Discussion
In applying our semianalytic YEGZ model to the Cygnus X region, we sought to minimize free parameters. We calculated the spectra for diffuse -ray and neutrino emission by assuming a local cosmic ray spectrum with spectral indices between and by deriving spatial maps for the gas column density and infrared radiation fields from observations by Planck and IRAS. Checking our YEGZ model for the soft, diffuse cosmic ray population against the GIEM adopted by the LAT Collaboration, we find rough agreement of the flux map and the spectral energy distribution; see Figs. 1 and 2.
When combining the -rays resulting from the soft, diffuse cosmic ray population with the -ray spectra for both point sources and the Cocoon (extended to TeV energies), the total spectrum agrees with observations by Fermi, ARGO-YBJ, HAWC, and Milagro. Based on this agreement between the various cosmic ray populations at TeV energies, we use the -ray emission from the Cocoon to derive a corresponding cosmic-ray proton population (assuming only hadronic emission) and extend the population to PeV energies to calculate an upper limit on the neutrino flux.
While neutrino emission from the diffuse, soft cosmic ray population acting alone in Cygnus X results in neutrino fluxes several orders of magnitude below the current IceCube sensitivity limits, the neutrino flux from a hard cosmic ray population equivalent to that required for the Cocoon results in a flux that is potentially detectable by IceCube. We also calculated the neutrino emission from the subregion CygX-North within the Cocoon maps which directly onto a particularly dense molecular cloud complex and found that the corresponding flux is a factor of below the current discovery potential for point sources.
The Cygnus X region is complex, and the origin of the hard -ray emission component associated with the Cocoon remains unclear. Currently Cygnus X has not been reported as a detection by IceCube. However, if the Cocoon is hadronic and extends to PeV energies with a flat spectrum, then eventual detection of high-energy from the Cocoon is possible with IceCube. A detection of high-energy neutrinos from Cygnus X would provide important clues to the origin of the Cocoon -ray emission and would cleanly establish the presence of a thus far undetected PeV energy hadronic accelerator in this part of the Galaxy.
Acknowledgements.
We thank the referee for their valuable comments and Dr. Cristina Popescu for providing her model stellar radiation field for Cygnus X that provided a check on our assumptions. This research has made use of the NASA/IPAC Infrared Science Archive, which is operated by the Jet Propulsion Laboratory, California Institute of Technology, under contract with the National Aeronautics and Space Administration. This research was supported in part by the U.S. National Science Foundation under Grants No. AST-0907837, No. ANT-0937462, and No. PHY-1306958 and by the University of Wisconsin Research Committee with funds granted by the Wisconsin Alumni Research Foundation.References
- Aartsen et al. (2014) M. G. Aartsen et al. (IceCube Collaboration), Astrophys. J. 796, 109 (2014).
- Aartsen et al. (2016) M. G. Aartsen et al. (IceCube Collaboration), Astrophys. J. 833, 3 (2016).
- Aartsen et al. (a) M. G. Aartsen et al. (IceCube Collaboration), arXiv:1701.03731 .
- Halzen et al. (2008) F. Halzen, A. Kappes, and A. Ó Murchadha, Phys. Rev. D 78, 063004 (2008).
- Halzen et al. (2017) F. Halzen, A. Kheirandish, and V. Niro, Astropart. Phys. 86, 46 (2017).
- Ackermann et al. (2011) M. Ackermann et al. (Fermi-LAT Collaboration), Science 334, 1103 (2011).
- Aharonian et al. (2002) F. Aharonian et al. (HEGRA Collaboration), Astron. Astrophys. 393, L37 (2002).
- Anchordoqui et al. (2009) L. A. Anchordoqui, H. Goldberg, R. D. Moore, S. Palomares-Ruiz, D. F. Torres, and T. J. Weiler, Phys. Rev. D 80, 103004 (2009).
- Grenier et al. (2013) I. A. Grenier, L. Tibaldo, and Fermi-LAT Collaboration, in American Institute of Physics Conference Series, American Institute of Physics Conference Series, Vol. 1516, edited by J. F. Ormes (AIP, College Park, MD, 2013) p. 250.
- Tchernin et al. (2013) C. Tchernin, J. A. Aguilar, A. Neronov, and T. Montaruli, Astron. Astrophys. 560, A67 (2013).
- Gonzalez-Garcia et al. (2014) M. C. Gonzalez-Garcia, F. Halzen, and V. Niro, Astropart. Phys. 57, 39 (2014).
- Aartsen et al. (2015) M. G. Aartsen et al. (IceCube Collaboration), Phys. Rev. Lett. 115, 081102 (2015).
- Nierstenhöfer et al. (2015) N. Nierstenhöfer, P. Graeser, F. Schuppan, and J. Tjus, J. Phys. Conf. Ser. 632, 012019 (2015).
- Baars and Wendker (1981) J. W. M. Baars and H. J. Wendker, Astron. Astrophys. 101, 39 (1981).
- Leung and Thaddeus (1992) H. O. Leung and P. Thaddeus, Astrophys. J. Suppl. Ser. 81, 267 (1992).
- Kiminki et al. (2015) D. C. Kiminki, H. A. Kobulnicky, C. A. Vargas Álvarez, M. J. Alexander, and M. J. Lundquist, Astrophys. J. 811, 85 (2015).
- Gottschalk et al. (2012) M. Gottschalk, R. Kothes, H. E. Matthews, T. L. Landecker, and W. R. F. Dent, Astron. Astrophys. 541, A79 (2012).
- Schneider et al. (2016) N. Schneider, S. Bontemps, F. Motte, A. Blazere, P. André, L. D. Anderson, D. Arzoumanian, F. Comerón, P. Didelon, J. Di Francesco, et al., Astron. Astrophys. 591, A40 (2016).
- Wright et al. (2015) N. J. Wright, J. E. Drew, and M. Mohr-Smith, Mon. Not. R. Astron. Soc. 449, 741 (2015).
- Chen et al. (1996) W. Chen, R. L. White, and D. Bertsch, Astron. Astrophys. Suppl. Ser. 120, 423 (1996).
- Mori et al. (1997) M. Mori, D. L. Bertsch, B. L. Dingus, J. A. Esposito, C. E. Fichtel, S. D. Hunter, G. Kanbach, D. A. Kniffen, Y. C. Lin, J. R. Mattox, et al., Astrophys. J. 476, 842 (1997).
- Abdo et al. (2007a) A. A. Abdo et al. (Milagro Collaboration), Astron. J. Lett. 658, L33 (2007a).
- Albert et al. (2008) J. Albert et al. (MAGIC Collaboration), Astrophys. J. Lett. 675, L25 (2008).
- Ackermann et al. (2012a) M. Ackermann et al. (Fermi-LAT Collaboration), Astron. Astrophys. 538, A71 (2012a).
- Bartoli et al. (2014) B. Bartoli et al. (ARGO-YBJ Collaboration), Astrophys. J. 790, 152 (2014).
- Aliu et al. (2014) E. Aliu et al. (VERITAS Collaboration), Astrophys. J. 788, 78 (2014).
- (27) A. Popkow (VERITAS Collaboration), in Proc. Sci., ICRC2015, 750, arXiv:1508.06684 .
- Comerón et al. (2016) F. Comerón, A. A. Djupvik, N. Schneider, and A. Pasquali, Astron. Astrophys. 586, A46 (2016).
- Vos and Potgieter (2015) E. E. Vos and M. S. Potgieter, Astrophys. J. 815, 119 (2015).
- Potgieter et al. (2015) M. S. Potgieter, E. E. Vos, R. Munini, M. Boezio, and V. Di Felice, Astrophys. J. 810, 141 (2015).
- Schneider et al. (2006) N. Schneider, S. Bontemps, R. Simon, H. Jakob, F. Motte, M. Miller, C. Kramer, and J. Stutzki, Astron. Astrophys. 458, 855 (2006).
- Kelner et al. (2006) S. R. Kelner, F. A. Aharonian, and V. V. Bugayov, Phys. Rev. D 74, 034018 (2006).
- Dermer (1986) C. D. Dermer, Astrophys. J. 307, 47 (1986).
- Murphy et al. (1987) R. J. Murphy, C. D. Dermer, and R. Ramaty, Astrophys. J. Suppl. Ser. 63, 721 (1987).
- Jones (1963) F. C. Jones, J. Geophys. Res. 68, 4399 (1963).
- Ramaty and Lingenfelter (1966) R. Ramaty and R. E. Lingenfelter, J. Geophys. Res. 71, 3687 (1966).
- Ginzburg (1969) V. L. Ginzburg, Elementary Processes for Cosmic Ray Astrophysics (Gordon and Breach, New York, 1969).
- Schlickeiser (2002) R. Schlickeiser, Cosmic Ray Astrophysics (Springer, Berlin, 2002).
- Yoast-Hull et al. (2013) T. M. Yoast-Hull, J. E. Everett, J. S. Gallagher, and E. G. Zweibel, Astrophys. J. 768, 53 (2013).
- Ferrière (2001) K. M. Ferrière, Rev. Mod. Phys. 73, 1031 (2001).
- Stecker (1971) F. W. Stecker, Cosmic Gamma Rays, SP-249 (NASA Special Publication, Baltimore, 1971).
- Blumenthal and Gould (1970) G. R. Blumenthal and R. J. Gould, Rev. Mod. Phys. 42, 237 (1970).
- Dermer and Menon (2009) C. D. Dermer and G. Menon, High Energy Radiation from Black Holes (Princeton University Press, Princeton, NJ, 2009).
- Casey (2012) C. M. Casey, Mon. Not. R. Astron. Soc. 425, 3094 (2012).
- Draine (2011) B. T. Draine, Physics of the Interstellar and Intergalactic Medium (Princeton University Press, Princeton, NJ, 2011).
- Xu et al. (2013) W. F. Xu, X. Y. Gao, J. L. Han, and F. S. Liu, Astron. Astrophys. 559, A81 (2013).
- Bartoli et al. (2015) B. Bartoli et al. (ARGO-YBJ Collaboration), Astrophys. J. 806, 20 (2015).
- (48) A. U. Abeysekara et al. (HAWC Collaboration), arXiv:1702.02992 .
- Abdo et al. (2007b) A. A. Abdo et al. (Milagro Collaboration), Astron. J. Lett. 664, L91 (2007b).
- Yoast-Hull et al. (2014) T. M. Yoast-Hull, J. S. Gallagher, and E. G. Zweibel, Astrophys. J. 790, 86 (2014).
- Yoast-Hull et al. (2015) T. M. Yoast-Hull, J. S. Gallagher, and E. G. Zweibel, Mon. Not. R. Astron. Soc. 453, 222 (2015).
- Ackermann et al. (2012b) M. Ackermann et al. (Fermi-LAT Collaboration), Astrophys. J. 750, 3 (2012b).
- Acero et al. (2016) F. Acero et al. (Fermi-LAT Collaboration), Astrophys. J. Suppl. Ser. 223, 26 (2016).
- Aartsen et al. (b) M. G. Aartsen et al. (IceCube Collaboration), arXiv:1510.05222 .
- Aartsen et al. (2017) M. G. Aartsen et al. (IceCube Collaboration), Astrophys. J. 835, 151 (2017).