Field dependence of the magnetic correlations of the frustrated magnet SrDy2O4
Abstract
The frustrated magnet SrDy2O4 exhibits a field-induced phase with a magnetization plateau at of the saturation value for magnetic fields applied along the -axis. We report here a neutron scattering study of the nature and symmetry of the magnetic order in this field-induced phase. Below K, there are strong hysteretic effects, and the order is short or long ranged for zero-field and field cooling, respectively. We find that the long-range ordered magnetic structure within the zig-zag chains is identical to that expected for the one-dimensional axial next-nearest neighbour Ising (ANNNI) model in longitudinal fields. The long-range ordered structure in field contrasts with the short-range order found at zero field, and is probably reached through enhanced quantum fluctuations with increasing fields.
pacs:
75.25.-j, 75.10.Pq, 75.47.Lx, 75.60.-dI Introduction
In frustrated magnets with competing interactions, phases with different magnetic order can have a similar energy. As a result, small perturbations can strongly affect the magnetic properties, and strong hysteretic effects can occur. In particular, an applied magnetic field can act as a tuning parameter between different states. Therefore, frustrated magnets often exhibit complex field-dependent phase diagrams. The field-induced phases can reveal themselves as plateaux in the field-dependent magnetization and they give rise to strong correlations and unusual properties. For example in the prototypical spin ice Dy2Ti2O7, a magnetization plateau is observed for fields applied along . The ground state related to this plateau is called Kagomé ice and has a macroscopic degeneracy.Matsuhira et al. (2002); Gardner et al. (2010)
Magnetization plateaux have been observed in SrDy2O4, SrHo2O4 and SrEr2O4, which are part of the SrR2O4 (R = rare earth) family of frustrated magnets.J. Hayes et al. (2012) In many members of this family, the magnetism is dominated by magnetic ions forming zig-zag chains along the -axis.Hayes et al. (2011); Quintero-Castro et al. (2012); Fennell et al. (2014); Wen et al. (2015) There are two crystallographically inequivalent zig-zag chains present, and these have different moment anisotropies.Petrenko (2014); Fennell et al. (2014); Malkin et al. (2015) The zig-zag chains can be modelled by the one-dimensional (1D) axial next-nearest-neighbour Ising (ANNNI) model with exchange interactions and , corresponding to the nearest and next-nearest neighbour interactions, respectively.Selke (1988) For the case where both and are antiferromagnetic, this model predicts the existence of a magnetization plateau in longitudinal field at of the saturation value that corresponds to an ordering along the chain.Oguchi (1965); Morita and Horiguchi (1972); Rujan et al. (1983)
In SrDy2O4, a plateau at is observed for fields applied along the -axis suggesting the existence of the state. At K, this plateau extends from T to T. J. Hayes et al. (2012) Specific heat and ultrasound measurements confirm a field-induced phase between these critical fields.Cheffings et al. (2013); Bidaud et al. (2016) This field-induced order contrasts with absence of long range order down to mK in zero field.Fennell et al. (2014); Gauthier et al. (2017a) The presence of only short range correlations at the lowest temperatures in zero field has been justified by the trapping of slowly decaying defects due to a dimensionality crossover.Gauthier et al. (2017b) We report here a detailed characterization of the field-induced order by single crystal neutron diffraction. Our measurements reveal the presence of strong hysteretic effects and the existence of a three-dimensional (3D) long range order with a spin order along the chains. At fields higher than the plateau phase, a partial ferromagnetic state exists where the chains in longitudinal fields are fully polarized.
II Experimental details
SrDy2O4 single crystals were prepared as described previously.Balakrishnan et al. (2009); Gauthier et al. (2017b) Magnetic order as function of magnetic field was measured on the TriCS single crystal neutron diffractometer, SINQ at the Paul Scherrer Institut. The sample used for the determination of the magnetic structure had an ellipsoid shape in order to reduce the anisotropy of neutron absorption, while the remaining samples had the shape of a rectangular prism. The samples were aligned in the plane and inserted into a dilution refrigerator in a 6 T vertical magnet, with the field along the -axis. For the determination of the field-induced magnetic structure on TriCS, datasets were collected using two different neutron wavelengths, which is strongly affected by neutron absorption due to Dy, and with smaller absorption effects. For , the limited out-of-plane resolution lead to peak overlap along the direction. Scans were measured along to evaluate this overlap and correct for it. Both datasets were corrected for absorption, which was estimated through a finite element analysis based on the sample geometry. The same conclusions are reached from the datasets of both neutron wavelengths. The field-induced phase diagram was also investigated using the DMC neutron diffractometer at SINQ. Several single crystals were coaligned in the bc plane and fixed with Araldite glue on a silicon plate mounted on a copper holder. The sample was inserted in a dilution refrigerator in a 2 T horizontal magnet, with the field along the -axis. Measurements were carried out using a neutron wavelength Å.
DC susceptibility measurements were done in a Quantum Design MPMS equipped with an iHelium 3He option. The sample with dimensions mm3 was measured at K with the field applied along the -axis. The measurements were corrected for demagnetization with the demagnetization factor , calculated from the sample dimensions using the equations for a rectangular prism.Aharoni (1998)
III Experimental results
III.1 Field-induced magnetic order
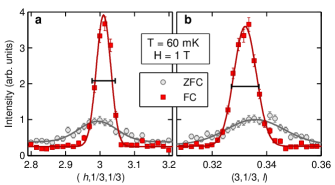
The magnetic field-induced order corresponding to the magnetization plateau for fields along the -axis in SrDy2O4 was investigated by single crystal neutron diffraction measurements. The previous studies of this field-induced order, by specific heat and ultrasound measurements,Cheffings et al. (2013); Bidaud et al. (2016) could not establish whether the order has short or long range correlations. Neutron scattering can quantify the correlation length from the widths of the Bragg peaks and we show here that the system reaches a short range order in zero-field cooling (ZFC) conditions and a long range order in field-cooled (FC) conditions. Scans along and of the magnetic Bragg peak illustrate narrow peaks for FC conditions and broad ones for ZFC conditions (Fig. 1). The widths of the magnetic Bragg peaks in FC conditions are similar to the instrumental resolution estimated from the nuclear Bragg peak measured out of the field-induced order ( K and T). This indicates that they are resolution limited and that FC conditions establishes a long range field-induced order.
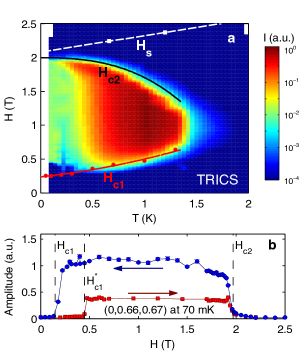
A phase diagram of the field-induced order was created from the neutron scattering amplitude at , as shown in Fig. 2(a). The data collection was performed with the TriCS diffractometer by increasing the field at various temperatures starting from ZFC conditions. The boundaries of this phase, indicated by the lower critical field Hc1 and the upper critical field , are in good agreement with specific heat and ultrasound measurements.Cheffings et al. (2013); Bidaud et al. (2016) Strong hysteretic effects appear below K and will be described in details in section III.2.
The field-induced long range order has two types of magnetic scattering: a ferromagnetic contribution at the nuclear Bragg peak positions, described by a propagation vector and an antiferromagnetic contribution described by a commensurate propagation vector . The magnetic structure is described by a multi-k structure with both propagation vectors and , and is illustrated in Fig. 3. The dataset for this structure determination was collected at K and T in FC conditions using . In FC conditions, the propagation vector is temperature independent, and the magnetic Bragg peak amplitudes are field independent at K. This indicates that there is no change of the magnetic structure within the long range ordered phase.
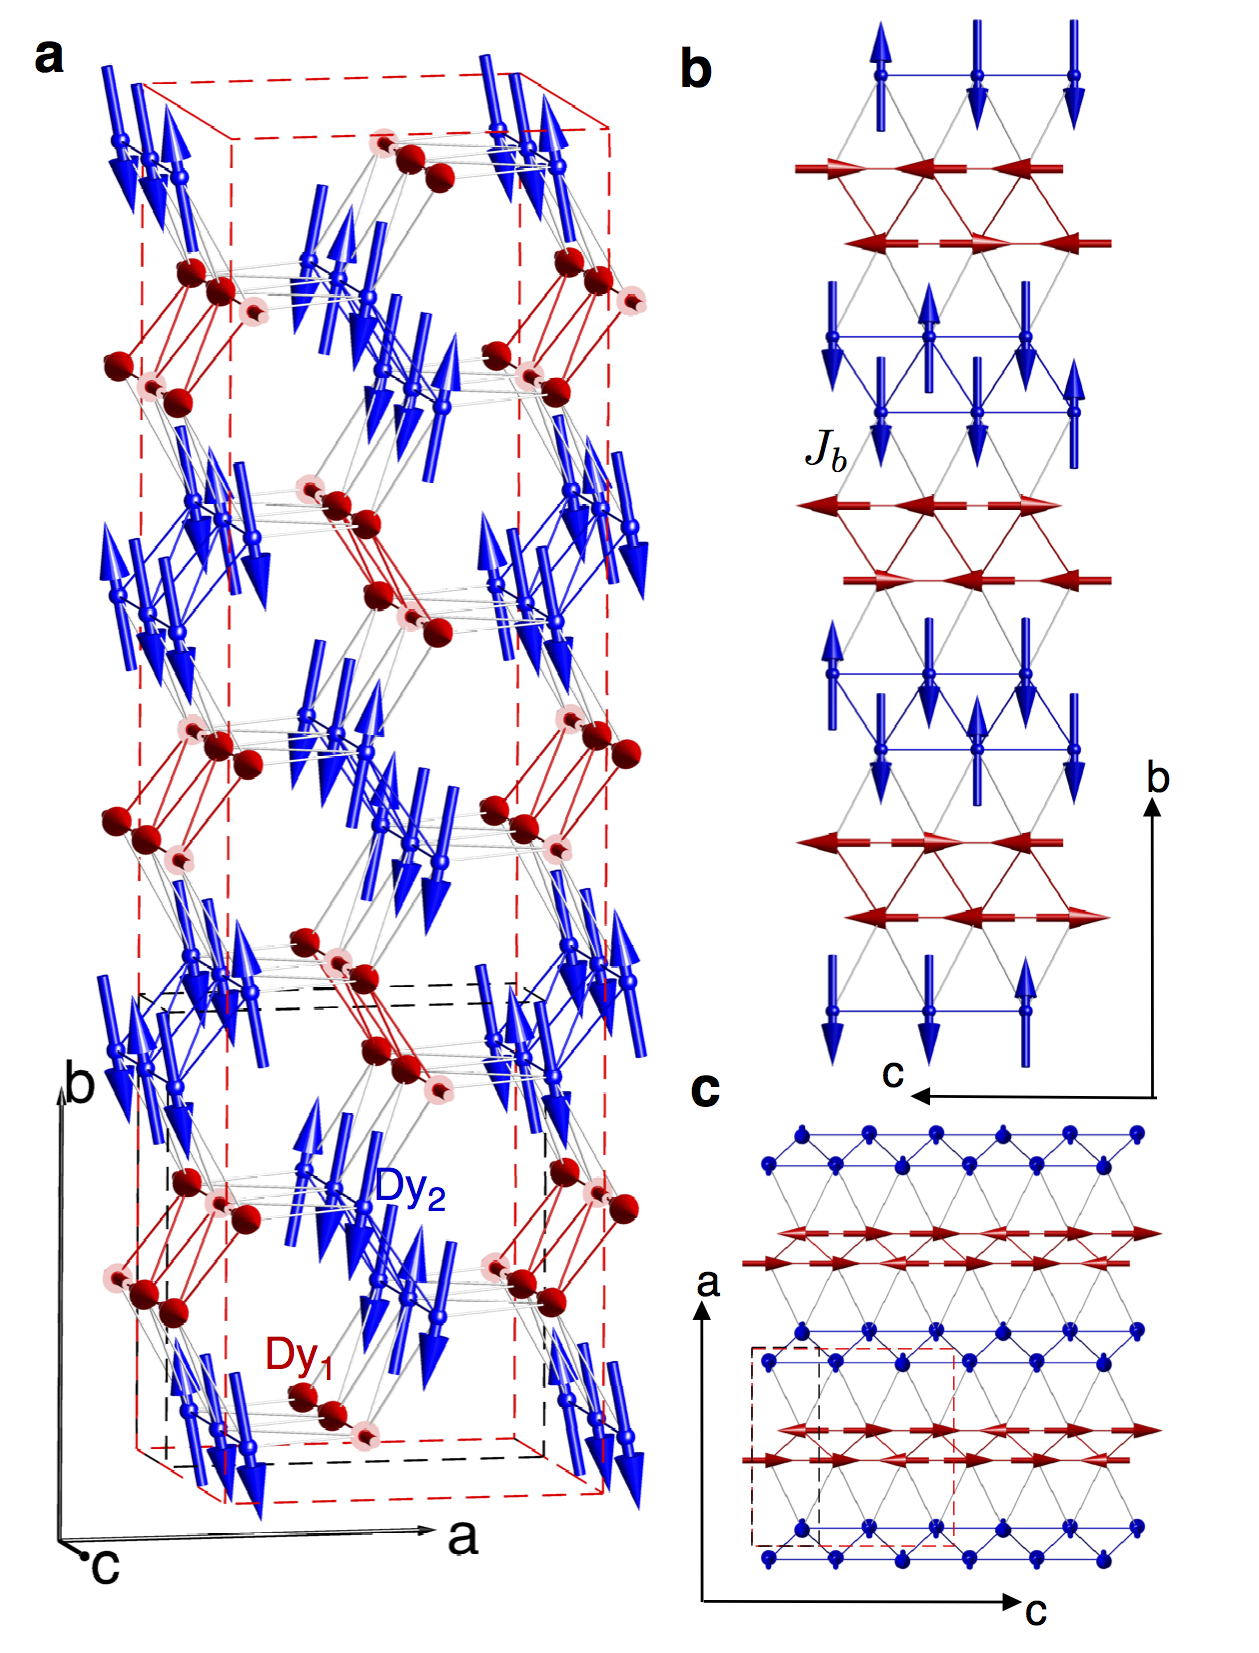
The magnetic structure presented in Fig. 3 was determined using two basic assumptions. The first assumption is that the moments are aligned along the easy axes determined previously.Gauthier et al. (2017b) There are two crystallographically inequivalent magnetic ion sites in the structure of SrDy2O4. We refer to them as site 1 and site 2 and they are shown in Fig. 3 in red and blue, respectively. Our previous work has shown that site 2 has an easy-axis near the -axis and site 1 has a weak anisotropy in the plane, with a favorable alignment along the -axis.Gauthier et al. (2017b) For the following, the moment on site 1 is considered to point along the -axis and a component along the -axis is discussed later. The second assumption used for the magnetic structure determination is that all the moments on site 1 have the same size, as do all the moments on site 2. The first assumption implies that the structure defined by the propagation vector is amplitude modulated. The second assumption requires the use of both propagation vectors and restricts the phase factor of the structure such that for every two sites with magnetic moments of there is one site with magnetization . Adding a ferromagnetic component of from the structure then generates equal moment sizes of for all sites. With these restrictions, the parameters of the and structures are highly dependent.
The scattering corresponding to combines magnetic and nuclear contributions, so the accuracy of the refinement of the ferromagnetic component is limited. The related parameters were therefore determined from the refinement of the structure. A crystal structure refinement was performed using nuclear Bragg peaks collected at K and T () and the obtained scaling factor was used to determine absolute moment sizes. The presence of two domains ( and ) with unequal populations was also taken into account to obtain the correct scaling between the nuclear and magnetic phases.
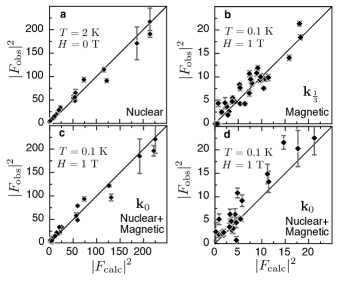
The representation analysis for the propagation vector using BasIreps Rodríguez-Carvajal (1993) shows that each inequivalent site splits into two orbits with two possible 1D irreducible representations, presented in Table 1. While satisfying the two assumptions presented above, only the representation can generate a non-zero magnetic moment along the -axis, as required by the magnetization measurements. The best agreement with the measurements is obtained with the state on both inequivalent sites with moments pointing along their respective easy axis. The detailed structure is shown in Fig. 3. The refined magnetic moments are 3.3(7) along the -axis for site 1 illustrated in red and 8.4(6) nearly along the -axis for site 2 illustrated in blue. The corresponding values and are of the same order as the value obtained by refining the nuclear structure. A comparison of the calculated and observed structure factor for these three refinements is presented on Fig. 4. A refinement using the representation instead of leads to a worse agreement with the observed intensities.
Even though a weak anisotropy in the plane was suggested for site 1, magnetic correlations of moments along the -axis were not observed experimentally.Gauthier et al. (2017b) This is also the case for the field-induced magnetic structure presented here: the presence of a component along the -axis does not improve significantly the value and in that case its size is negligible compared to the component along the -axis.
The magnetic order on site 1 for a single domain leads to a finite magnetization along the -axis for magnetic fields applied along the -axis. This net magnetization component originating from site 1 is surprisingly transverse to the applied field. The second domain described by creates a transverse magnetization in the opposite direction. In our measurements, these domains appeared in a 1:2 ratio. Due to this unequal domain population, that should create a net magnetization transverse to the direction of the applied magnetic field. Transverse magnetization measurements are needed to directly confirm this prediction. The next best solution with a larger features magnetic order on the site 1 chain with a pattern without finite transverse magnetization and with the arrangement on site 2.
III.2 Hysteresis of the field-induced phase
The magnetic correlations show very strong hysteretic effect, which we studied using the magnetic Bragg peak measured at T with four different histories (Fig. 5): (1) zero-field cooled on warming (ZFCW), (2) field cooled on cooling (FCC), (3) field cooled on warming (FCW) and (4) field-cooled in the ferromagnetic phase (FFC). The detailed trajectories in the phase diagram are shown in Fig. 5(d). The positions and and the full-widths at half maximum (FWHM) and were determined by fitting a Gaussian function to the scattering along and , respectively. The correlation length is defined by where is the FWHM of the measured scattering and is the FWHM expected from the instrumental resolution.
The FCC and FCW conditions result in the longest correlation lengths and the peaks are resolution limited at mK, indicating correlation lengths along the -axis and along the -axis , as estimated from . In ZFCW conditions, the correlation lengths below K are significantly shorter, with and at mK [Fig. 5(b)-5(c)] and the position of the scattering maximum deviates from a commensurate value [Fig. 5(a)]. The significantly reduced peak intensity below K in the phase diagram of Fig. 2(a) is a consequence of larger peak widths due to the short range correlations. When the field-induced state is entered from the ferromagnetic state at K (FFC), the correlation lengths are longer than for ZFC but still shorter than for FCC conditions.
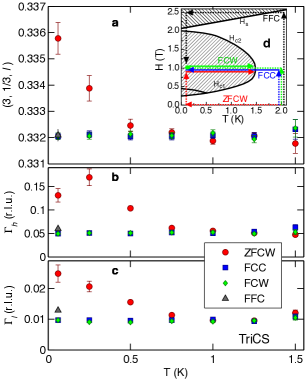
The temperature and field history also affects the phase boundaries at the lowest temperatures. At mK, the upper boundary is T and independent of the field history. The lower boundary is T for an increasing field and T for a decreasing field, as shown in Fig. 2(b). The lower boundary obtained for decreasing fields is illustrated on the phase diagram of Fig. 2(a) by red circles.
Neutron scattering maps of the reciprocal plane have been measured at mK after a zero-field cooling on the DMC neutron diffractometer and are shown on Fig. 6 for different fields up to a maximum field T, smaller than . In these conditions, measurements taken at T approaching from smaller or larger fields are indistinguishable and indicate that the system remained in the short range correlations regime throughout the measurements. The diffuse scattering near in zero field shifts in and in finite field and splits in two peaks reaching at T. This gradual evolution from the zero field short range order to the field-induced order suggests a gradual reordering of magnetic moments, possibly by individual spin flips.
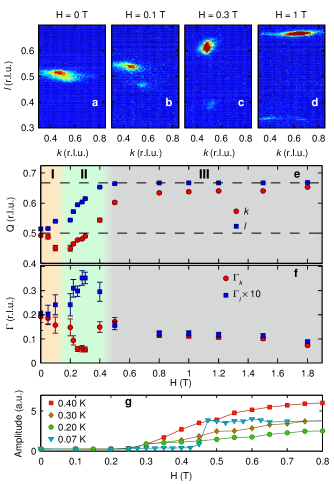
The peak positions Q and widths as function of applied magnetic field were obtained from the reciprocal plane maps with : the scattering has been integrated along one direction ( or ) and fitted by a Lorentzian function along the other direction. The fitted positions and and widths and are illustrated in Fig. 6(e)-6(f). Three different regimes have been identified from these results. Initially, the system reacts weakly to the applied fields up to T (regime I). As the applied field is increased above , the correlation length along the chains decreases, reaching a minimum at T, and for larger fields the tendency is reversed with an increasing (regime II). In this regime, the peak position changes continuously from to . Above T, is fixed at and the correlation lengths change very slowly with field (regime III). The three regimes are also observed in the correlation length transverse to the chain directions. The correlation length is weakly affected by the field in regimes I and III while it reaches a maximum in regime II. This suggests that the reduced correlation length along the chain in this regime favours correlations along the -axis by interchain interactions. The interchain interactions cause a different field dependence of the peak positions and . In regime I, the peak position first reduces to values smaller than , in contrast with . In regime II and III, it then converges towards .
In the ultrasound measurements for increasing fields, the transition at separates into three different transitions below K, which are at , 0.44 and 0.91 T at mK.Bidaud et al. (2016) The first transition observed at T corresponds to the observed minimum of in regime II. The second transition separates regimes II and III when the wavevector along the chain reaches a fixed value. A third transition is observed in ultrasound measurements at 0.91 T but no significant changes are apparent in our neutron scattering data around this field value and the nature of this transition is unknown.
These multiple regimes are only observed at very low temperatures in ultrasound measurements. In our neutron scattering results, this is evidenced indirectly in the field dependence of the scattering intensity at fixed shown on Fig. 6(g). At mK there is a sudden increase of intensity at T, consistent with the propagation vector approaching closely . In contrast, the magnetic scattering intensity at K and above appears at T and increase smoothly with field. This increase occurs close to the lower phase boundary measured in FC conditions at these temperatures and suggests a single transition.
III.3 Partially ferromagnetic phase
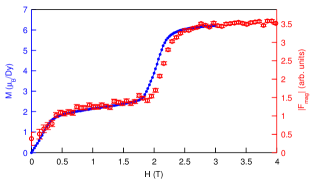
At magnetic fields greater than the saturation field , a partially ferromagnetic state is reached, in which all moments on site 2 are polarized along the field direction while the moments on site 1 only have a small component along the field. Magnetization for field applied along the -axis at K exhibit the expected plateau at and a second plateau at corresponding to the partially ferromagnetic phase, as shown on Fig. 7. The critical fields T and T of the phase were extracted from the maxima of after correction for the demagnetization effect. The saturation field T at K was obtained from the onset of the magnetization plateau , also after correction for the demagnetization effect. The plateaux at and are consistent with the neutron scattering intensity at that is sensitive to magnetization. The phase boundary of the partially ferromagnetic order is apparent from the significant increase of the scattering intensity at just below as shown on Fig. 8(a).
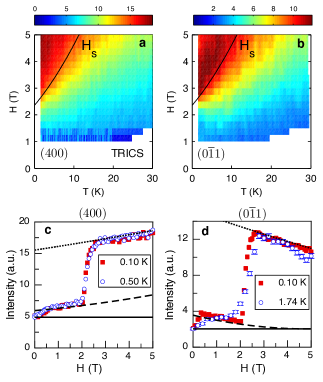
Interestingly, the scattering intensity at is decreasing in the plateau region and the partially ferromagnetic state [Fig. 8(d)]. This behaviour can be explained by a field-independent moment on site 2 and a small field-dependent contribution of the moments on site 1 along the -axis. The field-dependent magnetic structure factor at and was calculated for this scenario. It was assumed that site 1 has a linear susceptibility in the plateau region and in the partially ferromagnetic state. It was also assumed that the order in the field induced phase is the one determined previously, in addition to a weak component along the -axis on site 1 from the mentioned susceptibility. For the partially ferromagnetic phase, it was assumed that the site 2 is fully polarized along the -axis and that the moment on site 1 is . A global scaling factor, a constant background and the values were adjusted to obtain a reasonable description of the data. The susceptibilities were determined to be and . The calculated structure factors for the plateau and the partially ferromagnetic state are illustrated on Fig. 8(c)-8(d) by dashed and dotted lines respectively and are in good agreement with measurements.
IV Discussion
IV.1 Intra and interchain interactions
The compound SrDy2O4 in zero magnetic field is well described in first approximation by the 1D ANNNI model and the comparison of the diffuse scattering with the model gives estimated values of meV and meV on the zig-zag chains.Gauthier et al. (2017b) The 1D ANNNI model predicts the presence of the state for longitudinal fields with antiferromagnetic and .Oguchi (1965); Morita and Horiguchi (1972); Rujan et al. (1983) On the other hand, transverse fields should lead to quantum fluctuations and the state is not expected in that case.Chakrabarti et al. (1996) For fields applied along the -axis in SrDy2O4, the moments on site 1 experience a transverse field while the moments on site 2 experience a longitudinal field. Interestingly, the magnetic structure of the field-induced phase determined in section III.1 exhibit the state on both inequivalent sites. The ordering on site 1 is unexpected and most likely caused by interchain interactions. Quantum fluctuations due to the transverse field should destabilize the order on site 1 but its presence suggests that, either the weak anisotropy of site 1 weakens this effect, or the applied field is not sufficient to reach the vicinity of the quantum critical point. However, the increase of quantum fluctuations appears to be sufficient to reduce to strength of the trapping mechanism, leading to the absence of long range order in zero field,Gauthier et al. (2017b) and help attain a long range field-induced phase in FC conditions.
As discussed in our previous work,Gauthier et al. (2017b) the most likely interchain interactions are the dipolar interactions and the interaction , represented on Fig. 3(b), would be the dominant one. In the field-induced magnetic structure, five out of six bonds minimize the interaction energy. This suggests that the field induced state on site 2 forces the same state on site 1 through the dipolar interactions.
Assuming a negligible contribution from site 1, the intrachain interactions on site 2 can be estimated from the accurate experimental values of the critical fields, obtained from the magnetization corrected for demagnetization, and the moment size refined from neutron scattering. For a zig-zag chain having the double Néel ground state in zero field, the interactions are given by meV, meV, assuming the moment , corresponding to the component along the -axis on site 2. These values are in very good agreement with the ones estimated from the diffuse scattering in zero field.Gauthier et al. (2017b)
IV.2 Hysteresis and low temperature regimes
In order to understand the multiple regimes observed at low temperatures in ZFC conditions, we considered the 1D ANNNI model in longitudinal field. The Hamiltonian is:
| (1) |
This model can be solved exactly by the transfer matrix methodBhattacharyya and Dasgupta (1991) and the spin pair correlation function at large distances is given by:
| (2) |
where is the magnetization, is a scaling factor, is the correlation length and is the wavenumber.Alves Jr. and Yokoi (2000) The exact solution of this model provides analytical functions for the field-dependence of and . These are shown for meV, meV and at various temperatures on Fig. 9(a)-9(b). The wavenumber changes smoothly from its zero field value () to its field-induced value (). The correlation length has a minimum at an intermediate value of . The field range of these changes becomes narrower with decreasing temperature.
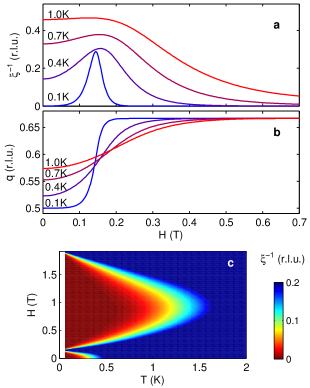
At sufficiently low temperatures the correlations are almost unaffected by the field up to a threshold value. The regime I in SrDy2O4 corresponds to this field range where the system is nearly field-independent. The regime II occurs when the correlation length along the chain decreases. The reduction of these correlations yields an increase of the interchain correlations, as observed by an increase in the correlation length along the -axis. In the 1D ANNNI model, the decrease and increase of the correlation length at mK happens in a narrower field range than what is experimentally observed in SrDy2O4 (regime II). This may be due to the interchain correlations which compete with the intrachain correlations. The regime III is attained when there is no more variation in and the correlation length along the chain. The presence of multiple regimes at low temperatures are therefore understood in a simple manner with the 1D ANNNI model in longitudinal field. The theoretical temperature and field dependence of the correlation length shown in Fig. 9(c) also reflects the experimental phase diagram shown in Fig. 2(a).
We have previously described the absence of long range magnetic order of SrDy2O4 in zero field by the presence of slowly decaying defects that are trapped by a dimensionality crossover around K.Gauthier et al. (2017b) The hysteretic effects measured in field appear below this characteristic temperature. This can be understood by the very slow dynamics below that precludes the rearrangement of large number of moments. In fact, the transitions between different orders of the ANNNI model in longitudinal fields are first order and do not lead to critical fluctuations in the proximity of the transitions. The modification of the order must therefore occur through local rearrangements of the moments and the lack of thermal fluctuations at low temperatures justifies the presence of strong hysteretic effects. The quantum fluctuations on site 1 due to the transverse field appear to be insufficient to overcome the slow thermally activated dynamics at these low temperatures.
V Summary
We presented the magnetic structure of the field-induced phase of SrDy2O4 for , which is consistent with the state expected for the 1D ANNNI model in longitudinal fields. Our results show that this field-induced phase features short or long range order depending on the temperature and magnetic field history. At mK in ZFC conditions, the magnetic correlations exhibit multiple correlated regimes between the zero field short range order characterized by and the field-induced state characterized by . These regimes can be qualitatively described by the 1D ANNNI model in longitudinal field. The state for fields is described as a partially ferromagnetic state with one fully polarized site and one weakly field-dependent site due to its transverse moment anisotropy. Even though our results indicate that the SrDy2O4 compound exhibits the main features expected by the 1D ANNNI model, the interchain couplings are the ones responsible for the system complexity leading to unconventional effects such as the transverse ferromagnetic magnetization in the field-induced phase with presented in section III.1. This transverse ferromagnetism is understood from interchain interactions forcing the state on the inequivalent site for which the moment anisotropy is transverse to the field.
Acknowledgements
The authors are thankful to M. Sigrist and D.L. Quintero-Castro for fruitful discussions; M. Bartkowiak and M. Zolliker for the assistance with the dilution refrigerator experiments at SINQ. The magnetic structure figure was generated with the SpinW package for Matlab.Toth and Lake (2015) This research received support from the Swiss National Foundation (SNF Grant No. 138018), the Natural Sciences and Engineering Research Council of Canada (Canada), the Fonds Québécois sur la Nature et les Technologies (Québec) and the Canada Research Chair Foundation (Canada).
References
- Matsuhira et al. (2002) K. Matsuhira, Z. Hiroi, T. Tayama, S. Takagi, and T. Sakakibara, Journal of Physics: Condensed Matter 14, L559 (2002).
- Gardner et al. (2010) J. S. Gardner, M. J. P. Gingras, and J. E. Greedan, Reviews of Modern Physics 82, 53 (2010).
- J. Hayes et al. (2012) T. J. Hayes, O. Young, G. Balakrishnan, and O. A. Petrenko, Journal of the Physical Society of Japan 81, 024708 (2012).
- Hayes et al. (2011) T. J. Hayes, G. Balakrishnan, P. P. Deen, P. Manuel, L. C. Chapon, and O. A. Petrenko, Physical Review B 84, 174435 (2011).
- Quintero-Castro et al. (2012) D. L. Quintero-Castro, B. Lake, M. Reehuis, A. Niazi, H. Ryll, A. T. M. N. Islam, T. Fennell, S. A. J. Kimber, B. Klemke, J. Ollivier, et al., Physical Review B 86, 064203 (2012).
- Fennell et al. (2014) A. Fennell, V. Y. Pomjakushin, A. Uldry, B. Delley, B. Prévost, A. Désilets-Benoit, A. D. Bianchi, R. I. Bewley, B. R. Hansen, T. Klimczuk, et al., Physical Review B 89, 224511 (2014).
- Wen et al. (2015) J.-J. Wen, W. Tian, V. O. Garlea, S. M. Koohpayeh, T. M. McQueen, H.-F. Li, J.-Q. Yan, J. A. Rodriguez-Rivera, D. Vaknin, and C. L. Broholm, Physical Review B 91, 054424 (2015).
- Petrenko (2014) O. A. Petrenko, Low Temperature Physics 40, 106 (2014).
- Malkin et al. (2015) B. Z. Malkin, S. I. Nikitin, I. E. Mumdzhi, D. G. Zverev, R. V. Yusupov, I. F. Gilmutdinov, R. Batulin, B. F. Gabbasov, A. G. Kiiamov, D. T. Adroja, et al., Physical Review B 92, 094415 (2015).
- Selke (1988) W. Selke, Physics Reports 170, 213 (1988).
- Oguchi (1965) T. Oguchi, Journal of the Physical Society of Japan 20, 2236 (1965).
- Morita and Horiguchi (1972) T. Morita and T. Horiguchi, Physics Letters A 38, 223 (1972).
- Rujan et al. (1983) P. Rujan, W. Selke, and G. V. Uimin, Zeitschrift für Physik B Condensed Matter 53, 221 (1983).
- Cheffings et al. (2013) T. H. Cheffings, M. R. Lees, G. Balakrishnan, and O. A. Petrenko, Journal of Physics: Condensed Matter 25, 256001 (2013).
- Bidaud et al. (2016) C. Bidaud, O. Simard, G. Quirion, B. Prévost, S. Daneau, A. D. Bianchi, H. A. Dabkowska, and J. A. Quilliam, Physical Review B 93, 060404 (2016).
- Gauthier et al. (2017a) N. Gauthier, B. Prévost, A. Amato, C. Baines, V. Pomjakushin, A. D. Bianchi, R. J. Cava, and M. Kenzelmann, Journal of Physics: Conference Series 828, 012014 (2017a).
- Gauthier et al. (2017b) N. Gauthier, A. Fennell, B. Prévost, A.-C. Uldry, B. Delley, R. Sibille, A. Désilets-Benoit, H. A. Dabkowska, G. J. Nilsen, L.-P. Regnault, et al., Physical Review B 95, 134430 (2017b).
- Balakrishnan et al. (2009) G. Balakrishnan, T. J. Hayes, O. A. Petrenko, and D. M. Paul, Journal of Physics: Condensed Matter 21, 012202 (2009).
- Aharoni (1998) A. Aharoni, Journal of Applied Physics 83, 3432 (1998).
- Rodríguez-Carvajal (1993) J. Rodríguez-Carvajal, Physica B: Condensed Matter 192, 55 (1993).
- Chakrabarti et al. (1996) B. K. Chakrabarti, A. Dutta, and P. Sen, Quantum Ising Phases and Transitions in Transverse Ising Models, vol. 41 of Lecture Notes in Physics Monographs (Springer Berlin Heidelberg, 1996).
- Bhattacharyya and Dasgupta (1991) N. Bhattacharyya and S. Dasgupta, Journal of Physics A: Mathematical and General 24, 3927 (1991).
- Alves Jr. and Yokoi (2000) N. Alves Jr. and C. S. O. Yokoi, Brazilian Journal of Physics 30, 667 (2000).
- Toth and Lake (2015) S. Toth and B. Lake, Journal of Physics: Condensed Matter 27, 166002 (2015).