The igmspec Database of Public Spectra Probing the Intergalactic Medium
Abstract
We describe v02 of igmspec, a database of publically available ultraviolet, optical, and near-infrared spectra that probe the intergalactic medium (IGM). This database, a child of the specdb repository in the specdb github organization, comprises 403277 unique sources and 434686 spectra obtained with the world’s greatest observatories. All of these data are distributed in a single GB HDF5 file maintained at the University of California Observatories and the University of California, Santa Cruz. The specdb software package includes Python scripts and modules for searching the source catalog and spectral datasets, and software links to the linetools package for spectral analysis. The repository also includes software to generate private spectral datasets that are compliant with International Virtual Observatory Alliance (IVOA) protocols and a Python-based interface for IVOA Simple Spectral Access queries. Future versions of igmspec will ingest other sources (e.g. gamma-ray burst afterglows) and other surveys as they become publicly available. The overall goal is to include every spectrum that effectively probes the IGM. Future databases of specdb may include publicly available galaxy spectra (exgalspec) and published supernovae spectra (snspec). The community is encouraged to join the effort on github: https://github.com/specdb
1 Introduction
Shortly after the discovery of quasars [1], astronomers identified absorption-line features in their spectra indicating the presence of intergalactic gas [2, 3]. The community quickly recognized both the value of these data to cosmology and galaxy formation [4, 5]. In the decades that followed, observationalists gathered spectra of increasingly higher quality on several tens of high- sources to analyze the IGM [6, 7, 8, 9]. These were obtained primarily with private observatories and the spectra were rarely made available to the community in science-ready form. An obvious exception was the data archives of the International Ultraviolet Explorer and the Hubble Space Telescope [HST; 10, 11], but even these have been difficult to collate and combine. One also recognizes the policy of European Southern Observatory to archive and make public their Very Large Telescope (VLT) datasets.
The past years has witnessed the rise of large, public spectral datasets, especially the 2dF Survey and Sloan Digital Sky Survey [SDSS; 12, 13]. These include the spectra of several hundred thousand quasars that probe the IGM [e.g. 14]. Their surveys have further stimulated the public release of smaller spectroscopic surveys with higher quality data (S/N, resolution) on complimentary sources [e.g. 15, 16]. Accessing both the large survey datasets and these modest high-quality datasets of IGM spectroscopy has remained a challenge, however. This is primarily due to the diverse range of data formats adopted within the astronomical community. For example, science-grade spectra are often processed and combined with custom software that may not preserve or record salient meta data. While the International Virtual Observatory Alliance (IVOA) has taken significant effort to establish a spectral data model111http://www.ivoa.net/documents/SpectralDM/ and standards for Simple Spectral Access222http://www.ivoa.net/documents/SSA/ ( SSA) protocols, these have seen limited usage. Despite the fact that the entire set of reduced and calibrated spectra for the IGM comprises less than a few tens GB of disk space, there has been no method established for wide-spread distribution.
Therefore, as a service to IGM researchers, ourselves, and the broader community, we have initiated an effort to collate all of the published surveys of IGM spectroscopy. These are packaged in a single HDF5 file referred to as the igmspec database, staged for direct download at the University of California, Santa Cruz333http://specdb.ucsc.edu. We also have developed Python software for querying the source catalog and meta data and for accessing the spectra. This includes an SSA compliant interface for data queries, although we do not yet include a web portal for SSA service.
The uber-project of igmspec is specdb444http://specdb.ucolick.org, which includes a suite of software for the generation and manipulation of spectral databases. With this publication we provide the first database, igmspec, which focuses on spectra that probe the IGM. In v02555v01 of igmspec was a prototype and was accessed by only a few guinea pigs., we consider only quasars but this database will grow with future surveys and we will be expanded to include other sources [e.g. gamma-ray burst afterglow spectra, star-forming galaxies, supernovae; 17, 18, 19] We will also ingest other historical datasets that come to light in the public domain. In specdb, we also provide software to generate private spectral databases; this may be of interest for surveys under construction, i.e. prior to publication.
This paper describes version v02 of the igmspec database and an overview of the specdb software. Additional documentation is available666http://specdb.readthedocs.io on Read the Docs. The manuscript is organized as follows: Section 2 describes the catalogs included in igmspec. Section 3 details the spectral datasets in v02 of igmspec. Sections 4 and 5 briefly describe the database architecture and related software.
2 The igmspec Source Catalog
At the heart of igmspec, and any other database of specdb, is a catalog of unique sources. Each source is assigned an identifier or IDKEY (e.g. IGM_ID for igmspec) to be preserved in all future versions of the database. If a source is discovered to be erroneous, we will remove it without modifying any other IGM_ID values.
To construct the source catalog of igmspec, we followed these steps, in order:
-
1.
Ingest all quasars from the BOSS DR12 survey.777See http://www.sdss.org/dr12/algorithms/boss-dr12-quasar-catalog/
-
2.
Add all quasars from the SDSS DR7 survey not observed by BOSS. These were defined as any sources with angular separation from sources in the BOSS dataset.
-
3.
Add any additional, unique sources () from the igmspec datasets.
-
4.
Examine each pair of sources with (179 total) to establish whether they are truly unique.
The igmspec source catalog includes a minimum of meta data to limit its size and maximize search speed. The columns are described in Table 1. We caution that other than the BOSS and SDSS surveys the adopted astrometry may not have sub-arcsecond accuracy.
| Column | Type | Description |
|---|---|---|
| RA | float64 | Right Ascension in J2000 (degrees) |
| DEC | float64 | Declination in J2000 (degrees) |
| IGM_ID | int | Unique igmspec identifier |
| flavor | str | Type of source (quasar, GRB, galaxy) |
| zem | float64 | Redshift of the source |
| sig_zem | float64 | Uncertainty in the source redshift |
| flag_zem | str | String describing the redshift measurement |
| flag_group | int | Bitwise flag indicating the data groups covering the source |
3 igmspec Data Groups
This manuscript describes v02 of the igmspec database and represents our first comprehensive effort to collate spectra probing the IGM at UV and optical wavebands at all redshifts. The first version was a prototype and is not being distributed. Future efforts will extend to other wavebands and/or additional types of sources [e.g. star-forming galaxies; 18].
Table 2 lists the surveys included in v02 of igmspec and summarizes properties of each survey. Within our database terminology, each of these is referred to as a data group. This table lists the number of unique sources and spectra ingested. We have not explicitly culled any data from the survey, e.g. by S/N or any other attribute. There were occasional spectra in the surveys that identified as junk and ignored (see details in the sub-sections).
Table 3 lists the meta data included for every spectrum ingested into igmspec. The RA_GROUP, DEC_GROUP, and zem_GROUP values are the coordinates and redshifts for the source as reported by the survey. As described in Section 2, these have been collated across all data groups for the database to generate a catalog of unique sources. Therefore, the values in the meta tables need not identically match those in the source catalog. In addition, each meta table includes a title, reference, and additional data descriptions (in HDF5 attributes) to be compliant with the IVOA spectral data model and to enable compliant SSA queries. Each data group also typically includes additional meta data specific to it (e.g. photometry for SDSS sources). The igmspec documentation and the original references provide greater detail on the meta data and spectra included within each survey, but the following sub-sections also provide brief descriptions.
The majority of IGM research is performed on continuum-normalized spectra to assess the opacity of intervening gas. Table 2 indicates whether the spectral flux is normalized or, for unnormalized data, whether the flux calibration was relative or absolute. For many of the unnormalized datasets, we provide a separate estimate of the quasar continuum in the database that can be applied in software for normalization. These continua were primarily generated from low-order polynomial fits to the spectrum or ‘by-hand’ with spline models of unabsorbed regions but see the following sub-sections for further details. We caution that is limited overlap between datasets, i.e. nearly the same spectrum has been ingested twice in multiple data groups. Such duplications can be identified by referring to the observation date (DATE-OBS).
| Group | (Å) | (Å) | Fluxd | |||
| 2QZ | 23539 | 23539 | 3554 | 8076 | 580 | RELATIVE |
| BOSS_DR12 | 302257 | 302323 | 3545 | 10414 | 2100 | ABSOLUTE |
| COS-Dwarfs | 43 | 43 | 1135 | 1796 | 20000 | ABSOLUTE |
| COS-Halos | 38 | 70 | 1135 | 5896 | 20000 | MIXED |
| ESI_DLA | 87 | 87 | 3993 | 10136 | 6060 | RELATIVE |
| GGG | 163 | 326 | 4317 | 10299 | 886 | RELATIVE |
| HD-LLS_DR1 | 127 | 145 | 3027 | 11715 | 25000 | NORMALIZED |
| HDLA100 | 86 | 86 | 3055 | 10029 | 48000 | NORMALIZED |
| HSTQSO | 762 | 904 | 1126 | 3302 | 14000 | ABSOLUTE |
| HST_z2 | 69 | 69 | 1648 | 9867 | 70 | ABSOLUTE |
| KODIAQ_DR1 | 170 | 235 | 2995 | 9725 | 48000 | NORMALIZED |
| MUSoDLA | 88 | 94 | 2989 | 10492 | 4225 | NORMALIZED |
| SDSS_DR7 | 105783 | 105783 | 3782 | 9266 | 2000 | ABSOLUTE |
| UVES_Dall | 40 | 40 | 3042 | 10091 | 45000 | RELATIVE |
| UVpSM4 | 69 | 642 | 0 | 10259 | 20000 | RELATIVE |
| XQ-100 | 100 | 300 | 3100 | 24803 | 5300 | RELATIVE |
| aNumber of unique sources in the dataset. | ||||||
| bNumber of unique spectra in the dataset. | ||||||
| cCharacteristic FWHM resolution of the spectra. | ||||||
| dIndicates whether the data are fluxed (absolute or relative) or normalized. The COS-Halos spectra include both fluxed (COS) and normalized (HIRES) spectra. | ||||||
| Column | Type | Description |
| RA_GROUP | float64 | Right Ascension in J2000 (degrees) |
| DEC_GROUP | float64 | Declination in J2000 (degrees) |
| EPOCH | float64 | Epoch |
| zem_GROUP | float64 | Redshift of the source |
| flag_zem | str | Description of the redshift source |
| IGM_ID | int | Unique igmspec identifier |
| GROUP_ID | int | Unique group identifier |
| DISPERSER | str | Name of the dispersing element used |
| INSTR | str | Name of the instrument used |
| TELESCOPE | str | Name of the telescope used |
| DATE-OBS | str | Date of observation (YYYY-MM-DD) |
| SPEC_FILE | str | Name of individual file containing the spectrum |
| R | float64 | Spectral resolution (FWHM) |
| WVMIN | float64 | Minimum wavelength of the spectrum (Å) |
| WVMAX | float64 | Maximum wavelength of the spectrum (Å) |
| NPIX | int | Number of pixels in the spectruma |
| aThis does not include any pixels that ‘pad’ the spectrum at the highest and | ||
| lowest wavelengths, i.e. that have sig . | ||
3.1 BOSS DR12
The Baryonic Oscillations Spectroscopic Survey (BOSS) observed several hundred thousand quasars as part of its primary survey. With its final, complete data release (DR12), the BOSS team provided several catalogs of quasars observed by the main survey. We have drawn all sources from the three catalogs at their main website.888http://www.sdss.org/dr12/algorithms/boss-dr12-quasar-catalog/
The BOSS spectra bundled in v02 of igmspec were pulled from the main data server and correspond to versions v5_7_0 or v5_7_2 of the data reduction pipeline. In addition to the calibrated spectra, we include a continuum estimate for the majority of quasars. For wavelengths long-ward of the quasar’s Ly emission we have ingested the continuum models generated by G. Zhu [see 20, for details on the algorithm]. For the several thousands quasars analyzed to assess the flux probability distribution function of the Ly forest [21], we include their mean-flux-regulated continua [22].
3.2 SDSS DR7
The Sloan Digital Sky Survey observed over 100,000 quasars as part of the SDSS-I survey. These were primarily targeted based on their optical photometry [e.g. 23]. Upon completion of their final data release (DR7), the team provided a catalog of quasars [14]. This forms the basis of the dataset in v02 of igmspec. We have also ingested estimates of the quasar continua, as published in [20]. Their analysis focused on a separate list of quasars from SDSS DR7 which overlaps the [14] catalog, but not completely. In a future version, we will provide continua for the majority of these spectra and also additional quasars discovered in SDSS-I but not part of the catalog [14].
3.3 2QZ
The 2QZ survey is a catalog of quasars discovered in the course of the 2dF redshift survey on the 3.9 m Anglo-Australian Telescope [13]. The majority of spectra are available online999http://www.2dfquasar.org/Spec_Cat/2qzsearch2.html. We retrieved all available sources in their catalog with and discarded several hundred with null values in their entire error arrays.
3.4 KODIAQ_DR1
3.5 HD-LLS DR1
The high dispersion Lyman Limit System (HD-LLS) sample is a set of normalized echelle and echellette spectra obtained with spectrographs at the Keck and Magellan observatories [16]. These were primarily acquired to perform an analysis of LLS. The quasars are a heterogeneous set of sources that are useful (i.e. bright) for such analysis.
3.6 GGG
The Giant Gemini GMOS (GGG) survey is a spectroscopic survey of quasars drawn from the Sloan Digital Sky Survey and re-observed with the GMOS spectrometer on the Gemini North and South telescopes. The data release is described in [26].
3.7 XQ-100
The XQ-100 survey is the result of a Large VLT program titled ”Quasars and their absorption lines: a legacy survey of the high-redshift universe with VLT/XSHOOTER” as described in [27]. The survey comprises XSHOOTER spectra of 100 quasars at and is the only dataset of v02 in igmspec with near-IR coverage. Note that the coordinates provided in their archival products are erroneous by up to several arcseconds, but we have cross-matched these to the correct sources. We have also ingested estimate of the continuum for each source that are provided with the archival spectra.
3.8 HDLA100
3.9 ESIDLA
3.10 MUSoDLA
[32] performed a survey of DLAs drawn from the SDSS with follow-up spectra obtained primarily with the MagE spectrometer at the Magellan Observatory. The survey was supplemented by echelled data taken from the Keck and VLT archives. The spectra, as provided in igmspec, were continuum normalized by [32].
3.11 UVES_Dall
[33] processed archival VLT/UVES spectra for 40 quasars to study the IGM at with emphasis on the proximity effect. The quasars were selected to have and the spectra were required to have high S/N in the Ly forest. We provide the complete dataset of fluxed spectra and also include an estimate of the quasar continuum.
3.12 COS-Halos
The COS-Halos survey obtained spectra with the Cosmic Origins Spectrometer [COS; 34] on the HST to examine the circumgalactic medium (CGM) of luminous, galaxies [35]. We provide these COS quasar spectra, binned at 3 pixels. The team also obtained Keck/HIRES spectra for a subset of the quasars [36]. All of these data are provided in igmspec.
3.13 COS-Dwarfs
The COS-Dwarfs survey comprises HST/COS spectra of quasars whose sightlines penetrate the CGM of dwarf galaxies [37]. We provide the full dataset, binned at 3 pixels.
3.14 UVpSM4
[38, 39] compiled and processed all of the medium resolution () and high resolution () UV spectra available in 2010 (i.e. prior to the SM4 servicing mission) to study metal-line absorption in the IGM. From HST, these were primarily STIS and GHRS datasets. The authors also included supporing data from the Far-Ultraviolet Spectrographic Explorer (FUSE). All of these fluxed spectra are ingested and we also include the [38] continuum models.
3.15 HSTQSO
[40] and [41] compiled nearly the entire set of UV spectra of quasars and AGN available in the HST archive to survey for Lyman limit and damped Ly systems. This includes the Faint Object Spectrometer dataset compiled by [11] and data from GHRS, STIS and COS (Lehner et al., in prep.). The data group includes 360 spectra from COS, 339 spectra with FOS, and 205 spectra taken with STIS. For the COS spectra, we have ingested the files provided by the Hubble Space Legacy Archive101010https://archive.stsci.edu/hst/spectral_legacy/ (HSLA). Note that there is overlap in spectra between this data group and the other HST datasets listed above, although each was processed separately.
3.16 HST_z2
4 Architecture of the igmspec Data File
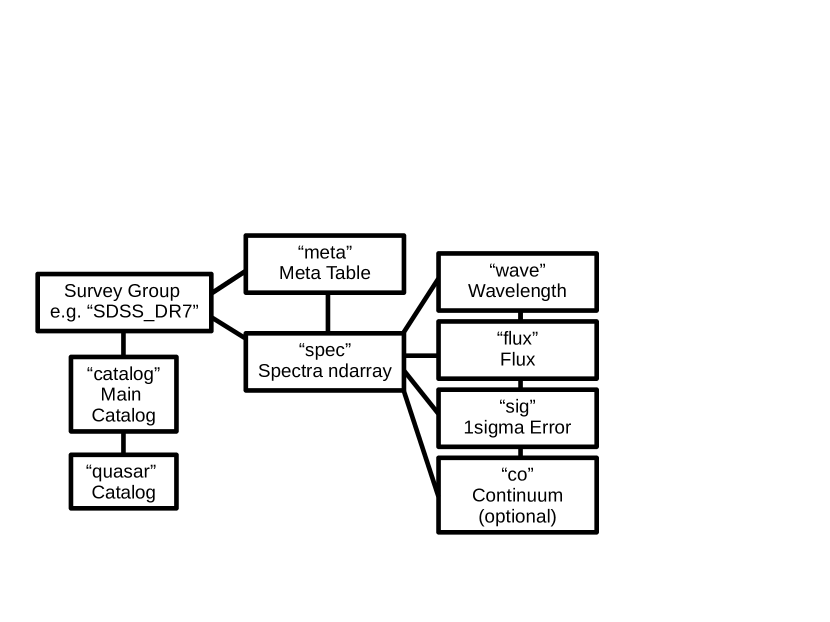
The igmspec database is provided as a single HDF5 file (IGMspec_DB_v02.hdf5) containing the source catalog, a separate quasar catalog, and the spectra with their meta data. The HDF5 format enables rapid access to the data without reading the entire database into memory. Figure 1 illustrates the architecture of the HDF5 file. It was built using Python’s h5py package and software within the igmspec, specdb, linetools and astropy packages.
Each dataset comprises an HDF5 Group with a meta Dataset and a spec Dataset. The former is first generated as an astropy Table, with one row per spectrum, and then converted into an HDF5 object. The latter is an numpy.ndarray with dtype names ‘wave’, ‘flux’, and ‘sig’ for the wavelength, flux, and error arrays. The wavelength values are stored as float64 data type and the rest are float32. Many of the datasets also include an estimate of the source continuum which is recorded in the ‘co’ column.
The igmspec database file may be downloaded using the spec_get_igmspec script in specdb without installing the igmspec repository.
5 Software
The igmspec repository111111https://github.com/specdb/igmspec includes a set of Python modules and scripts to build the igmspec database. These are not intended to be used by the general community. Access to the igmspec database file is provided within the specdb repository. This section summarizes the key software in the specdb repository with emphasis on accessing and using igmspec.
5.1 Downloading igmspec
The specdb repository includes a simple script for retrieving a copy of any of its public databases. This includes igmspec; the corresponding Python script is specdb_get_igmspec. This script uses a wget call to the URL of the database file. A related script, specdb_chk, summarizes the contents and creation data of any specdb database file.
5.2 Interfacing with the Database in Python
The specdb repository121212https://github.com/specdb/specdb includes software developed in Python for interacting with a specdb database file. The primary object is the SpecDB class and one may use a child IgmSpec for the igmspec database. After instantiating this object, one may query the source catalog, the spectra meta data, and retrieve spectra into memory. Details are provided in the online specdb documentation131313http://specdb.readthedocs.io/en/latest/ and here is a summary:
-
1.
Querying the source catalog: The SpecDB class instantiates a QueryCatalog class to load and then query the source catalog. The majority of methods use position on the sky or a user-input set of coordinates in the queries. Documentation is given here141414http://specdb.readthedocs.io/en/latest/catalog.html#querying-the-source-catalog and the repository includes an iPython Notebook151515https://github.com/specdb/specdb/blob/master/docs/nb/Query_Catalog.ipynb with examples.
-
2.
Querying the spectral meta data: Each spectrum in the database has associated meta data which may be queried. The interface is the InterfaceGroup class which reads the data into an astropy Table and performs queries. The relevant documentation is found here161616http://specdb.readthedocs.io/en/latest/meta.html and the repository includes an iPython Notebook171717https://github.com/specdb/specdb/blob/master/docs/nb/Query_Meta.ipynb with examples.
-
3.
Retrieving spectra: The InterfaceGroup class contains the low-level routines for spectral retrieval, but we recommend the higher-level methods within the SpecDB class. These methods return the data packaged within an XSpectrum1D181818http://linetools.readthedocs.io/en/latest/xspectrum1d.html object from the linetools package. Documentation is described here191919http://specdb.readthedocs.io/en/latest/spectra.html and examples are located in an iPython Notebook202020https://github.com/specdb/specdb/blob/master/docs/nb/Retrieving_Spectra.ipynb in the repository.
We also refer the reader to an iPython Notebook212121https://github.com/specdb/specdb/blob/master/docs/nb/Examples_with_igmspec.ipynb for examples with igmspec. Lastly, there is a set of command-line scripts222222http://specdb.readthedocs.io/en/latest/scripts.html which enable the user to access the spectra without launching an explicit Python session.
5.3 SSA Interfacing
Although we primarily intend for the igmspec database to be downloaded and then accessed and manipulated locally (the HDF5 file is only Gb), the specdb software includes an SSAInterface object for performing standard SSA queries on a specdb database file. The current implementation query takes POS (position) and SIZE (angular radius) inputs and returns an SSA v1.1 compliant VOTable. One can also perform a FORMAT=METADATA query. Referring to v2.0 of the IVOA spectral data model (dated 2016-09-28), all of the mandatory fields of the model are provided except: (1) Char.SpatialAxis.Coverage.Bounds.Extent, as the aperture is not precisely known for all spectra in igmspec; (2) Char.TimeAxis.Coverage.Bounds.Extent, because the total exposure time is not always recorded for spectra coadded across multiple exposures. The current interface also does not include software to distribute individual spectra. If community pressure is sufficient, we will stage igmspec within an online SSA service.
5.4 Building a specdb Database
The specdb repository includes Python methods to generate new specdb databases. The basic requirements are: (i) files of the spectra that can be read by the spectra tools in linetools; (ii) listings of the spectral meta data that provide at least the default information in Table 3; (iii) source astrometry and redshifts. For the latter, one can interface with the igmspec database. The software also includes a means to add IVOA descriptors for meeting spectral data model 2.0.
6 Concluding Remarks
With the igmspec database, it is our goal to provide (nearly) all of the published spectral datasets that effectively probe the IGM. Hopefully, this effort will enable new, unforeseen research on the IGM as well as the greater diffusion of otherwise difficult-to-access spectral datasets.
In v03 of igmspec (expected release date is months from this publication), we plan to include at least the following: (1) additional near-IR spectroscopy; (2) radio absorption spectra [e.g. 21 cm; 44]; (3) galaxy spectra probing the IGM [e.g. 18], and (4) spectroscopy of GRB afterglows [e.g. 17]. Community members interested in guiding the future development of igmspec are encouraged to contribute via github (https://github.com/specdb/igmspec).
To enable IGM cross-correlation analyses with galaxies and the large-scale structures they trace, we intend the future release of exgalspec. This database will have – at the minimum – a catalog of (nearly) all spectroscopically confirmed galaxies and, where feasible, their associated spectra. See https://github.com/specdb/exgalspec to contribute to that effort.
7 Acknowledgments
J. X. P. is partially supported by NSF grant AST-1412981. We thank many individuals who helped with the construction of the database: John O’Meara, Gabor Worseck, Joe Ribaudo, Marcel Neeleman, Jason Tumlinson, Rongmon Bordoloi, Jessica Werk, Kathy Cooksey, S. Croom, K.-G. Lee, Guangtun Zhu, Adam Myers, Joseph Hennawi, and Marc Rafelski.
JXP thanks the Pacific Research Platform (PRP) whose support helps host the files for igmspec. The PRP is funded by NSF Project #ACI-1541349 to PI Larry Smarr at the University of California, San Diego.
References
- [1] M. Schmidt, 3C 273: a star-like object with large red-shift., Nature197 (1963) 1040–1040.
- [2] J. N. Bahcall, E. E. Salpeter, On the Interaction of Radiation from Distant Sources with the Intervening Medium., ApJ142 (1965) 1677–1680. doi:10.1086/148460.
- [3] E. M. Burbidge, C. R. Lynds, G. R. Burbidge, ON the Measurement and Interpretation of Absorption Features in the Spectrum of the Quasi-Stellar Object 3c 191, ApJ144 (1966) 447. doi:10.1086/148629.
- [4] J. E. Gunn, B. A. Peterson, On the Density of Neutral Hydrogen in Intergalactic Space., ApJ142 (1965) 1633–1641. doi:10.1086/148444.
-
[5]
J. N. Bahcall, L. J. Spitzer,
Absorption Lines Produced by
Galactic Halos, ApJ156 (1969) L63.
URL http://adsabs.harvard.edu/cgi-bin/ - [6] W. L. W. Sargent, P. J. Young, A. Boksenberg, D. Tytler, The distribution of Lyman-alpha absorption lines in the spectra of six QSOs - Evidence for an intergalactic origin, ApJS42 (1980) 41–81. doi:10.1086/190644.
- [7] D. Tytler, QSO Lyman limit absorption, Nature298 (1982) 427–432. doi:10.1038/298427a0.
- [8] A. M. Wolfe, D. A. Turnshek, H. E. Smith, R. D. Cohen, Damped Lyman-alpha absorption by disk galaxies with large redshifts. I - The Lick survey, ApJS61 (1986) 249–304. doi:10.1086/191114.
- [9] K. M. Lanzetta, Evolution of high-redshift Lyman-limit absorption systems, ApJ375 (1991) 1–14. doi:10.1086/170164.
- [10] J. N. Bahcall, J. Bergeron, A. Boksenberg, G. F. Hartig, B. T. Jannuzi, S. Kirhakos, W. L. W. Sargent, B. D. Savage, D. P. Schneider, D. A. Turnshek, R. J. Weymann, A. M. Wolfe, The Hubble Space Telescope quasar absorption line key project. I - First observational results, including Lyman-alpha and Lyman-limit systems, ApJS87 (1993) 1–43. doi:10.1086/191797.
- [11] J. Bechtold, A. Dobrzycki, B. Wilden, M. Morita, J. Scott, D. Dobrzycka, K.-V. Tran, T. L. Aldcroft, A Uniform Analysis of the Ly Forest at z = 0-5. III. Hubble Space Telescope Faint Object Spectrograph Spectral Atlas, ApJS140 (2002) 143–238. arXiv:astro-ph/0111486, doi:10.1086/342489.
- [12] D. G. York, J. Adelman, J. E. Anderson, Jr., S. F. Anderson, J. Annis, N. A. Bahcall, J. A. Bakken, R. Barkhouser, S. Bastian, E. Berman, W. N. Boroski, S. Bracker, C. Briegel, J. W. Briggs, J. Brinkmann, R. Brunner, S. Burles, L. Carey, M. A. Carr, F. J. Castander, B. Chen, P. L. Colestock, A. J. Connolly, J. H. Crocker, I. Csabai, P. C. Czarapata, J. E. Davis, M. Doi, T. Dombeck, D. Eisenstein, N. Ellman, B. R. Elms, M. L. Evans, X. Fan, G. R. Federwitz, L. Fiscelli, S. Friedman, J. A. Frieman, M. Fukugita, B. Gillespie, J. E. Gunn, V. K. Gurbani, E. de Haas, M. Haldeman, F. H. Harris, J. Hayes, T. M. Heckman, G. S. Hennessy, R. B. Hindsley, S. Holm, D. J. Holmgren, C.-h. Huang, C. Hull, D. Husby, S.-I. Ichikawa, T. Ichikawa, Ž. Ivezić, S. Kent, R. S. J. Kim, E. Kinney, M. Klaene, A. N. Kleinman, S. Kleinman, G. R. Knapp, J. Korienek, R. G. Kron, P. Z. Kunszt, D. Q. Lamb, B. Lee, R. F. Leger, S. Limmongkol, C. Lindenmeyer, D. C. Long, C. Loomis, J. Loveday, R. Lucinio, R. H. Lupton, B. MacKinnon, E. J. Mannery, P. M. Mantsch, B. Margon, P. McGehee, T. A. McKay, A. Meiksin, A. Merelli, D. G. Monet, J. A. Munn, V. K. Narayanan, T. Nash, E. Neilsen, R. Neswold, H. J. Newberg, R. C. Nichol, T. Nicinski, M. Nonino, N. Okada, S. Okamura, J. P. Ostriker, R. Owen, A. G. Pauls, J. Peoples, R. L. Peterson, D. Petravick, J. R. Pier, A. Pope, R. Pordes, A. Prosapio, R. Rechenmacher, T. R. Quinn, G. T. Richards, M. W. Richmond, C. H. Rivetta, C. M. Rockosi, K. Ruthmansdorfer, D. Sandford, D. J. Schlegel, D. P. Schneider, M. Sekiguchi, G. Sergey, K. Shimasaku, W. A. Siegmund, S. Smee, J. A. Smith, S. Snedden, R. Stone, C. Stoughton, M. A. Strauss, C. Stubbs, M. SubbaRao, A. S. Szalay, I. Szapudi, G. P. Szokoly, A. R. Thakar, C. Tremonti, D. L. Tucker, A. Uomoto, D. Vanden Berk, M. S. Vogeley, P. Waddell, S.-i. Wang, M. Watanabe, D. H. Weinberg, B. Yanny, N. Yasuda, The Sloan Digital Sky Survey: Technical Summary, AJ120 (2000) 1579–1587. arXiv:arXiv:astro-ph/0006396, doi:10.1086/301513.
- [13] S. M. Croom, T. Shanks, B. J. Boyle, R. J. Smith, L. Miller, N. S. Loaring, F. Hoyle, The 2dF QSO Redshift Survey - II. Structure and evolution at high redshift, MNRAS325 (2001) 483–496. arXiv:arXiv:astro-ph/0012375, doi:10.1046/j.1365-8711.2001.04389.x.
- [14] D. P. Schneider, G. T. Richards, P. B. Hall, M. A. Strauss, S. F. Anderson, T. A. Boroson, N. P. Ross, Y. Shen, W. N. Brandt, X. Fan, N. Inada, S. Jester, G. R. Knapp, C. M. Krawczyk, A. R. Thakar, D. E. Vanden Berk, W. Voges, B. Yanny, D. G. York, N. A. Bahcall, D. Bizyaev, M. R. Blanton, H. Brewington, J. Brinkmann, D. Eisenstein, J. A. Frieman, M. Fukugita, J. Gray, J. E. Gunn, P. Hibon, Ž. Ivezić, S. M. Kent, R. G. Kron, M. G. Lee, R. H. Lupton, E. Malanushenko, V. Malanushenko, D. Oravetz, K. Pan, J. R. Pier, T. N. Price, III, D. H. Saxe, D. J. Schlegel, A. Simmons, S. A. Snedden, M. U. SubbaRao, A. S. Szalay, D. H. Weinberg, The Sloan Digital Sky Survey Quasar Catalog. V. Seventh Data Release, AJ139 (2010) 2360. arXiv:1004.1167, doi:10.1088/0004-6256/139/6/2360.
- [15] J. X. Prochaska, A. M. Wolfe, J. C. Howk, E. Gawiser, S. M. Burles, J. Cooke, The UCSD/Keck Damped Ly Abundance Database: A Decade of High-Resolution Spectroscopy, ApJS171 (2007) 29–60. arXiv:arXiv:astro-ph/0702325, doi:10.1086/513714.
- [16] J. X. Prochaska, J. M. O’Meara, M. Fumagalli, R. A. Bernstein, S. M. Burles, The Keck + Magellan Survey for Lyman Limit Absorption. III. Sample Definition and Column Density Measurements, ApJS221 (2015) 2. arXiv:1506.08863, doi:10.1088/0067-0049/221/1/2.
- [17] J. P. U. Fynbo, P. Jakobsson, J. X. Prochaska, D. Malesani, C. Ledoux, A. de Ugarte Postigo, M. Nardini, P. M. Vreeswijk, K. Wiersema, J. Hjorth, J. Sollerman, H. Chen, C. C. Thöne, G. Björnsson, J. S. Bloom, A. J. Castro-Tirado, L. Christensen, A. De Cia, A. S. Fruchter, J. Gorosabel, J. F. Graham, A. O. Jaunsen, B. L. Jensen, D. A. Kann, C. Kouveliotou, A. J. Levan, J. Maund, N. Masetti, B. Milvang-Jensen, E. Palazzi, D. A. Perley, E. Pian, E. Rol, P. Schady, R. L. C. Starling, N. R. Tanvir, D. J. Watson, D. Xu, T. Augusteijn, F. Grundahl, J. Telting, P. Quirion, Low-resolution Spectroscopy of Gamma-ray Burst Optical Afterglows: Biases in the Swift Sample and Characterization of the Absorbers, ApJS185 (2009) 526–573. arXiv:0907.3449, doi:10.1088/0067-0049/185/2/526.
- [18] K. H. R. Rubin, J. X. Prochaska, D. C. Koo, A. C. Phillips, B. J. Weiner, Galaxies Probing Galaxies: Cool Halo Gas from a z = 0.47 Post-Starburst Galaxy, ApJ712 (2010) 574–584. arXiv:0907.0231, doi:10.1088/0004-637X/712/1/574.
- [19] J. Cooke, M. Sullivan, A. Gal-Yam, E. J. Barton, R. G. Carlberg, E. V. Ryan-Weber, C. Horst, Y. Omori, C. G. Díaz, Superluminous supernovae at redshifts of 2.05 and 3.90, Nature491 (2012) 228–231. arXiv:1211.2003, doi:10.1038/nature11521.
- [20] G. Zhu, B. Ménard, D. Bizyaev, H. Brewington, G. Ebelke, S. Ho, K. Kinemuchi, V. Malanushenko, E. Malanushenko, M. Marchante, S. More, D. Oravetz, K. Pan, P. Petitjean, A. Simmons, The large-scale distribution of cool gas around luminous red galaxies, MNRASarXiv:1309.7660, doi:10.1093/mnras/stu186.
- [21] K.-G. Lee, S. Bailey, L. E. Bartsch, W. Carithers, K. S. Dawson, D. Kirkby, B. Lundgren, D. Margala, N. Palanque-Delabrouille, M. M. Pieri, D. J. Schlegel, D. H. Weinberg, C. Yèche, É. Aubourg, J. Bautista, D. Bizyaev, M. Blomqvist, A. S. Bolton, A. Borde, H. Brewington, N. G. Busca, R. A. C. Croft, T. Delubac, G. Ebelke, D. J. Eisenstein, A. Font-Ribera, J. Ge, J.-C. Hamilton, J. F. Hennawi, S. Ho, K. Honscheid, J.-M. Le Goff, E. Malanushenko, V. Malanushenko, J. Miralda-Escudé, A. D. Myers, P. Noterdaeme, D. Oravetz, K. Pan, I. Pâris, P. Petitjean, J. Rich, E. Rollinde, N. P. Ross, G. Rossi, D. P. Schneider, A. Simmons, S. Snedden, A. Slosar, D. N. Spergel, N. Suzuki, M. Viel, B. A. Weaver, The BOSS Ly Forest Sample from SDSS Data Release 9, AJ145 (2013) 69. arXiv:1211.5146, doi:10.1088/0004-6256/145/3/69.
- [22] K.-G. Lee, N. Suzuki, D. N. Spergel, Mean-flux-regulated Principal Component Analysis Continuum Fitting of Sloan Digital Sky Survey Ly Forest Spectra, AJ143 (2012) 51. arXiv:1108.6080, doi:10.1088/0004-6256/143/2/51.
- [23] G. T. Richards, A. D. Myers, A. G. Gray, R. N. Riegel, R. C. Nichol, R. J. Brunner, A. S. Szalay, D. P. Schneider, S. F. Anderson, Efficient Photometric Selection of Quasars from the Sloan Digital Sky Survey. II. ~1,000,000 Quasars from Data Release 6, ApJS180 (2009) 67–83. arXiv:0809.3952, doi:10.1088/0067-0049/180/1/67.
- [24] S. S. Vogt, S. L. Allen, B. C. Bigelow, L. Bresee, B. Brown, T. Cantrall, A. Conrad, M. Couture, C. Delaney, H. W. Epps, D. Hilyard, D. F. Hilyard, E. Horn, N. Jern, D. Kanto, M. J. Keane, R. I. Kibrick, J. W. Lewis, J. Osborne, G. H. Pardeilhan, T. Pfister, T. Ricketts, L. B. Robinson, R. J. Stover, D. Tucker, J. Ward, M. Z. Wei, HIRES: the high-resolution echelle spectrometer on the Keck 10-m Telescope, in: Proc. SPIE Instrumentation in Astronomy VIII, David L. Crawford; Eric R. Craine; Eds., Volume 2198, p. 362, 1994, pp. 362–+.
- [25] J. M. O’Meara, N. Lehner, J. C. Howk, J. X. Prochaska, A. J. Fox, M. A. Swain, C. R. Gelino, G. B. Berriman, H. Tran, The First Data Release of the KODIAQ Survey, AJ150 (2015) 111. arXiv:1505.03529, doi:10.1088/0004-6256/150/4/111.
- [26] G. Worseck, J. X. Prochaska, J. M. O’Meara, G. D. Becker, S. L. Ellison, S. Lopez, A. Meiksin, B. Ménard, M. T. Murphy, M. Fumagalli, The Giant Gemini GMOS survey of zem 4.4 quasars - I. Measuring the mean free path across cosmic time, MNRAS445 (2014) 1745–1760. arXiv:1402.4154, doi:10.1093/mnras/stu1827.
- [27] S. Lopez, V. D’Odorico, S. L. Ellison, G. D. Becker, L. Christensen, G. Cupani, K. D. Denney, I. Paris, G. Worseck, T. A. M. Berg, S. Cristiani, M. Dessauges-Zavadsky, M. Haehnelt, F. Hamann, J. Hennawi, V. Irsic, T.-S. Kim, P. Lopez, R. L. Saust, B. Menard, S. Perrotta, J. X. Prochaska, R. Sanchez-Ramirez, M. Vestergaard, M. Viel, L. Wisotzki, XQ-100: A legacy survey of one hundred 3.5 z 4.5 quasars observed with VLT/XSHOOTER, ArXiv e-printsarXiv:1607.08776.
- [28] M. Neeleman, A. M. Wolfe, J. X. Prochaska, M. Rafelski, The Fundamental Plane of Damped Ly Systems, ApJ769 (2013) 54. arXiv:1303.7239, doi:10.1088/0004-637X/769/1/54.
- [29] M. Rafelski, A. M. Wolfe, J. X. Prochaska, M. Neeleman, A. J. Mendez, Metallicity Evolution of Damped Ly Systems Out to z ~ 5, ApJ755 (2012) 89. arXiv:1205.5047, doi:10.1088/0004-637X/755/2/89.
- [30] M. Rafelski, M. Neeleman, M. Fumagalli, A. M. Wolfe, J. X. Prochaska, The Rapid Decline in Metallicity of Damped Ly Systems at z ~ 5, ApJL782 (2014) L29. arXiv:1310.6042, doi:10.1088/2041-8205/782/2/L29.
- [31] A. I. Sheinis, M. Bolte, H. W. Epps, R. I. Kibrick, J. S. Miller, M. V. Radovan, B. C. Bigelow, B. M. Sutin, ESI, a New Keck Observatory Echellette Spectrograph and Imager 114 (2002) 851–865.
- [32] R. A. Jorgenson, M. T. Murphy, R. Thompson, The Magellan uniform survey of damped Lyman systems - I. Cosmic metallicity evolution, MNRAS435 (2013) 482–501. arXiv:1307.4429, doi:10.1093/mnras/stt1309.
- [33] A. Dall’Aglio, L. Wisotzki, G. Worseck, An unbiased measurement of the UV background and its evolution via the proximity effect in quasar spectra, A & A491 (2008) 465–481. arXiv:0807.5089, doi:10.1051/0004-6361:200810724.
- [34] J. C. Green, C. S. Froning, S. Osterman, D. Ebbets, S. H. Heap, C. Leitherer, J. L. Linsky, B. D. Savage, K. Sembach, J. M. Shull, O. H. W. Siegmund, T. P. Snow, J. Spencer, S. A. Stern, J. Stocke, B. Welsh, S. Béland, E. B. Burgh, C. Danforth, K. France, B. Keeney, J. McPhate, S. V. Penton, J. Andrews, K. Brownsberger, J. Morse, E. Wilkinson, The Cosmic Origins Spectrograph, ApJ744 (2012) 60. arXiv:1110.0462, doi:10.1088/0004-637X/744/1/60.
- [35] J. Tumlinson, C. Thom, J. K. Werk, J. X. Prochaska, T. M. Tripp, N. Katz, R. Davé, B. D. Oppenheimer, J. D. Meiring, A. B. Ford, J. M. O’Meara, M. S. Peeples, K. R. Sembach, D. H. Weinberg, The COS-Halos Survey: Rationale, Design, and a Census of Circumgalactic Neutral Hydrogen, ApJ777 (2013) 59. arXiv:1309.6317, doi:10.1088/0004-637X/777/1/59.
- [36] J. K. Werk, J. X. Prochaska, C. Thom, J. Tumlinson, T. M. Tripp, J. M. O’Meara, M. S. Peeples, The COS-Halos Survey: An Empirical Description of Metal-line Absorption in the Low-redshift Circumgalactic Medium, ApJS204 (2013) 17. arXiv:1212.0558, doi:10.1088/0067-0049/204/2/17.
- [37] R. Bordoloi, J. Tumlinson, J. K. Werk, B. D. Oppenheimer, M. S. Peeples, J. X. Prochaska, T. M. Tripp, N. Katz, R. Davé, A. J. Fox, C. Thom, A. B. Ford, D. H. Weinberg, J. N. Burchett, J. A. Kollmeier, The COS-Dwarfs Survey: The Carbon Reservoir around Sub-L* Galaxies, ApJ796 (2014) 136. arXiv:1406.0509, doi:10.1088/0004-637X/796/2/136.
- [38] K. L. Cooksey, C. Thom, J. X. Prochaska, H. Chen, The Last Eight-Billion Years of Intergalactic C IV Evolution, ApJ708 (2010) 868–908. arXiv:0906.3347, doi:10.1088/0004-637X/708/1/868.
- [39] K. L. Cooksey, J. X. Prochaska, C. Thom, H.-W. Chen, The Last Eight-billion Years of Intergalactic Si IV Evolution, ApJ729 (2011) 87. arXiv:1011.0750, doi:10.1088/0004-637X/729/2/87.
- [40] J. Ribaudo, N. Lehner, J. C. Howk, A Hubble Space Telescope Study of Lyman Limit Systems: Census and Evolution, ApJ736 (2011) 42–+. arXiv:1105.0659, doi:10.1088/0004-637X/736/1/42.
- [41] M. Neeleman, J. X. Prochaska, J. Ribaudo, N. Lehner, J. C. Howk, M. Rafelski, N. Kanekar, The H I Content of the Universe Over the Past 10 GYRS, ApJ818 (2016) 113. arXiv:1601.01691, doi:10.3847/0004-637X/818/2/113.
- [42] J. M. O’Meara, J. X. Prochaska, H.-W. Chen, P. Madau, The Advanced Camera for Surveys+Wide Field Camera 3 Survey for Lyman Limit Systems. I. The Data, ApJS195 (2011) 16. doi:10.1088/0067-0049/195/2/16.
- [43] J. M. O’Meara, J. X. Prochaska, G. Worseck, H.-W. Chen, P. Madau, The HST/ACS+WFC3 Survey for Lyman Limit Systems. II. Science, ApJ765 (2013) 137. arXiv:1204.3093, doi:10.1088/0004-637X/765/2/137.
- [44] N. Kanekar, J. X. Prochaska, A. Smette, S. L. Ellison, E. V. Ryan-Weber, E. Momjian, F. H. Briggs, W. M. Lane, J. N. Chengalur, T. Delafosse, J. Grave, D. Jacobsen, A. G. de Bruyn, The spin temperature of high-redshift damped Lyman systems, MNRAS438 (2014) 2131–2166. arXiv:1312.3640, doi:10.1093/mnras/stt2338.