Light fragment production at CERN Super Proton Synchrotron
Abstract
Recent data on the deutron and 3He production in central Pb+Pb collisions at the CERN Super Proton Synchrotron (SPS) energies measured by the NA49 Collaboration are analyzed within the model of the three-fluid dynamics (3FD) complemented by the coalescence model for the light-fragment production. The simulations are performed with different equations of state—with and without deconfinement transition. It is found that scenarios with the deconfinement transition are preferable for reproduction rapidity distributions of deuterons and 3He, the corresponding results well agree with the experimental data. At the same time the calculated transverse-mass spectra at midrapidity do not that nice agree with the experimental data. The latter apparently indicates that coalescence coefficients should be temperature and/or momentum dependent.
pacs:
25.75.-q, 25.75.Nq, 24.10.NzI Introduction
Recently experimental data on light-fragment production in Pb+Pb collisions at SPS energies
has been published by the NA49 Collaboration Anticic:2016ckv .
These data has been already theoretically analyzed in Refs.
Anticic:2016ckv ; Sun:2017xrx ; Mrowczynski:2016xqm .
Traditionally the light-fragment data are interpreted within either the thermodynamical or coalescence
models which in fact give results quantitatively close to each other Mrowczynski:2016xqm .
The above-mentioned approaches are based on schematic fireball-like models which analyze total
(or midrapidity) yields of light fragments.
Nevertheless, the NA49 data include spectra in a wide range of rapidity and transverse
momentum rather then only total yields.
In the present study we would like to focus on the coalescence approach and
to address the questions:
(i) If the coalescence within 3D simulations is able to reproduce the
rapidity and transverse-momentum spectra
of light fragments rather than only their total (or midrapidity) multiplicities?
(ii) If these spectra are sensitive to the equation of state (EoS) used in the simulations, in particular,
to the deconfinement transition?
In the present paper the Pb+Pb collisions are simulated within the 3FD model 3FD for several collision energies in the SPS energy range. The 3FD model is quite successful in reproduction of the major part of bulk observables in this range, among those the proton rapidity Ivanov:2013wha and transverse-momentum distributions Ivanov:2013yla are relevant to the present study. Light fragment formation (deutrons, tritons, 3He and 4He) is taken into account in terms of the coalescence model, which is similar to that described in Appendix E of Ref. gsi94 .
II Coalescence in the 3FD model
Unlike the conventional hydrodynamics, where local instantaneous stopping of projectile and target matter is assumed, a specific feature of the 3FD description 3FD is a finite stopping power resulting in a counterstreaming regime of leading baryon-rich matter. This generally nonequilibrium regime of the baryon-rich matter is modeled by two interpenetrating baryon-rich fluids initially associated with constituent nucleons of the projectile and target nuclei. In addition, newly produced particles, populating the midrapidity region, are associated with a fireball fluid. Each of these fluids is governed by conventional hydrodynamic equations coupled by friction terms in the right-hand sides of the Euler equations. These friction terms describe energy–momentum loss of the baryon-rich fluids. A part of this loss is transformed into thermal excitation of these fluids, while another part gives rise to particle production into the fireball fluid.
The physical input of the present 3FD calculations is described in Ref. Ivanov:2013wha . The friction between fluids was fitted to reproduce the stopping power observed in proton rapidity distributions for each EoS, as it is described in Ref. Ivanov:2013wha in detail. The simulations in Ivanov:2013wha ; Ivanov:2013yla were performed with different EoS’s—a purely hadronic EoS gasEOS and two versions of the EoS involving the deconfinement transition Toneev06 , i.e. a first-order phase transition and a smooth crossover one. In the present study we use precisely the same parameters as those reported in Ref. Ivanov:2013wha .
The 3FD model does not describe clustering in the baryonic matter. Therefore, we need extra assumptions to calculate the fragment production. We describe the fragment production within a coalescence model, in the spirit of refs. Gutb76 ; Goss77 ; Kap80 , similar to that it was done in Ref. gsi94 . We assume that neutrons and protons, falling within a 6-dimensional phase volume at the freeze-out stage, form a -fragment. Here and are the parameters of the coalescence model, which are, in principle, different for different -fragments. Sometimes the coalescence is performed only in the momentum space, when information on the configuration space is unavailable. Such kind of the coalescence was reported, e.g., in the paper of the NA49 Collaboration Anticic:2016ckv and the above-mentioned analysis of these data Sun:2017xrx ; Mrowczynski:2016xqm . However, from the physical point of view the nucleons should be close in both momentum and configuration spaces in order to be able to merge into a fragment. Therefore, in this paper we apply the local version of the coalescence, i.e. within the 6-dimensional phase space.
The consideration below concerns a single cell in the configuration space. To avoid multiple subscripts in the notation we suppress the cell subscript. We calculate the distribution of observable -fragments as follows (cf. Goss77 ; Gupt81 )
| (1) | |||
| (2) |
where is the distribution of observable nucleons. Here , and are the total numbers of neutrons, protons and nucleons in the projectile-plus-target nuclei, respectively, , , , , and is the nucleon mass. is the total volume of the frozen-out cell, where is the freeze-out density and
| (3) |
is the total number of primordial participant nucleons. Here we denote the distributions of observable (i.e. after the coalescence) nucleons and fragments by a tilde sign, in contrast to the primordial nucleon distribution. Unlike refs. Goss77 ; Gupt81 , we formulate the coalescence in terms of invariant distributions and also introduce the factor , taking into account a vicinity in the coordinate space. This factor makes , i.e. an additive quantity suitable for the summation over cells. Defining a new parameter
| (4) |
we can write down eq. (1) in a simpler form
| (5) |
where is the distribution of observable nucleons, i.e. those after the coalescence. In this form the fragment distribution contains only a single phenomenological parameter, , that defines the total normalization of the distribution. These equations for different and form a set of equations, since the nucleon distribution in the r.h.s. is an observable distribution rather than a primordial one. To make this system closed, one should add a condition of the baryon number conservation
| (6) |
Thus calculated distribution of observable fragments is summed over all cells in order to obtain the total momentum distribution of fragments. The parameters are fitted to reproduce normalization of spectra of light fragments.
III Results
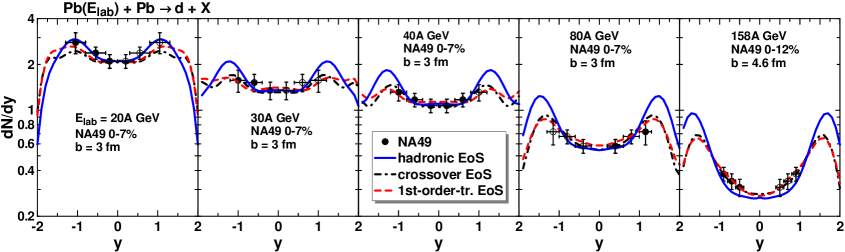
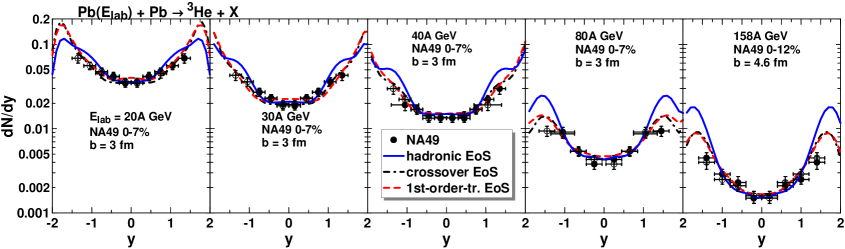
Table 1 presents results of the fit of the parameters to the NA49 data Anticic:2016ckv . There is a clear trend of reduction with collision energy rise. This can be associated with properties of the freeze-out procedure adopted in the 3FD model Russkikh:2006aa ; Ivanov:2008zi . The freeze-out locally starts when the local energy density drops below some value (0.4 GeV/fm3 in the present simulations). The thermal part of the energy density increases with the collision energy rise. Therefore, the compressional part drops, so does the freeze-out baryon density [, see Eq. (4)]. This trend is less visible in the case of 3He.
| [GeV] | 20 | 30 | 40 | 80 | 158 | |
|---|---|---|---|---|---|---|
| [MeV/c] | 513 | 471 | 466 | 431 | 425 | |
| [MeV/c] | 474 | 453 | 449 | 415 | 409 | |
| 0.61 | 0.61 | 0.57 | 0.48 | 0.43 | ||
| [MeV/c] | 606 | 563 | 562 | 550 | 563 | |
| [MeV/c] | 559 | 534 | 542 | 530 | 542 |
The above mentioned decrease of the freeze-out baryon density is illustrated in Table 1. The displayed mean freeze-out baryon density is calculated within the crossover scenario for Pb+Pb collisions at impact parameters 2.4 fm for 20-80 GeV and 4.6 fm for 158 GeV, which correspond the experimental centrality selection. In order to remove the dependence from the parameters, these parameters were reduced to the normal nuclear density ( 0.15 fm-3): , cf. Eq. (4). As it is seen from Table 1, these reduced parameters are constant in the considered energy range with the accuracy of 2%, except for the case of the collision energy of 20 GeV. Enhanced production of light fragments can be a signature of onset of the first-order phase transition at 20 GeV: the density fluctuations in the spinodal region can manifest themselves this way. The data on tritons were not analyzed because their experimental accuracy is much lower than that for deuterons and 3He.
The deduced parameters may look too high from the point of view of the coalescence performed only in the momentum space. Though, the parameters are effective momenta, cf. Eq. (4). Only momenta have a clear physical meaning. We are not able to separately determine the and parameters. However, we can estimate . The number of nucleons in the volume should not be less than two the for the case of the deuteron (or three for 3He), i.e. (or 3 for 3He). Then collecting all factors in Eq. (4), we see that the values are at least 2.5 times or more lower then ones. These are already reasonable values for the coalescence which are well comparable with those used in the Quark-Gluon String Model (QGSM) Toneev:1983cb ; Steinheimer:2012tb . In particular, if we accept the QGSM recipe Toneev:1983cb ; Steinheimer:2012tb , i.e. , we arrive at MeV/c for deuterons which is close to the values presented in Table 1.
Results for the rapidity distributions of deuterons and 3He in central Pb+Pb collisions at various SPS energies are presented in Figs. 1 and 2, respectively. As a rule, scenarios with deconfinement transition perfectly reproduce the NA49 data Anticic:2016ckv . The hadronic scenario looks preferable only for deuterons at 20 GeV. We would like to remind that these results are achieved with only a single parameter for each distribution which determines the overall normalization of the spectrum. Correspondence between the fraction of the total reaction cross section related to a data set and a mean value of the impact parameter ( in Figs. 1 and 2) was read off from the paper Alt:2003ab . Of course, this correspondence is only approximate because in fact the experimentally selected events populate a certain range of the impact parameters rather than are related a single . Moreover, the fm bin corresponds to centrality from 5% to 12.5%, while the bin of Ref. Anticic:2016ckv for the energy 158 GeV contains events with 0-12% centrality. Nevertheless, we use the fm impact parameter as an approximate representative of the 0-12% bin.
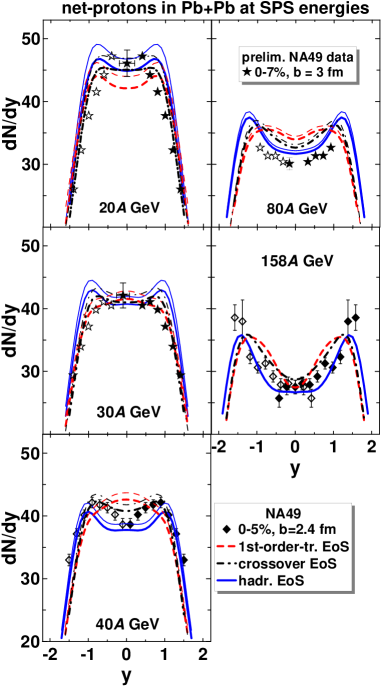
Protons bound in light fragments should be subtracted from the calculated proton yield in order to compare the latter with observable proton data. At lower SPS energies this light-fragment correction is sizable. Rapidity distributions of net-protons in central Pb+Pb collisions at SPS energies calculated with and without this correction are presented in Fig. 3. The net-proton distributions without the light-fragment correction were earlier reported in Ref. Ivanov:2013wha . The light-fragment correction is indeed noticeable at 20 GeV and improves agreement of the crossover results with experimental data. Note however that the data at 20 GeV and 30 GeV still have preliminary status, and hence it is too early to draw any solid conclusions from comparison with them. The light-fragment correction at 158 GeV is practically negligible.
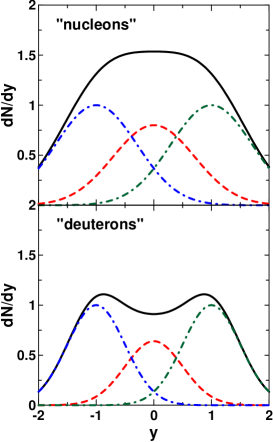
The dips in rapidity distributions of the fragments at the midrapidity are deeper than those in the corresponding proton distributions. In two cases, i.e. at 30 and 40 GeV in the first-order-transition scenario, the midrapidity peak in the proton distributions transforms into the midrapidity dip in the fragment distributions. This is an effect of the local version of the coalescence applied here, i.e. the coalescence in the 6D phase space. Let us consider a very simplified toy example. Consider a three sources contributing to the midrapidity distributions (see Fig. 4):
| (7) |
These three sources are associated with three different spatial cells of the system rather than with the three different fluids inherent in the 3FD. Moreover, these fluids are mostly unified at the freeze-out stage. The number of cells in our calculations amounts to several hundreds of thousands. In this toy nucleon distribution we consider only three of these cells just to illustrate their interplay at the local coalescence. We disregard the transverse momentum as being irrelevant to our speculation.
Thus, these sources are composed of the same already unified fluid and are located in different places of the configuration space: the central source, , and two sources located closer to the target and projectile fragmentation regions, . It is important that the strength of the central source is smaller than those of the peripheral sources. In spite of this smallness, we have a midrapidity peak in the nucleon distribution because peripheral sources also contribute to the midrapidity nucleon yield due to a thermal spread in rapidity, simulated by the Gaussian form of the sources, see upper panel of Fig. 4.
After application of the local coalescence to the distribution (7), i.e. separately to each source, the deuteron rapidity distribution reads
| (8) |
The sum of these three sources already manifests a dip at the midrapidity because the strength of the central source is now relatively smaller than that in the nucleon distribution (7) and the thermal rapidity spread of the deuteron sources is lower than that in the nucleon distributions. Thus, the midrapidity peak in the nucleon rapidity distribution transforms into the midrapidity dip in the deuteron rapidity distribution. Note that no such transformation happens if the coalescence is applied only in the momentum space, i.e. directly to the sum of the three sources in Eq. (7).
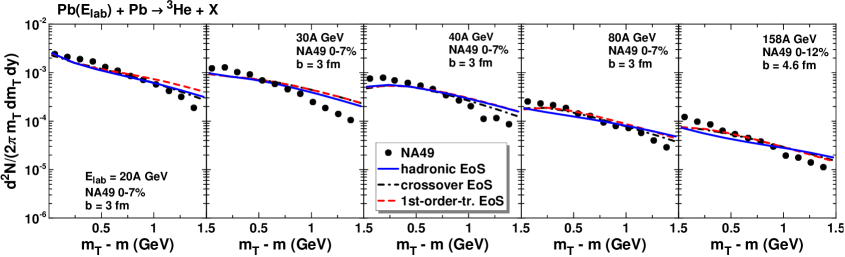
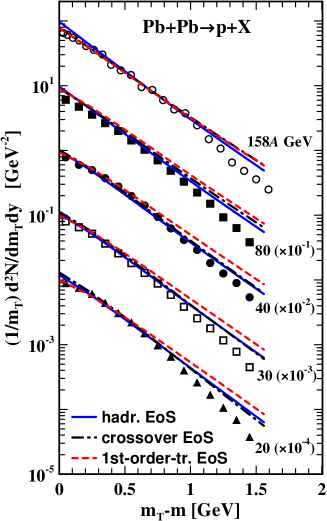
Figure 5 presents the comparison of transverse-mass spectra of 3He at midrapidity with experimental data from Ref. Anticic:2016ckv . Here the agreement with the data is not that nice as that for the rapidity distributions. Moreover, different scenarios (with and without the deconfinement transition) fail approximately to the same extent. At the same time, within all considered scenarios the midrapidity transverse-mass spectra of protons are well reproduced in the low- range Ivanov:2013yla , see Fig. 6, which is relevant to the present light-fragment data.
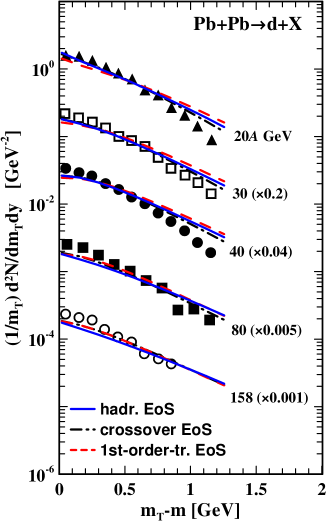
The reproduction of the data on the transverse-mass spectra Anticic:2016ckv is somewhat better in the case of deuterons, see Fig. 7. However, the same trend of disagreement survives also for deuterons. Because of the worse statistics, the deuteron data correspond to the rapidity window Anticic:2016ckv . Therefore, for the comparison with these data we took calculations at . Though, the -dependence of the deuteron transverse-mass spectra in this rapidity window is rather weak, as it results from the simulations.
Poor reproduction of the transverse-momentum spectra indicates that the constant coalescence coefficient is not the best choice. Of course, the coalescence coefficient can depend on the fragment momentum and also on the local temperature and baryon density. However, in the spirit of the local coalescence applied here the momentum should be taken in the local rest frame of the fluid element, i.e. where is the local 4-velocity of the fluid. The dependence on the baryon density in the leading order has been already taken into account in Eq. (1) by means of the exponent of the distribution of observable nucleons. All other possible dependences are ignored in Eq. (1) because they require introduction of phenomenological functional dependencies rather than only phenomenological parameters. It is intuitively clear that the coalescence coefficient should decrease with increasing local temperature. Could happen that only such a temperature dependence can improve the reproduction of the transverse-momentum spectra because the contribution of the hot regions will be suppressed. A decrease of the coalescence coefficient with increasing , i.e. the fragment energy in the local rest frame of the fluid, can additionally improve the reproduction. It is clear that introduction of any additional tuning parameter, and moreover, an additional functional form, improves agreement with the data. However, we refrain from doing this in view of ambiguity of such modifications.
IV Summary
Within the 3FD model complemented by the coalescence model at the freeze-out stage we have studied light-fragment production in Pb+Pb collisions at SPS energies and compared the obtained results with recently published data by the NA49 Collaboration Anticic:2016ckv . The simulations were performed with different equations of state—a purely hadronic EoS gasEOS and two versions of the EoS involving the deconfinement transition Toneev06 , i.e. a first-order phase transition and a smooth crossover one.
It is found that scenarios with the deconfinement transition Toneev06 are preferable for reproduction rapidity distributions of deuterons and 3He in the considered energy range, except for the case of deuterons at 20 GeV where the hadronic scenario is slightly preferable. At the same time the transverse-mass spectra are not in that nice agreement with experimental data from Ref. Anticic:2016ckv . Moreover, different scenarios (with and without the deconfinement transition) fail approximately to the same extent. This is in spite of good reproduction of the proton midrapidity transverse-mass spectra (within all considered scenarios) in the low- range Ivanov:2013yla which is relevant to the present light-fragment data. This problem could be cured by introduction of local-temperature and/or momentum dependence of the coalescence parameter that suppresses high-momentum contributions to the fragment spectra. This modification implies introduction of additional fitting parameters that by itself extends the possibility of the data reproduction. The role of the afterburner stage of the collision , i.e. the hadronic cascade after the freeze-out, is another open question. It also can change the final fragment spectra.
It would be instructive to compare the coalescence results with those of the thermodynamical approach to the light-fragment production also based on the 3FD simulations. This question can be answered within the framework of recently developed 3FD event generator complemented by the Ultra-relativistic Quantum Molecular Dynamics (UrQMD) for the afterburner stage—a Three-fluid Hydrodynamics-based Event Simulator Extended by UrQMD final State interactions (THESEUS) Batyuk:2016qmb —because the thermal fragment production has been already incorporated in it Bastian:2016xna .
Acknowledgements.
This work was carried out using computing resources of the federal collective usage center Complex for simulation and data processing for mega-science facilities at NRC ”Kurchatov Institute”, http://ckp.nrcki.ru/. Y.B.I. was supported by the Russian Science Foundation, Grant No. 17-12-01427. A.A.S. was partially supported by the Ministry of Education and Science of the Russian Federation within the Academic Excellence Project of the NRNU MEPhI under contract No. 02.A03.21.0005.References
- (1) T. Anticic et al. [NA49 Collaboration], Phys. Rev. C 94, no. 4, 044906 (2016) [arXiv:1606.04234 [nucl-ex]].
- (2) K. J. Sun, L. W. Chen, C. M. Ko and Z. Xu, arXiv:1702.07620 [nucl-th].
- (3) S. Mrowczynski, arXiv:1607.02267 [nucl-th].
- (4) Yu. B. Ivanov, V. N. Russkikh, and V.D. Toneev, Phys. Rev. C 73, 044904 (2006) [nucl-th/0503088].
- (5) Yu. B. Ivanov, Phys. Rev. C 87, 064904 (2013) [arXiv:1302.5766 [nucl-th]].
- (6) Y. B. Ivanov, Phys. Rev. C 89, no. 2, 024903 (2014) [arXiv:1311.0109 [nucl-th]].
- (7) V. N. Russkikh, Y. B. Ivanov, Y. E. Pokrovsky and P. A. Henning, Nucl. Phys. A 572, 749 (1994).
- (8) V. M. Galitsky and I. N. Mishustin, Sov. J. Nucl. Phys. 29, 181 (1979).
- (9) A. S. Khvorostukhin, V. V. Skokov, K. Redlich, and V. D. Toneev, Eur. Phys. J. C48, 531 (2006) [nucl-th/0605069].
- (10) H. Gutbrod et al., Phys. Rev. Lett. 37, 667 (1976).
- (11) I. Gosset et al., Phys. Rev. C16, 629 (1977).
- (12) J. I. Kapusta, Phys. Rev. C21, 1301 (1980).
- (13) S. Das Gupta and A. Z. Mekjian, Phys. Rep. 72, 131 (1981).
- (14) V. N. Russkikh and Yu. B. Ivanov, Phys. Rev. C 76, 054907 (2007) [nucl-th/0611094].
- (15) Yu. B. Ivanov and V. N. Russkikh, Phys. Atom. Nucl. 72, 1238 (2009) [arXiv:0810.2262 [nucl-th]].
- (16) V. D. Toneev and K. K. Gudima, Nucl. Phys. A 400, 173C (1983).
- (17) J. Steinheimer, K. Gudima, A. Botvina, I. Mishustin, M. Bleicher and H. Stocker, Phys. Lett. B 714, 85 (2012) [arXiv:1203.2547 [nucl-th]].
- (18) C. Alt et al. [NA49 Collaboration], Phys. Rev. C 68, 034903 (2003) [nucl-ex/0303001].
- (19) H. Appelshäuser et al. (NA49 Collab.), Phys. Rev. Lett. 82, 2471 (1999).
- (20) T. Anticic et al. (NA49 Collab.), Phys. Rev. C 69, 024902 (2004).
- (21) C. Alt et al. (NA49 Collab.), Phys. Rev. C 73, 044910 (2006) [nucl-ex/0512033].
- (22) C. Blume (NA49 Collab.), J. Phys. G34, S951 (2007) [nucl-ex/0701042].
- (23) T. Anticic et al. [NA49 Collaboration], Phys. Rev. C 83, 014901 (2011) [arXiv:1009.1747 [nucl-ex]].
- (24) P. Batyuk et al., Phys. Rev. C 94, 044917 (2016) [arXiv:1608.00965 [nucl-th]].
- (25) N.-U. Bastian et al., Eur. Phys. J. A 52, no. 8, 244 (2016) [arXiv:1608.02851 [nucl-th]].