XMM-Newton X-ray Observations of LkCa 15: A T Tauri Star With a Formative Planetary System
Abstract
High-resolution ground-based images of the T Tauri star LkCa 15 have revealed multiple companions that are thought to comprise a formative planetary system. The candidate protoplanets orbit at distances 15 - 20 AU within the dust-depleted inner region of the circumstellar disk. Because of its young age (1 - 4 Myr), LkCa 15 provides a benchmark system for testing planet-formation models. We detected LkCa 15 as a bright X-ray source in a short 10 ks Chandra observation in 2009. We report here new results obtained from a deeper 37 ks XMM-Newton observation in 2014. The new data provide better sampling in the time domain and improved sensitivity at low energies below 1 keV. Spectral fits with thermal emission models require at least two temperature components at kTcool 0.4 keV and kThot 2.2 keV. The value of kThot is about a factor of two less than inferred from Chandra, suggesting that the hot-component temperature is variable. The best-fit absorption column density is in good agreement with that expected from optical extinction estimates AV 1.3 - 1.7 mag. The intrinsic X-ray luminosity is Lx(0.2 - 10 keV) = 3 1030 ergs s-1. Estimates of the X-ray heating rate of the inner disk and protoplanets are sensitive to the assumed disk gas surface density for which recent ALMA observations give estimates 102 g cm-2 at 1 AU from the star. At such densities, X-ray heating is confined mainly to the upper disk layers and X-ray penetration through the disk midplane to the protoplanets at 15 - 20 AU is negligible.
1 Introduction
Although several thousand exoplanets have now been discovered333For a current catalog of exoplanets, see the NASA Exoplanet Archive database at http://http://exoplanetarchive.ipac.caltech.edu., examples of exoplanets orbiting young pre-main sequence (PMS) stars are rare. The identification of planet-hosting young stars of ages a few Myr and study of their circumstellar disks provide valuable insight into the circumstellar environment in which planets (and planetary systems) form and how the planets affect disk properties such as gas and dust distribution. As such, observational studies of disks and exoplanets around PMS host stars provide crucial constraints on planet-formation models.
Perhaps the most striking example to emerge so far of a PMS star hosting a protoplanet, and possibly even a protoplanetary system, is the accreting classical T Tauri star (cTTS) LkCa 15 in the Taurus star-forming region (Table 1). In a remarkable discovery, Kraus & Ireland (2012, hereafter KI12) reported the direct detection using infrared masked aperture interferometry of a suspected protoplanet at a projected separation of 71.9 1.6 mas from LkCa 15. The protoplanet is located in the dust-depleted inner region of the LkCa 15 disk at a deprojected orbital radius of 16 - 20 AU. Further monitoring in the near-IR has detected possible orbital motion of the protoplanet (Ireland & Kraus 2014).
Extensive and ongoing studies of the disk surrounding the host star LkCa 15 at infrared, (sub)millimeter, and radio wavelengths show that it is severely depleted of dust inside a radius of 45 - 50 AU (Andrews et al 2011a,b - hereafter A11a,b; Isella et al. 2012, 2014; Espaillat et al. 2008, 2010; Thalmann et al. 2014, 2016). Although the inner region is dust-depleted, there is still gas present as revealed by 12CO and 13CO observations (Piétu et al. 2007; van der Marel et al. 2015). Also, Isella et al. (2014) detected a compact 7 mm continuum source with the Very Large Array (VLA) at the position of the central star. They conclude that the 7 mm emission is not consistent with a stellar photospheric origin but could be due to either millimeter size grains near the star or ionized gas in the vicinity of the star. Plausible explanations for the dust-clearing in the inner disk are variable dust grain sizes and opacity (Isella et al. 2012) or dynamical clearing by one or more orbiting objects (A11a,b), with the latter explanation currently favored.
The possibility that more than one protoplanet might be present has received some recent support from new high-contrast near-IR imaging and adaptive optics H imaging of LkCa 15 obtained by Sallum et al. (2015). They report the detection of three distinct objects with best-fit orbital semi-major axes in the range 14.7 - 18.6 AU. One of these objects is the suspected protoplanet that was designated as LkCa 15b by KI12 but is referred to as LkCa 15c by Sallum et al. (2015). The latter authors obtain a semi-major axis = 18.6 (2.5, 2.7) AU for this object. They also report the direct near-IR and H detection of an object orbiting closer to the star at = 14.7 (2.1) AU which they characterize as an accreting protoplanet. A third fainter object at 18 AU was detected at L′-band only and its properties are not yet well-constrained. Studies of the inner disk and candidate protoplanets are ongoing. High spatial resolution scattered light images of the inner disk of LkCa 15 based on J-band imaging polarimetry have now been obtained by Thalmann et al. (2016). Their images show structure from scattering material at the positions of the candidate protoplanets which they argue could be responsible for some of the signal reported in previous aperture-masking observations.
The likely presence of a formative planetary system around LkCa 15 provides an unprecedented opportunity to study the early stages of planet formation in detail at high effective spatial resolution given the modest distance of 140 pc to the Taurus star-forming region. Our study presented here focuses on the effects of X-ray irradiation by the central star on the gas-dominated inner disk. We detected LkCa 15 as a bright X-ray source in a previous Chandra observation and provided initial estimates of the X-ray ionization and heating rates in the inner disk (Skinner & Güdel 2013, hereafter SG13).
We report here the results of a more recent X-ray observation of LkCa 15 obtained with XMM-Newton. These observations provide better sensitivity at low energies below 1 keV where X-ray absorption due to intervening gas becomes important. The improved low-energy sensitivity provides tighter constraints on the absorption toward the star as measured by the equivalent neutral hydrogen column density NH, and the intrinsic (unabsorbed) X-ray luminosity (Lx). Fits of the XMM-Newton spectra confirm the earlier Chandra result that cool and hot plasma components are present but the temperature of the hot component is lower than was measured with Chandra and variability of the hotter plasma seems likely. X-ray ionization and heating rates of the inner disk are recomputed based on the new XMM-Newton results and revised inner disk model parameters from recent ALMA observations.
The importance of the effects of X-ray and extreme-ultraviolet (EUV) radiation on disks and protoplanetary systems around young stars has been noted in several previous studies of which two examples are Igea & Glassgold (1999; hereafter IG99) and Cecchi-Pestellini, Ciaravella, & Micela (2006). X-ray and EUV emission ionizes and heats disk gas (especially in the outer surface layers), affects disk chemistry, accretion, and mass-loss (via photoevaporation), and strengthens the coupling between the accretion disk and the stellar magnetic field. Since X-rays influence mass-loss and disk dissipation they are one of the factors that constrain the timescale for planet formation.
| Property | Value | Refs. |
|---|---|---|
| Sp. type | K52 | 1,2 |
| Age (Myr) | 2 [1 - 4] | 3 |
| M∗ (M⊙) | 1.0 | 4 |
| R∗ (R⊙) | 1.6 | 2 |
| Teff (K) | 4730 | 1 |
| AV (mag) | 0.62; 1.3 - 1.7 | 1,2 |
| (deg.) | 50.5 - 52 | 5 |
| Mdisk (M⊙) | 0.1 | 5,6 |
| d (pc) | 140 | 7 |
| L∗ (L⊙) | 0.74 - 1.2 | 4,8 |
| log Lx (ergs s-1) | 30.47 [30.40-30.52] | 9,10 |
Note. — Refs. (1) Kenyon & Hartmann 1995 (2) Espaillat et al. 2010 (3) Kraus & Hillenbrand 2009 (4) Simon et al. 2000 (5) Isella et al. 2012 (6) van der Marel et al. 2015 (7) Torres et al. 2009 (8) Andrews et al. 2011b (9) Skinner & Güdel 2013 (10) this work
2 Previous Chandra Observation
We obtained a 9.8 ks Chandra observation (ObsId 10999) of LkCa 15 on 27 December 2009 using the ACIS-S (Advanced CCD Imaging Spectrometer) array. Results were presented by SG13 and are briefly summarized here. LkCa 15 was detected with 590 net counts (0.2 - 8 keV). No statistically significant variability was present in the X-ray light curve. Acceptable spectral fits were obtained using a two-temperature (2T) thermal plasma model and abundances typical of TTS in Taurus. The best-fit model gave an absorption column density NH = 3.7 [2.4-5.1] 1021 cm-2 and plasma temperatures kTcool = 0.30 [0.25 - 0.37 keV], kThot = 5.1 [3.0 - 13.6] keV, where brackets enclose 90% confidence intervals. The intrinsic (unabsorbed) luminosity was log Lx(0.3 - 10 keV) = 30.4 ergs s-1 at an assumed distance of 140 pc.
3 XMM-Newton Observation
The XMM-Newton observation (ObsId 0722340101) began on 20 February 2014 at 19:12 UTC and ended on 21 February at 06:02 UTC. Data were acquired with the European Photon Imaging Camera (EPIC) in Full-Frame mode using the Medium optical blocking filter. EPIC provides charge-coupled device (CCD) imaging spectroscopy from the pn camera (Strüder et al. 2001) and two nearly identical MOS cameras (MOS1 and MOS2; Turner et al. 2001). The EPIC cameras have energy coverage in the range E 0.2 - 15 keV with energy resolution E/E 20 - 50. The MOS cameras provide the best on-axis angular resolution with FWHM 4.3′′ at 1.5 keV.
Data were reduced with the XMM-Newton Science Analysis System (SAS vers. 15.0) using standard procedures including the filtering of raw event data to select good event patterns and removal of data within time intervals of high background radiation. The usable exposures obtained after removing high background intervals and total exposures (in parentheses) were 27.8 (36.04) ks for pn, 35.8 (37.70) ks for MOS1, and 36.6 (37.67) ks for MOS2. Thus, about 22% of the pn exposure was adversely affected by high background but the MOS exposures were not severely affected.
A circular region centered on LkCa 15 with a radius r = 20′′ (80% encircled energy at 1.5 keV) was used to extract X-ray light curves and spectra. Background analysis was conducted on circular source-free regions near the source. The SAS tasks rmfgen and arfgen were used to generate source-specific RMFs and ARFs for spectral analysis. The data were analyzed using the HEASOFT Xanadu software package.
4 Results
Figure 1 shows the EPIC pn image of LkCa 15 and its surroundings. LkCa 15 is prominently detected at pn centroid position R.A. = 04h 39m 17s.79, decl. = 22∘ 21′ 03′′.08 (J2000). The previous Chandra observation had somewhat better spatial resolution and gave an X-ray position R.A. = 04h 39m 17s.787, decl. = 22∘ 21′ 03′′.28 (SG13). These X-ray positions are in good agreement with the HST GSC v2.3 position R.A. = 04h 39m 17s.787, decl. = 22∘ 21′ 03′′.26. Evidence for binarity in LkCa 15 has so far not been found (Nguyen et al. 2012).
There are no other X-ray sources in the immediate vicinity of LkCa 15. The nearest EPIC source detected by the pipeline processing software lies more than 1′ from LkCa 15. The K5 star HD 284589 located 27.′′6 north of LkCa 15 is not detected, nor was it detected by Chandra. The only other bright stellar X-ray source in the EPIC field-of-view is the eclipsing Algol-type binary system NSVS 6777197 (2MASS J043946282211503) located 11′ southeast of LkCa 15 (Fig. 1). Its X-ray properties are summarized further below.
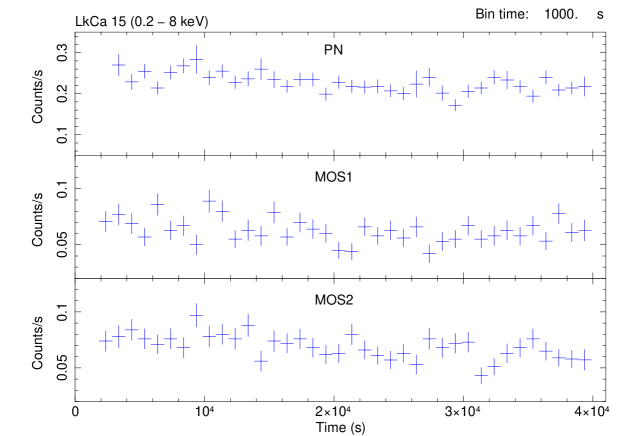
The EPIC light curves of LkCa 15 are shown in Figure 2. No large-amplitude fluctuations or flares are present but there is a slow falloff in the count rate during the observation. Checks for variability on binned background-subtracted broad-band (0.2 - 8 keV) light curves using the test give a high variability probability. Using 1000 s bins, the probability of variability is Pvar(0.2 - 8 keV) = 0.96 (pn), 0.99 (MOS1), and 0.98 (MOS2).
Figure 3 compares the EPIC pn spectrum with the previous Chandra ACIS-S spectrum and shows an overlay of the two EPIC MOS spectra. A notable difference is that there is no significant emission below 0.5 keV in the ACIS-S spectrum but the higher EPIC pn effective area at low energies reveals detectable emission down to 0.2 keV. This leads to a more reliable determination of NH from the EPIC pn spectrum since lower-energy photons are more susceptible to absorption. The only line feature clearly visible is the Ne X Ly line at 1.02 keV which is seen in both MOS spectra. There is also a weak feature at 1.86 keV in the pn spectrum that may be Si XIII.
Spectra were fitted using the Astrophysical Plasma Emission Code variable-abundance vapec model in XSPEC version 12.8.2 (Smith et al. 2001). Photoelectric absorption was applied using the XSPEC wabs model to determine the equivalent hydrogen column density (NH). A two-temperature (2T) vapec model was required to obtain acceptable fits. A comparison of fit results for two vapec models using different abundances is given in Table 2. Significant improvement relative to the solar-abundance fit is obtained by allowing the abundances of Ne and Fe to vary (model A in Table 2). Very little further improvement in the fit is obtained by letting the abundances of other metals to deviate from solar values. Model B uses typical TTS abundances for the Taurus Molecular Cloud (Güdel et al. 2007; Scelsi et al. 2007), as were adopted in the Chandra analysis (Model C of SG13). The Ne abundance inferred from Model A is Ne = 2.4 [2.07 - 2.71] times solar, but the generic Taurus abundances (Model B) keep the value fixed at Ne = 0.83 times solar.
The EPIC fit results for Models A and B are overall quite similar. Cool plasma at kT1 0.4 keV is required by both models, consistent with the value obtained from previous Chandra ACIS-S data (SG13). A hotter component at kT2 2.1 - 2.4 keV is also required. This temperature is about a factor of two lower than was inferred from Chandra, which gave kT2 4 - 5 keV. The 90% confidence levels from EPIC are kT2 = [1.93 - 2.40] keV (model B), which does not overlap the corresponding ACIS-S range kT2 = [3.0 - 13.6] keV. This suggests that the temperature of the hot component is variable. Model B associates a larger percentage of the volume emission measure with the cool plasma component, as determined by the XSPEC normalization parameter ().
The best-fit absorption column density is consistent with that expected from AV = 1.3 - 1.7 (Table 1; Espaillat et al. 2010). Using the NH to AV conversion of Vuong et al. (2003), model A gives AV = 1.4 [1.3 - 1.6] and model B yields AV = 1.8 [1.7 - 1.9]. The Gorenstein (1975) coversion gives AV values that are about 25% lower than above. Thus, there is no convincing evidence for excess X-ray absorption above that expected from AV. The ratio of X-ray to stellar luminosity from the EPIC fits is log Lx(0.2 - 10 keV)/L∗ = 3.16 to 3.06. This ratio is in good agreement with other TTS in Taurus as determined by Telleschi et al. (2007).
NSVS 6777197: The star NSVS 6777197 was serendipitously detected as a bright X-ray source by EPIC pn (Fig. 1) and MOS2, but was outside the MOS1 field-of-view. It was classified as a detached Algol binary with a 3.928 d period by Drake et al. (2014). Algol-type binaries usually have one component of late spectral type and are often detected as bright coronal X-ray sources (Singh, Drake, & White 1996). Large X-ray flares can occur as seen in the prototype Algol (Schmitt & Favata 1999). But the EPIC X-ray light curves of NSVS 6777197 show no significant variability. Simultaneous spectral fits of the pn and MOS2 spectra with a 2T thermal plasma model give an absorption column density NH = 1.78 [1.57 - 2.04] 1021 cm-2, kTcool = 0.92 [0.79 - 1.04] keV, kThot = 2.60 [2.23 - 3.26] keV, and iron abundance Fe = 0.22 [0.10 - 0.36] solar, where brackets enclose 90% confidence intervals. The absorbed (and unabsorbed) fluxes are Fx(0.2-10 keV) = 7.2 10-13 (1.10 10-12) ergs cm-2 s-1.
| Parameter | ||
|---|---|---|
| Model | A | B |
| EmissionaaModels A and B are of form: NH(kT1 kT2) | Thermal (2T) | Thermal (2T) |
| Abundances | non-solarccAll abundances were held fixed at their solar values except for Ne and Fe which were allowed to vary and converged to Ne = 2.37 [2.07 - 2.71] and Fe = 0.45 [0.39 - 0.53] relative to their solar values. | non-solarddAbundances were held fixed at typical values for TTS in Taurus (Güdel et al. 2007; Scelsi et al. 2007). These are (relative to solar): H = 1.0, He = 1.0, C = 0.45, N = 0.79, O = 0.43, Ne = 0.83, Mg = 0.26, Al = 0.50, Si = 0.31, S = 0.42, Ar = 0.55, Ca = 0.195, Fe = 0.195, Ni = 0.195. |
| NH (1022 cm-2) | 0.23 [0.21 - 0.25] | 0.29 [0.27 - 0.31] |
| kT1 (keV) | 0.41 [0.39 - 0.44] | 0.40 [0.39 - 0.42] |
| kT2 (keV) | 2.39 [2.20 - 2.59] | 2.08 [1.93 - 2.40] |
| norm1 (10-4)bbFor thermal models, the norm is related to the volume emission measure (EM = nV) by EM = 41014dnorm, where dcm is the stellar distance in cm. At d = 140 pc this becomes EM = 2.341056 norm (cm-3). | 2.75 [2.31 - 3.29] | 8.26 [7.33 - 9.28] |
| norm2 (10-4)bbFor thermal models, the norm is related to the volume emission measure (EM = nV) by EM = 41014dnorm, where dcm is the stellar distance in cm. At d = 140 pc this becomes EM = 2.341056 norm (cm-3). | 3.06 [2.91 - 3.21] | 4.22 [3.84 - 4.50] |
| /dof | 862.0/634 | 850.4/636 |
| 1.36 | 1.34 | |
| FX (10-12 ergs cm-2 s-1) | 0.55 (1.13) | 0.54 (1.43) |
| FX,1 (10-12 ergs cm-2 s-1) | 0.23 (0.64) | 0.24 (0.92) |
| FX,2 (10-12 ergs cm-2 s-1) | 0.32 (0.49) | 0.29 (0.51) |
| log LX (ergs s-1) | 30.42 | 30.52 |
| log LX,1 (ergs s-1) | 30.18 | 30.33 |
| log LX,2 (ergs s-1) | 30.06 | 30.08 |
| log [LX/L∗] | 3.16 | 3.06 |
Note. — Based on XSPEC (version 12.8.2) simultaneous fits of the background-subtracted EPIC spectra (pn, MOS1, MOS2) binned to a minimum of 10 counts per bin with high background time intervals removed. The fits were obtained with 2T optically plasma models. The tabulated parameters are absorption column density (NH), plasma energy (kT), and XSPEC component normalization (norm). Abundances are referenced to the solar values of Anders & Grevesse (1989). Square brackets enclose 90% confidence intervals. The total X-ray flux (FX) and fluxes associated with each model component (FX,i) are the absorbed values in the 0.2 - 10 keV range, followed in parentheses by unabsorbed values. The total X-ray luminosity LX and luminosities of each component LX,i are unabsorbed values in the 0.2 - 10 keV range and assume a distance of 140 pc. A value L∗ = 1.0 L⊙ is adopted based on an average of values given in the literature.
5 Discussion
5.1 X-ray Heating and Ionization
Disk X-ray heating is due to fast electrons ejected by atoms during X-ray ionization. A complete discussion of the methodology for computing the X-ray ionization rates () and heating rates () in the disk can be found in the Chandra study of LkCa 15 (SG13) and the references cited below. We have recomputed the disk ionization and heating rates for LkCa 15 based on plasma temperature (kTx) and X-ray luminosity (Lx) values determined from the XMM-Newton spectral fits (Table 2). The revised rates for the cool and hot plasma components are summarized in Table 3.
5.1.1 Disk Model
A disk model must be adopted in order to compute X-ray ionization and heating rates. A key disk parameter is the density of H-nuclei (nH), which is required to compute the X-ray absorption and heating rate per unit volume at a given position in the disk. The value of nH is determined by the disk gas surface density which is not yet well-constrained observationally in the inner disk because of limitations on telescope angular resolution, especially at (sub)-mm wavelengths.
A cylindrical coordinate system is used to specify positions (,) in the disk where the radial coordinate is the distance in the midplane from the center of the star to the specified point and is the height above the disk midplane. Azimuthal symmetry is assumed. We adopt a radial disk temperature profile of the form T() = 400(/1 AU)-0.5 K based on a stellar effective temperature Teff = 4730 K. Vertical temperature gradients are ignored (IG99). For the above temperature relation and adopted stellar parameters (Table 1) the disk scale height at = 1 AU is H0 H( = 1 AU) = 7.1 1011 cm and scales as H() .
We adopt a simple power-law for the gas surface density = (/1 AU)q, normalized to = 102 g cm-2 and a power-law exponent = 1. This simple power-law ignores the additional exponential decay term included in the surface density profiles of A11b and van der Marel et al. (2015) since its value is near unity for the inner disk radii 15 AU of interest here. The above value of is comparable to that determined from the recent studies of Manara et al. (2014) and van der Marel et al. (2015) but must be interpreted as an order-of-magnitude estimate due to several factors that limit our knowledge of the gas distribution in the spatially-unresolved inner disk (Sec. 5.2). We also note that the value of adopted here is much higher than the value = 10-3 g cm-2 used in SG13 that was based on the earlier LkCa 15 disk study of A11b (Sec. 5.2).
We adopt the abundance ratio He/H = 0.1 by number and assume that hydrogen in the disk is predominantly molecular. The mass density at the midplane is (,=0) = 0.4/H which at = 1 AU gives (=1 AU,=0) = 5.63 10-16 g cm-3. The number density of H-nuclei is given by nH = /(mp) where mp is the proton mass and = 1.42 for H-nuclei (Glassgold et al. 2004).
5.1.2 Disk Ionization and Heating
Calculation of the X-ray ionization and heating rates in the disk is based on the analytic results of Glassgold et al. (1997a, hereafter G97a; Glassgold et al. 1997b), IG99, Shang et al. (2002; hereafter S02), and Glassgold et al. (2004). The X-ray emission is modeled as a thermal plasma with a characteristic temperature Tx. The ionization rate scales as the inverse-square of the distance from the source according to (eq. [3.9] of S02):
| (1) |
In the above, fixes the height of the X-ray source above (or below) the disk center to mimic X-ray production in coronal loops. We use Rx = 4R∗ = 6.4 R⊙ = 4.45 1011 cm as in previous studies (G97a, S02, SG13) but the results are not very sensitive to the adopted value of Rx (IG99). The energy required to produce an ion pair is 37 eV. The term accounts for X-ray attenuation as a function of optical depth , where the latter depends on the photon energy and position in the disk. The term = E0/kTx applies a low-energy cutoff E0 to the X-ray spectrum to account for wind absorption (IG99, S02). We use E0 = 0.1 keV here, as in previous work (S02, SG13). Figure 3 of SG13 shows the effect of decreasing the cutoff energy to E0 = 0.01 keV.
The primary ionization rate is given by (S02):
| (2) |
where = is the energy-dependent photoelectric X-ray absorption cross-section per H nucleus. It is evaluated using the expression = (E/1 keV)-p cm-2 where = 2.27 10-22 cm2 and = 2.485 for solar-abundance disk plasma (G97a). Numerical values of for the cool and hot plasma components are given in Table 3 notes.
The X-ray optical depth used to compute the attenuation factor is
| (3) |
where the vertically-integrated column density from infinity down to the height z above the disk midplane is
| (4) |
In general, will be smaller for the hot component at a given point in the disk, allowing the harder emission from the hot component to penetrate deeper into the disk. Note that for a given energy and height , the optical depth is independent of as the result of a cancellation that occurs for the adopted surface density profile . Also, it is worth emphasizing that the height above the midplane corresponding to = 1 depends sensitively on the adopted value of the gas surface density as shown in Figure 4. At a given distance from the star, smaller adopted values of correspond to lower scale heights and deeper X-ray penetration into the disk. The ionization rate for the cool and hot components as a function of is plotted in Figure 5.
The X-ray heating rate per unit volume is (G12)
| (5) |
where is the heating rate per ionization. Several processes can affect the heating rate as discussed by G12. For predominantly molecular disk gas at 1 AU and the range of densities for the LkCa 15 inner disk (Table 3) we adopt = 17 eV = 2.72 10-11 ergs, as in previous studies (SG13, G12). The X-ray heating rate then becomes
| (6) |
The heating rates at = 1 AU given in Table 3 can be scaled to other radii using the scaling relations for and nH given in Table 3 notes. For the specific model adopted in this study the heating rate scales according to as illustrated in Figure 6. As apparent from Figure 6 and Table 3, the X-ray heating is mostly due to the cool component as a result of its larger absorption cross-section and higher X-ray luminosity (Lx,1). But for the disk model adopted here, X-ray ionization and heating are confined mainly to upper layers several scale heights above the midplane (Figs. 4 and 5). For the X-ray photon energies E 2.2 keV that characterize the LkCa 15 XMM-Newton spectrum, gas surface densities 10-2 g cm-2 would be required in order for photons to penetrate to deeper layers within one scale height of the midplane (Fig. 4). Although such low surface densities were surmised in some early disk models of LkCa 15 (A11b), more recent ALMA observations (van der Marel et al. 2015) suggest higher gas densities a few hundred g cm-2
| r | z/H0 | E | nH | N⟂ | |||
|---|---|---|---|---|---|---|---|
| (AU) | (keV) | (g cm-2) | (cm-3) | (cm-2) | (s-1) | (ergs s-1 cm-3) | |
| 1 | 5.0 | 0.4 | 100 | 9.80e07 | 1.35e19 | 2.46e-09 | 6.56e-12 |
| 1 | 4.1 | 2.2 | 100 | 5.55e09 | 9.30e20 | 2.39e-11 | 3.61e-12 |
Note. — The ionization rate () and heating rate () for the cool (E = 0.4 keV) and hot (E = 2.2 keV) components are based on the inner disk model discussed in the text (Sec. 5.1.1). The rates are computed at = 1 AU for the specified value /H0, which is the number of scale-heights above the midplane corresponding to unit X-ray optical depth ( = 1). At = 1 AU the disk scale height is H0 H(r = 1 AU) = 7.1 1011 cm for an assumed disk midplane temperature T( = 1 AU) = 400 K. A disk gas surface density (r = 1 AU) = 100 g cm-2 is assumed, but the actual value is uncertain and model-dependent. The quantity nH is the number density of H-nuclei at the specified point (,) in the disk. The vertically-integrated H-nuclei column density from infinity down to the specified height above the midplane is N⟂ (eq. [4]). At = 1 AU, values at the midplane ( = 0) are nH(=1 AU,=0) = 2.38 1013 cm-3 and N⟂(=1 AU,=0) = 2.1 1025 cm-2. The primary ionization rates (eq. [2]) for the cool and hot plasma components are = 2.53 10-6 s-1 and = 4.31 10-9 s-1, respectively. These values are computed using the average kT and Lx values for the two models in Table 2, namely = 0.4 keV, = 2.2 keV, log = 30.26 ergs s-1, and log = 30.07 ergs s-1. The heating rate = nH (eq. [5]) is computed using Q = 17 eV. Scaling Relations: H() T(), or H() for an assumed temperature dependence T() = 400(/1 AU)-0.5. Scalings with radius are , , , . At a given radius, = )exp[-0.5(].
5.2 Comments on Circumstellar Disk Models
Several different inner disk models have been proposed for LkCa 15 and the model adopted in our calculations above is only representative. We have assumed = (/1 AU)q with = 1 and a gas surface density = 102 g cm-2. The adopted value of is similar to those determined in recent studies but is about an order-of-magnitude less than values derived in models of the minimum mass solar nebula (Weidenschilling 1977; Hayashi 1981). By way of comparison, Manara et al. (2014) found ( = 1 AU) = 83 g cm-2 for LkCa 15. Also, substitution of the LkCa 15 disk parameters determined in the ALMA study of van der Marel et al. (2015) into the surface density profile given in their eq. (1) yields ( = 1 AU) = 286 g cm-2. This value includes their best-fit correction factor = 0.1 which scales down the gas density in the inner disk (1 45 AU) relative to the better-known gas distribution at larger radii. But van der Marel et al. note that the value of is only constrained to within an order-of-magnitude. Several factors contribute to its uncertainty including inadequate spatial resolution to resolve gas in the inner disk, optical depth effects in the 12CO line used to map the disk gas with ALMA, and possible asymmetries in the gas distribution. The much smaller surface density ( = 1 AU) = 10-3 g cm-2 obtained previously by A11b reflects differences in observational data and modeling strategy. The LkCa 15 disk model proposed in A11b was based on 880 m dust continuum observations obtained with the Submillimeter Array (SMA) and assumed an empty cavity devoid of dust and gas at radii 10 50 AU.
The value of the gas surface density power-law exponent is not well-constrained observationally in the inner disk but = 1 is commonly used for LkCa 15 (e.g. Mulders et al. 2010; Manara et al. 2014; van der Marel et al. 2015). But other surface density profiles have been proposed such as the smooth viscous disk model of Isella et al. (2012) which uses a positive value = 2.15 in the inner disk. In this model, the surface density increases in the inner disk and then starts to turn over at 60 AU to match the observationally-constrained falloff in the outer disk (Fig. 3 of Isella et al. 2012). The smooth viscous model contrasts sharply with the discontinuous drop in at 50 AU in the model of A11b. The above differences are relevant to X-ray ionization and heating calculations in the inner disk where the protoplanets are located since the radial dependence of the density of H-nuclei is a function of the power-law index as n for an assumed temperature dependence T() .
We have adopted a disk temperature profile T() = T0(/1 AU)β K with the usual exponent = 0.5 and normalized to T0 = 400 K for a stellar temperature Teff = 4730 K. Other studies have used T0 = 100 K (A11a), 200 K (Manara et al. 2014), 250 K (Piétu et al. 2007, scaled to = 1 AU), and 334 K (Bergin et al. 2004, scaled to = 1 AU and Teff = 4730 K). The temperature inferred from the ALMA study of van der Marel et al. (2015) is T0 = 424 K, which is scaled from the dust sublimation radius T( = 0.08 AU) = 1500 K using = 0.5. This latter value is nearly identical to that adopted here.
The adopted disk temperature profile enters into X-ray ionization and heating rate calculations through the scale height H() T()+0.5. This in turn affects the mass-density and H-nuclei number density nH at the midplane (Sec. 5.1.1). At a given radius, a higher disk midplane temperature equates to a larger scale height H() and smaller nH. But the dependence is weak and scales as nH() T()-0.5, so a factor of two uncertainty in T0 translates into only a factor of 1.4 uncertainty in nH at = 1 AU.
5.3 Comparison With Cosmic Ray Heating
It is instructive to compare the X-ray heating rates in Table 3 with the rate expected from cosmic rays. The cosmic ray heating rate for a gas consisting of H and H2 is (Jonkheid et al. 2004)
| (7) |
where the primary cosmic ray ionization rate in the interstellar medium (ISM) is 5 10-17 s-1. We assume that the LkCa 15 disk is predominantly molecular hydrogen and the second term in the above expression is negligible. At = 1 AU the molecular hydrogen density at scale heights corresponding to = 1 are half the nH values given in Table 3, namely n = 4.9 107 cm-3 ( = 5.0 H0, 0.4 keV photons) and 2.8 109 cm-3 ( = 4.1 H0, 2.2 keV photons). We thus obtain (=1AU, =5.0 H0) = 6.12 10-20 ergs cm-3 s-1 and (=1AU, =4.1 H0) = 3.48 10-18 ergs cm-3 s-1. These values are 106 - 108 times less than the X-ray heating rates. Thus, in the upper disk layers X-ray heating dominates and cosmic ray heating is negligible by comparison. But at the midplane, X-ray heating is negligible for the surface density assumed here ( = 102 gm cm-2) whereas cosmic ray heating is (=1AU, =0) = 1.49 10-14 ergs cm-3 s-1.
The winds and magnetic fields of T Tauri stars can impede penetration of cosmic rays into the protoplanetary disk, resulting in values of that are less than the value appropriate for the ISM used above. The effects of T Tauri star winds and magnetic fields on cosmic rays were investigated by Cleeves et al. (2013) who concluded that reduced primary cosmic ray ionization rates of 10-18 s-1 are possible in protoplanetary disks, an order-of-magnitude less than rates typically adopted for the ISM. The effect of such lower cosmic ray ionization rates would be to reduce cosmic ray heating near the disk midplane and strengthen the relative importance of X-ray heating in the upper disk layers.
6 X-ray Irradiation of the Protoplanets and Circumplanetary Disks
The analysis above has focused on X-ray irradiation of the LkCa 15 circumstellar disk but an assessment of X-ray effects on the atmospheres or circumplanetary disks of the protoplanets is also of interest. At present, little is known about the atmospheric properties of the LkCa 15 protoplanets or their disks. But the detection of H emission from the innermost protoplanet at 14.7 AU by Sallum et al. (2015) does provide evidence that it is accreting and a circumplanetary disk is likely present. However, an attempt to detect 7 mm continuum emission using the VLA within the inner disk gap where the LkCa 15 protoplanets are located yielded negative results (Isella et al. 2014). Thus, crucial information on the temperature and surface density distribution of the planetary atmospheres and circumplanetary disks needed to calculate X-ray absorption and heating is lacking.
Nevertheless, we can show that if the LkCa 15 circumstellar disk surface density at a distance = 1 AU from the star is of order 102 g cm-2, as assumed in our calculations above, then little if any stellar X-ray emission reaches protoplanets that are near the midplane ( 0) at distances of 15 - 20 AU. At a distance from the star the intrinsic stellar X-ray flux Fx is reduced to Fxe/ where where (E) is the energy-dependent X-ray optical depth through the circumstellar disk evaluated at the target point (). Assuming as before = (/1 AU)-1 and = 102 g cm-2 then we obtain by Equation (4) N⟂,disk(r=15 AU,z=0) = 1.4 1024 cm-2. Using Equation (3) the optical depths for the cool and hot plasma components are computed to be (=15 AU,=0,E=0.4 keV) = 1.6 106 and (=15 AU,=0,E=2.2 keV) = 2.3 104. T Tauri stars may undergo intermittent bright X-ray flares during which plasma temperatures can briefly reach peak temperatures T 100 - 250 MK (E 9 - 22 keV) as has been well-documented in the Taurus Molecular Cloud (Franciosini et al. 2007) and Orion Nebula Cluster (Favata et al. 2005). No such high-temperature flares have been detected in LkCa 15 so far but optical depth calculations for the above range of peak values give (=15 AU,=0,E=9 keV) = 685 and (=15 AU,=0,E=22 keV) = 74. At these large optical optical depths it is obvious that any protoplanets located in or near the circumstellar disk midplane at 15 AU will be shielded quite effectively from direct stellar X-ray emission.
The main uncertainty in the above calculations originates in the assumed surface density profile = (/1 AU)q. As already mentioned (Sec. 5.2), the normalization and power-law exponent are not well-constrained by observations for LkCa 15, and the dependence of with radius could be more complex than a simple power-law. But in order for stellar X-rays to penetrate through the circumstellar disk midplane to reach the protoplanets, much lower surface densities than assumed above would be required. Since for fixed (E), values 10-3 g cm-2 (as in the model of A11b; see also SG13) would be needed to achieve (=15 AU,=0,E) 1. If the gas density is not currently that low it will eventually become so as the star-disk system evolves and the inner-disk gas dissipates.
7 Summary
A pointed observation of LkCa 15 with XMM-Newton confirms that it is a luminous X-ray source, as previously inferred from a shorter Chandra observation. Although some low-level count-rate variability is likely present in the XMM-Newton X-ray light curves, no large-amplitude variability or flares were detected. The X-ray spectrum is characterized by a two-temperature thermal plasma with temperatures kTcool 0.4 keV and a hotter component at kThot 2.2 keV. The temperature of the hot component is about half that determined from the Chandra spectrum, suggesting that the hot component is variable as is often the case in T Tauri stars. Most of the X-ray ionization and heating of the circumstellar disk is due to the cool component. X-ray heating is restricted mainly to the upper disk layers assuming a disk gas surface density at = 1 AU of 102 g cm-2, as suggested by recent ALMA observations. Cosmic-ray heating is negligible compared to X-ray heating in the upper disk layers but few X-ray photons reach the disk midplane, where cosmic ray heating dominates. Unless the disk gas surface density is much less than the assumed value 102 g cm-2, little or no stellar X-ray emission is able to penetrate the circumstellar disk midplane to distances of 15 - 20 AU where the protoplanets are located.
References
- (1) Anders, E., & Grevesse, N. 1989, Geochim. Cosmochim. Acta, 53, 197
- (2) Andrews, S.M., Rosenfeld, K.A., Wilner, D.J., & Bremer, M. 2011b, ApJ, 742, L5 (A11a)
- (3) Andrews, S.M., Wilner, D.J., Espaillat, C., et al. 2011b, ApJ, 732, 42 (A11b)
- (4) Balbus, S.A. & Hawley, J.F. 1991, ApJ, 376, 214
- (5) Bergin, E., Calvet, N., Sitko, M.L. et al. 2004, ApJ, 614, L133
- (6) Cecchi-Pestellini, C., Ciaravella, A., & Micela, A. 2006, A&A, 458, L13
- (7) Cleeves, L.I., Adams, F.C., & Bergin, E.A. 2013, ApJ, 772, 5
- (8) Drake, A.J., Graham, M.J., Djorgovski, S.G. et al. 2014, ApJS, 213, 9
- (9) Espaillat, C., Calvet, N., Luhman, K.L., Muzerolle, J., & D’Alessio, P. 2008, ApJ, 682, L125
- (10) Espaillat, C., D’Alessio, P., Hernanández, J. et al. 2010, ApJ, 717, 441
- (11) Favata, F., Flaccomio, E., Reale, F. et al. 2005, ApJS, 160, 469
- (12) Franciosini, E., Pillitteri, I., Stelzer, B. et al. 2007, A&A, 468, 485
- (13) Glassgold, A.E., Najita, J., & Igea, J. 1997a, ApJ, 480, 344 (G97a)
- (14) Glassgold, A.E., Najita, J., & Igea, J. 1997b, ApJ, 485, 920
- (15) Glassgold, A.E., Najita, J., & Igea, J. 2004, ApJ, 615, 972
- (16) Gorenstein, P., 1975, ApJ, 198, 95
- (17) Güdel, M. et al. 2007, A&A, 468, 353
- (18) Igea, J. & Glassgold, A.E. 1999, ApJ, 518, 848 (IG99)
- (19) Hayashi, C. 1981, Supp. Progress Theor. Phys., 70, 35
- (20) Ireland, M.J. & Kraus, A.L. 2014, in Exploring the Formation and Evolution of Planetary Systems, Proc. IAU Symposium No. 299, eds. M. Booth, B.C. Matthews, & J.R. Graham (Cambridge U. Press), 199
- (21) Isella, A., Chandler, C.J., Carpenter, J.M., Pérez, L.M., & Ricci, L. 2014, ApJ, 788, 129
- (22) Isella, A., Pérez, L.M., & Carpenter, J.M. 2012, ApJ, 747, 136
- (23) Jonkheid, B., Faas, F.G.A., van Zadelhoff, G.-J., & van Dischoeck, E.F. 2004, A&A, 428, 511
- (24) Kenyon, S.J. & Hartmann, L. 1995, ApJS, 101, 117
- (25) Kraus, A.L. & Hillenbrand, L.A. 2009, ApJ, 704, 531
- (26) Kraus, A.L. & Ireland, M.J. 2012, ApJ, 745, 5 (KI12)
- (27) Manara, C.F., Testi, L., Natta, A., Rosotti, G., Benisty, M., Ercolano, B., & Ricci, L. 2014, A&A, 568, A18
- (28) Mulders, G.D., Dominik, C., & Min, M. 2010, A&A, 512, A11
- (29) Nguyen, D.C., Brandeker, A., van Kerkwijk, M.H., & Jayawardhana, R.J. 2012, ApJ, 745, 119
- (30) Piétu, V., Dutrey, A., & Guilloteau, S. 2007, A&A, 467, 163
- (31) Sallum, S., Follette, K.B., Eisner, J.A. et al. 2015, Nature, 527, 342
- (32) Scelsi, L., Maggio, A., Micela, G., Briggs, K., & Güdel, M. 2007, A&A, 473, 589
- (33) Schmitt, J.H.M.M. & Favata, F. 1999, Nature, 401, 44
- (34) Shang, H., Glassgold, A.E., Shu, F.H., & Lizano, S. 2002, ApJ, 564, 853 (S02)
- (35) Simon, M., Dutrey, A., & Guilloteau, S. 2000, ApJ, 545, 1034
- (36) Singh, K.P., Drake, S.A., & White, N.E. 1996, AJ, 111, 2415
- (37) Skinner, S.L. & Güdel, M. 2013, ApJ, 765, 3 (SG13)
- (38) Smith, R.K., Brickhouse, N.S., Liedahl, D.A., & Raymond, J.C. 2001, ApJ, 556, L91
- (39) Strüder, L. et al., 2001, A&A, 365, L18
- (40) Telleschi, A., Güdel, M., Briggs, K.R., Audard, M., & Palla, F. 2007, A&A, 468, 425
- (41) Thalmann, C., Mulders, G.D., Hodapp, K. et al. 2014, A&A, 566, 51
- (42) Thalmann, C., Janson, M., Garufi, A. et al. 2016, ApJ, 828, L17
- (43) Torres, R.M., Loinard, L., Mioduszewski, A.J., & Rodriguez, L.F., 2009, ApJ, 698, 242
- (44) Turner, M.J.L. et al., 2001, A&A, 365, L27
- (45) van der Marel, N., van Dishoeck, E.F., Buderer, S., Pérez, L., & Isella, A. 2015, A&A, 579, A106
- (46) Vuong, M.H., Montmerle, T., Grosso, N., Feigelson, E.D., Verstraete, L., & Ozawa, H. 2003, A&A, 408, 581
- (47) Weidenschilling, S.J. 1977, Ap&SS, 51, 153