Vol.0 (200x) No.0, 000–000
33institutetext: MIT Haystack Observatory, Off Route 40, Westford, MA 01886, USA
44institutetext: GEPI, CNRS, Observatoire de Paris/PSL, 92195 Meudon Cedex, France
H i emission from the red giant Y CVn with the VLA and FAST
Abstract
Imaging studies with the VLA have revealed H i emission associated with the extended circumstellar shells of red giants. We analyse the spectral map obtained on Y CVn, a J-type carbon star on the AGB. The H i line profiles can be interpreted with a model of a detached shell resulting from the interaction of a stellar outflow with the local interstellar medium. We reproduce the spectral map by introducing a distortion along a direction corresponding to the star’s motion in space. We then use this fitting to simulate observations expected from the FAST radiotelescope, and discuss its potential for improving our description of the outer regions of circumstellar shells.
keywords:
stars: AGB and post-AGB — stars: carbon — stars: individual: Y CVn – radio lines: stars1 Introduction
Asymptotic Giant Branch (AGB) stars are undergoing substantial mass loss, and are often surrounded by extensive circumstellar envelopes. This phenomenon dominates the last phases of the life of the majority of stars, and is important for the evolution of the interstellar medium (ISM) and, more generally, for the chemical evolution of galaxies.
The injection of stellar matter in the ISM occurs at large distances from the central stars in regions where molecules (apart from possibly H2, Morris & Jura 1983) have not survived photodissociation by the UV photons of the interstellar radiation field. Dust (Cox et al. 2012), H2 (Martin et al. 2007), and atomic hydrogen (H i, Gérard & Le Bertre 2006) are the main tracers of these regions. Only the latter provides the high spectral resolution which is needed for describing the kinematics in these regions. However, the emission is weak and often confused by the competing emission from the ISM on the same lines of sight.
Several sources have been detected in H i by the Nançay Radiotelescope (NRT; Gérard & Le Bertre 2006), the Very Large Array (VLA; Matthews et al. 2013), and the Green Bank Telescope (Matthews et al. 2015). In general the H i emission is observed with a narrow line profile ( 5 km s-1), sometimes accompanied with a wider component (Gérard & Le Bertre 2006). The narrow line profiles provide direct evidence for the slowing down of the stellar winds by their local ISM. The broad components should trace the central regions of the outflows. Furthermore, the images often reveal a “head-tail” morphology (Matthews et al. 2008) indicating a distortion of the external shells resulting from the motion of the star through the ISM.
The new generation of radiotelescopes that is under development is expected to transform this field of research, thanks to their high sensitivity and improved spatial resolution. In particular, the Five-hundred-meter Aperture Spherical radio Telescope (FAST) has a combination of angular resolution and sensitivity to large-scale emission that is well-matched to the needs for studying H i shells around nearby ( 1 kpc) AGB stars. To examine this potential we selected one source well characterized in H i thanks to observations obtained with the NRT and the VLA. In particular the VLA data allow us to prepare simulations of what should be obtained with FAST.
2 Y CVn
Y CVn is a carbon star of the peculiar J-type, i.e. with a relatively high 13C abundance (12C/13C = 4; Abia & Isern 1997), and no evidence of technetium (Little et al. 1987). Basic parameters have been compiled in Table 1. For the distance, we adopt the parallax from Hipparcos (van Leeuwen 2007), and scale all other parameters to the corresponding distance. IRAS has revealed a detached shell (Young et al. 1993), that has been imaged at 90 m by ISO (Izumiura et al. 1996). At a distance of 321 pc, it appears with an inner radius of 0.26 pc (2.8′), and outer one of 0.48 pc (5.1′). The CO line profiles indicate a wind with an expansion velocity 8 km s-1. The mass loss rate in Table 1 is taken from Knapp et al. (1998) and scaled to the adopted distance.
Le Bertre & Gérard (2004), observing with the NRT (beamwidth: 4′ in right ascension and 22′ in declination), reported H i emission at 21 cm in a line peaking at 20.5 km s-1, close to the centroid of the CO line (cf. Table 1). The line profile is composite, with a narrow component of width 2.9 km s-1 (FWHM, Full Width at Half Maximum), and a broad component of width 14.3 km s-1. The narrow component has been interpreted as an evidence of the slowing down of the wind revealed by the CO emission, and detected in H i through the broad component.
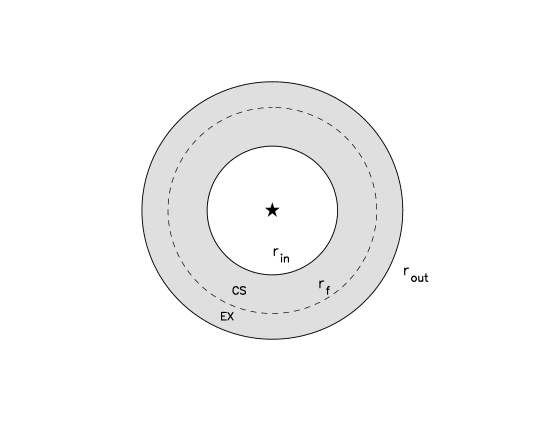
Libert et al. (2007) developed a spherical model in which the stellar outflow is abruptly slowed down from 8 km s-1 to 2 km s-1 at a termination (or reverse) shock which is located at the inner radius (rin) of the detached shell revealed by IR images. The forward shock, where external matter is compressed by the expanding shell, is located at the outer radius (rout) of the IR detached shell. In this picture, a detached shell is formed by compressed stellar and interstellar material separated by an interface located at rf, where the two media are in contact (Lamers & Cassinelli 1999). This approach allowed Libert et al. to fit the H i line profiles obtained at various positions with the NRT. Some technical details are given in the Appendix.
Y CVn has been observed in H i with the VLA in the D configuration (i.e. with baselines up to 1.0 km) by Matthews et al. (2013, M2013). They present a map with a much better spatial resolution () than that offered by the NRT. The H i shell appears offset with respect to the star position by 1′ in a direction opposite to the stellar motion. It shows a broken ring structure with a dearth of emission ahead of the star. The spatially integrated emission globally coincides with the IR emission at 90 m detected by ISO, even though it differs in some details (M2013), in particular with a less circular and more clumpy H i emission.
Although the integrated line profile agrees with that used by Libert et al. (2007) the original model developed by Libert et al. does not agree well with the spatial distribution of the H i emission observed at the VLA (M2013). However using the same modeling approach, but adjusting the mass loss rate and the duration, Hoai (2015) could obtain a better fit of the circularly symmetrized H i emission.
| Y CVn | reference | |
| spectral type | C5,4J(N3) | General Catalogue of Variable Stars (Samus+ 2007-2013) |
| pulsation period (d) | 157 | idem |
| Teff(K) | 2760 | Bergeat et al. (2001) |
| d (pc) | 321 | Hipparcos (van Leeuwen 2007) |
| Vlsr(km s-1) | 21.1 | Knapp et al. (1998) |
| Vexp(km s-1) | 7.8 | idem |
| Ṁ (M⊙ yr-1) | 2.4 | idem |
| V3D(km s-1), PA(deg) | 35.4, 30.1 | Matthews et al. (2013) |
| VHI(km s-1) | 20.6 | Le Bertre & Gérard (2004) |
3 H i modeling of the VLA spectral map
A spectral map based on the observations of M2013 was derived by extracting spectra over a grid of 1414′, centered roughly on the star with steps of 50′′ in right ascension and declination, corresponding to approximately one beam diameter. The channel width corresponds to 1.28 km s-1. The spectral map is shown in Fig. 1 (black lines).
We start from the spherical model developed by Libert et al. (2007), and improved by Hoai et al. (2015). The stellar effective temperature is larger than 2500 K (cf. Table 1), implying that hydrogen is mainly in atomic form in the atmosphere and outwards (Glassgold & Huggins 1983). We adopt a constant mass loss rate, with a value as close as possible to that obtained from CO estimates (Table 1), and assume that all hydrogen is in atomic form. For the expansion velocity of the free wind we adopt the value obtained from the CO line profile. An arbitrary temperature profile is adopted between the two limits, rin and rout, with a logarithmic dependence from rin to rf, and a constant temperature from rf to rout.
As explained in Sect. 2, the circularly symmetrized H i emission can be reproduced with the Libert et al. model, subject to a reduction of the mass loss rate (by a factor 2 relative to the estimate from CO data) and a corresponding increase of the duration for the detached shell formation (Table 2, Hoai 2015). An average mass loss rate lower than the present day value may mean that the hypothesis of a constant mass loss rate over years is too simplistic. (However, the change that is now implied is much less than the one of about two orders of magnitude, initially suggested by Izumiura et al. (1996).)
| Ṁ (M⊙ yr-1) | 1.3 |
|---|---|
| duration (yrs) | 7 |
| Vexp (km s-1) | 8.0 |
| rin (arcmin, pc) | 2.8, 0.26 |
| rf (arcmin, pc) | 4.0, 0.37 |
| rout (arcmin, pc) | 5.1, 0.48 |
| temperature index | –6.0 |
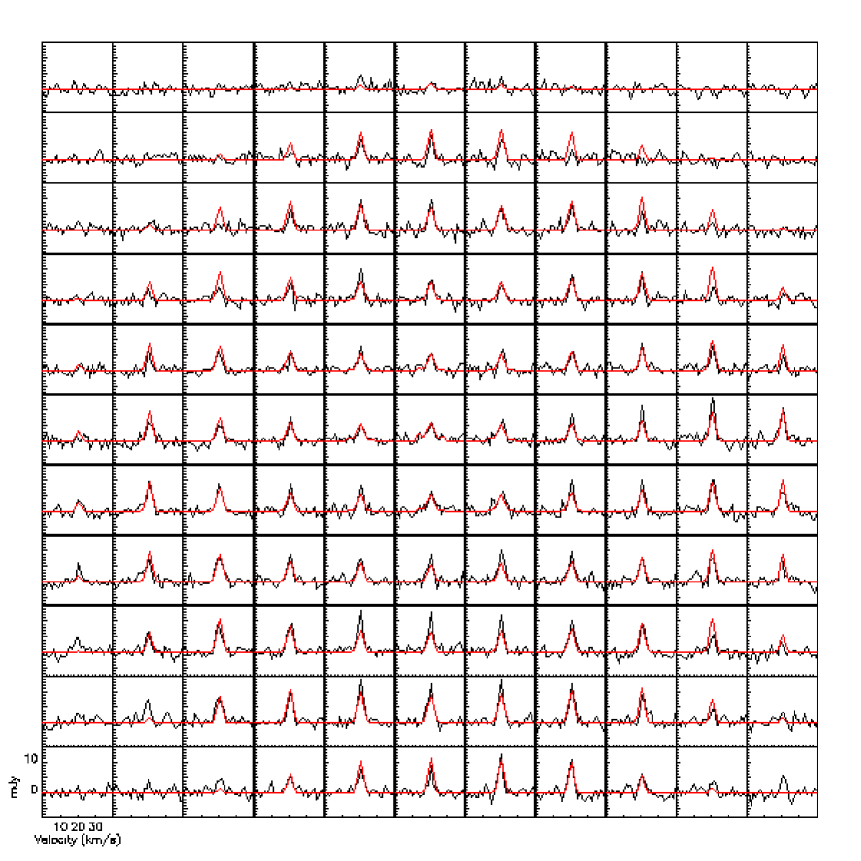
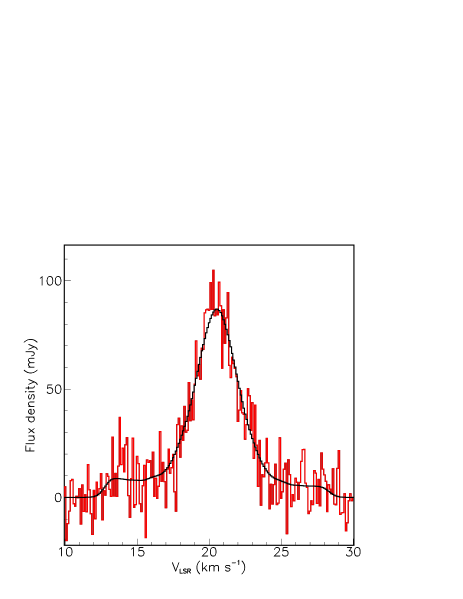
In order to reproduce the distortion in the direction of motion observed in the VLA image of Y CVn, we also apply a geometrical factor to the distance of each parcel of gas from the central star, such that the morphology becomes elongated along this direction. For that purpose, we apply a factor (1 + a sin ), with being counted from a plane perpendicular to the direction of motion and towards this direction. A good fit of the spectral map (red lines in Fig. 1), obtained by a least-square minimization of all spectra simultaneously, gives a = 0.17. The general trends are reproduced, although not the details such as the broken structure of the ring. The narrow spectral component dominates the map with a peak flux density of 10 mJy. In addition, in the central panel of the map, one can identify two side peaks of 3 mJy at 14 and 28 km s-1 (see also Fig. 2), separated by 14 km s-1 ( 2Vexp). Although at the limit of detection ( 1.3 mJy), they could reveal the freely flowing stellar wind. As the line profile is not rectangular, it suggests that the corresponding region is spatially resolved. The size would thus be at least , already much larger than the size of the region traced by CO (, Neri et al. 1998).

4 Simulations for FAST
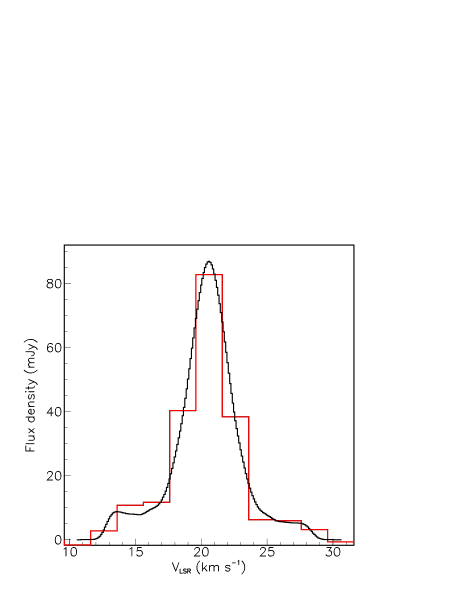
FAST has an illuminated aperture of 300 m (Nan et al. 2011). To simulate an observation of Y CVn, we convolve the model obtained in Sect. 3 by the response of a FAST beam at 21 cm. We adopt a gaussian beam profile of FWHM = 2.9′. The result is shown in Fig. 3.

Observing Y CVn with FAST will allow us to determine the line profiles in much better detail than with the VLA. This is important for constraining the kinematics and the physical properties of the gas in the detached shell. It would be interesting also to search for emission outside the limits defined by the image obtained at 90 m by ISO: M2013 noted that, although similar in the main features, the H i and the ISO images differ in the details. A spectral characterization of the differences will allow us to understand better the coupling between gas and dust.
The high sensitivity reached by FAST would allow us to investigate the presence of gas emitting outside the velocity range defined by CO observations. In the case of Mira, Matthews et al. (2008) report a gradient of velocity along the tail with a centroid velocity trailing from +45 km s-1 on the stellar position, to +22 km s-1 2 degrees away. Unpublished spectra from the NRT on Y CVn suggest the presence of an H i emission between +6 km s-1 and +12 km s-1, possibly extending south.
Finally the freely expanding wind will be better detected and in particular it should be possible to constrain the extent of its region, which presently is only assumed to be identical to the inner dust shell. The FAST beam width being comparable in size to the inner radius of the dust shell, a coupling of the model with H i observations should allow us to compare the relative positions of gas and dust. From the line profile, for which we predict asymmetrical wings (Fig. 4), we can see that it is possible to also constrain the morphology of this region along the line of sight if a sensitivity of 2 mJy over 5 km s-1 could be reached. The broad component is detected by the VLA on the line of sight to the central star (Fig. 2), and also when the spectrum is integrated in a circumstellar aperture of 2.8′ radius centered on the star (M2013, Fig. 16). However, the VLA data have an insufficient Signal-to-Noise Ratio for characterizing the details of the free flowing wind region. On the other hand, the large collecting area of FAST can bring the high sensitivity which is needed.

Assuming a gain of 16 K/Jy and a system temperature of 30 K, a sensitivity of 1 = 10 mJy per 0.1 km s-1 channel should be reached in 5 minutes (Fig. 5, left panel). This spectral resolution and sensitivity are needed to explore the properties of the detached shell. For the free-flowing region a lower spectral resolution could be allowed. The same sensitivity would translate to 2 mJy over 2 km s-1, enough to detect an asymmetry between the two wings of the broad component (Fig. 5, right panel). A 12 map of Y CVn, with a 1.5′ step, corresponding to Nyquist sampling, and assuming a single receiver, would require 5-6 hours. This is only a rough estimate as the observing time would depend on the availability of a multi-beam receiver, the strategy of observation, and the exact sampling used in the observations. In particular, Mangum et al. (2007) recommend a sampling of at least twice Nyquist for on-the-fly imaging (i.e. 5 points per FWHM rather than 2). The details of the observing programme should be defined in concertation with FAST experts.
Being a giant single-dish radiotelescope, FAST will be optimized in surface brightness sensitivity for spatial structures filling its beam. It will thus be particularly suited for revealing the inner regions of nearby ( 1 kpc) circumstellar shells which are traced by the broad components of the H i emission and whose sizes are expected to be a few arcminutes. Evolved stars with large mass loss rate (up to 10-4 M⊙ yr-1) may be surrounded by circumstellar shells with fast winds sweeping up the ISM at large distances (up to 2.5 pc, Villaver et al. 2002). The H i emission from these shells has been modeled by Hoai et al. (2015), but presently has not been detected unambiguously, possibly for an insufficient surface brightness sensitivity.
5 Prospects
Our approach is empiric, but allows us to approximately reproduce the original VLA data. It thus can be useful for preparing simulations of observations that could be obtained with the new generation of radiotelescopes. Such simulations are useful because only a few observations with good signal-to-noise ratio are available. The radiotelescopes presently under development will bring spatially resolved line profiles of better quality for circumstellar shells around evolved stars, and a phenomenological description can be useful for exploiting the new data. However, it would be more satisfactory to have a genuine physical modeling of these sources, not only for preparing the new observations but also for interpreting them.
An important improvement would consist in the inclusion of a cooling law for determining the temperature profile of matter having crossed the termination shock instead of using an arbitrary temperature profile. It is important because for a subsonic wind, the kinematics and the temperature distribution are coupled, and because in these objects the separation between the forward shock and the reverse shock is comparable to the size of the system.
Another improvement would consist in modeling the effect of the motion of the star through the interstellar medium on the circumstellar shell instead of using an arbitrary distortion of the circumstellar shell. Villaver et al. (2003, 2012) have developed such models. However, as shown by Hoai et al. (2015) the temperature of the gas in these models is too high to account for the narrow width of the observed line profiles (which brings us back to the previous argument). Finally, stellar evolution incorporating mass loss rate and expansion velocity may also need to be taken into account (Villaver et al. 2002, 2012). Conversely, H i observations should help to constrain it.
6 Conclusions
We have developed simulations that allow us to predict H i fluxes and line profiles expected on a prototypical source that could be observed with FAST. The high sensitivity to H i surface brightness, which is expected from this new facility, is opening up exciting prospects for the observations of extended shells around nearby red giants.
An observation such as that proposed on Y CVn would provide an excellent illustration of the FAST potential, and as well bring useful informations for constraining wind-ISM interaction models. The high spectral resolution should reveal kinematic effects presently not accessible in the VLA data. The high sensitivity should also give full access to the freely expanding wind region (which appears truncated by photodissociation when observed with molecular tracers) and allow us to constrain its morphology.
Our approach can as well be used for making simulations of images that will be obtained with future interferometers such as the ngVLA (next generation VLA) and the SKA (Square Kilometre Array). However, it is somewhat limited by the hypotheses that are presently made (arbitrary temperature profile and distortions of the circumstellar shells). Therefore, the development of hydrodynamic models would be useful, and as well, considerably improve our understanding of the interaction between stellar winds and the ISM.
Acknowledgements.
We are grateful to P. Darriulat and P. N. Diep for their continuous encouragements and stimulating comments. The VLA observations discussed here were part of NRAO program AM1001. Financial support is acknowledged from the Vietnam National Satellite Centre (VNSC/VAST), the NAFOSTED funding agency, the World Laboratory, the Odon Vallet Foundation and the Rencontres du Viet Nam. We also thank the PCMI programme of the CNRS for financial support.References
- [1997] Abia, C., & Isern, J., 1997, MNRAS, 289, L11
- [2001] Bergeat, J., Knapik, A., & Rutily, B., 2001, A&A, 369, 178
- [2012] Cox, N. L. J., et al., 2012, A&A, 537, A35
- [1997] Dyson, J. E., & Williams, D. A., 1997, The Physics of the Interstellar Medium, 2nd ed, Institute of Physics Publishing, Bristol
- [2006] Gérard, E., & Le Bertre, T., 2006, AJ, 132, 2566
- [1983] Glassgold, A. E., & Huggins, P. J., 1983, MNRAS, 203, 517
- [2015] Hoai, D. T., 2015, PhD thesis (https://ufe.obspm.fr/theses/rechercher/31)
- [2015] Hoai, D. T., Nhung, P. T., Gérard, E., Matthews, L. D., Villaver, E., & Le Bertre, T., 2015, MNRAS, 449, 2386
- [1996] Izumiura, H., Hashimoto, O., Kawara, K., Yamamura, I., & Waters, L. B. F. M., 1996, A&A, 315, L221
- [1998] Knapp, G. R., Young, K., Lee, E., & Jorissen, A., 1998, ApJS, 117, 209
- [1997] Lamers, H. J. G. L. M., & Cassinelli, J. P., 1999, Introduction to Stellar Winds, Cambridge Univ. Press, Cambridge
- [2004] Le Bertre, T., & Gérard, E., 2004, A&A, 419, 549
- [2007] Libert, Y., Gérard, E., & Le Bertre, T., 2007, MNRAS, 380, 1161
- [1987] Little, S. J., Little-Marenin, I. R., & Hagen Bauer, W., 1987, AJ, 94, 981
- [2007] Mangum, J. G., Emerson, D. T., & Greisen, E. W., 2007, A&A, 474, 697
- [2007] Martin, D. C., Seibert, M., Neill, J.D., et al., 2007, Nature, 448, 780
- [2015] Matthews, L. D., Gérard, E., & Le Bertre, T., 2015, MNRAS, 449, 220
- [2013] Matthews, L. D., Le Bertre, T., Gérard, E., & Johnson, M. C., 2013, AJ, 145, 97 (M2013)
- [2008] Matthews, L. D., Libert, Y., Gérard, E., Le Bertre, T., & Reid, M. J., 2008, ApJ, 684, 603
- [1983] Morris, M., & Jura, M., 1983, ApJ, 264, 546
- [2011] Nan, R., Li, D., Jin, C., Wang, Q., Zhu, L., Zhu, W., Zhang, H., Yue, Y., & Qian, L., 2011, International Journal of Modern Physics D, 20, 989
- [1998] Neri, R., Kahane, C., Lucas, R., Bujarrabal, V., & Loup, C., 1998, A&AS, 130, 1
- [2007] van Leeuwen, F., 2007, ASSL, 350
- [2002] Villaver, E., García-Segura, G., & Manchado, A., 2002, ApJ, 571, 880
- [2003] Villaver, E., García-Segura, G., & Manchado, A., 2003, ApJ, 585, L49
- [2012] Villaver, E., Manchado, A., & García-Segura, G., 2012, ApJ, 748, 94
- [1993] Young, K., Phillips, T. G., & Knapp, G. R., 1993, ApJS, 86, 517
7 Appendix
A star undergoing mass loss gets surrounded by an expanding circumstellar shell. However at some distance, the supersonic wind interacts with external matter (Lamers & Cassinelli 1999). It produces a shell of denser material which has been detected around many evolved stars through thermal emission by dust (Young et al. 1993). For a long time the gas in these detached shells remained undetected, mainly because of the photodissociation of molecules by UV photons from the interstellar radiation field. Following the detection of atomic hydrogen in the detached shell of Y CVn (Le Bertre & Gérard 2004) and other stars (Gérard & Le Bertre 2006), Libert et al. (2007) developed a simple model of the detached shell around Y CVn.
Libert et al. assume spherical symmetry, stationarity, and gas in atomic form,with 10 percent of 4He and 90 percent of H. A detached shell is produced by the abrupt slowing down of the stellar flow at a termination shock (rin, Fig. 6). At this inner boundary, the gas is heated to a temperature Vexp2 (Dyson & Williams 1997). Beyond rin, the gas is expanding at 1/4Vexp, and then slower and slower as it cools down. Libert et al. (2007) adopt a logarithmic temperature profile. This assumption allows them to write in a simple way the equation of motion, which in this condition depends only on the logarithmic temperature index. Its value is selected such as to obtain a good fit to the H i line profiles. The outer limit (rout) of the detached shell is defined by the leading shock at which external matter is compressed by the expanding shell. Between rin and rout the detached shell is composed of compressed circumstellar matter (CS in Fig. 6) and interstellar matter (EX in Fig. 6) separated by a contact discontinuity located in rf. The interstellar matter which is incorporated in the detached shell corresponds to that originally occupying the sphere of radius rout at the galactic location of the central star. The duration of the mass loss process is selected such as to fit the spatially integrated intensity of the H i emission, assuming a constant mass loss rate from the central star. The equation of motion is solved numerically between the two limits of the detached shell. Temperature, velocity and density are then used to calculate the line profiles for any desired position on the sky and beam profile. Although crude, this modelling allowed Libert et al. (2007) to reproduce the spatial distribution and line profiles of the H i emission observed at low angular resolution by the NRT, adopting for the mass loss rate of Y CVn a value obtained from CO observations (“present day” mass loss rate).
However, the data obtained with a better spatial resolution by the VLA (Matthews et al. 2013) did not agree as well, and led Hoai (2015) to relax the mass loss rate value, and correspondingly the age of the detached shell. The new value is obtained through a least-square minimization on the VLA spectral map. In the present work, we improve the quality of the fit by introducing an artificial deformation of the detached shell shape (Sect. 3).