Two transient X-ray Quasi-Periodic Oscillations separated by an intermediate state in 1H 0707-495
Abstract
In the narrow-line Seyfert 1 galaxy 1H 0707-495, recently a transient quasi-periodic oscillation (QPO) signal with a frequency of Hz has been detected at a high statistical significance. Here, we reanalyze the same set of XMM-Newton data observed on 2008 February 4 with the Weighted-Wavelet Z-transform (WWZ) method. In addition to confirming the previous findings, we also find another QPO signal with a frequency of Hz in a separated X-ray emission phase at the significance level of . The signal is also found fitting an auto-regressive model though at a lower significance. The frequency ratio between these two signals is . The analysis of other XMM-Newton measurements of 1H 0707-495 also reveals the presence of the Hz ( Hz) QPO signal on 2007 May 14 (2010 September 17) at the significance level of (). The QPO frequency found in this work follows the relation reported in previous works spanning from stellar-mass to supermassive black holes. This is the first time to observe two separated transient X-ray QPO signals in active galactic nuclei (AGNs), which sheds new light on the physics of accreting supermassive black holes.
Subject headings:
galaxies: active - galaxies: nuclei - galaxies: individual (1H 0707-495) - X-rays: galaxies1. INTRODUCTION
Active galactic nuclei (AGNs), the most persistent luminous sources of electromagnetic radiation in the universe, are widely believed to be powered by the accretion of material onto supermassive black holes (SMBHs). Narrow-line Seyfert 1 galaxies (NLS1s) serve as a peculiar subclass of AGNs, with common definition based on their optical spectrum (a narrow width of the broad Balmer emission lines with FWHM (H) 2000 km , along with strong optical lines and weak forbidden lines) (Osterbrock & Pogge, 1985; Goodrich, 1989; Pogge, 2000). Other extreme properties include rapid X-ray variability, near-Eddington accretion rates as well as strong star formation of the host galaxies, indicating a rapidly growing phase of their central black holes (Komossa, 2008). Furthermore, the -ray emissions of NLS1s (Abdo et al., 2009; Liao et al., 2015) render them a new member of the jetted-AGN family. Therefore, the studies of NLS1s are essential to have a through understanding of the AGN phenomena.
Periodic emissions are well detected in X-ray light curves of Galactic binary systems (Bolton, 1972; Webster & Murdin, 1972; Ackermann et al., 2012) and the periodic variability studies can be powerful diagnostic tools (Remillard & McClintock, 2006). However, in AGNs, the periodicity is relatively rare. Some detections or evidences for periodic variabilities in optical, X-ray, and/or gamma-ray emission of AGN have been reported in the literature (Kidger et al., 1992; Valtonen et al., 2006; Ackermann et al., 2015; Reis et al., 2012; Zhang et al., 2017a; Covino et al., 2017). In X-rays, a significant transient QPO has been detected in NLS1 galaxy RE J1034+396 (Gierliński et al., 2008). Recently, the other significant transient QPO signal has been reported in NLS1s galaxy 1H 0707-495 (Pan et al., 2016) and Mrk 766 (Zhang et al., 2017b). In this work, we re-analyze the data set adopted by Pan et al. (2016) with the Weighted-Wavelet Z-transform method. In addition to confirm previous finding, we find a new QPO signal in the early part of the light-curve with a period cycle of 8240 s at the confidence level of . These two QPO signals, with a frequency ratio of , are separated by an intermediate state. Interestingly, in two other observation data sets these signals appeared, though individually and at lower significance levels. Our conclusions are thus further strengthened.
2. Observation and Data Analysis
2.1. The construction of X-ray light curves
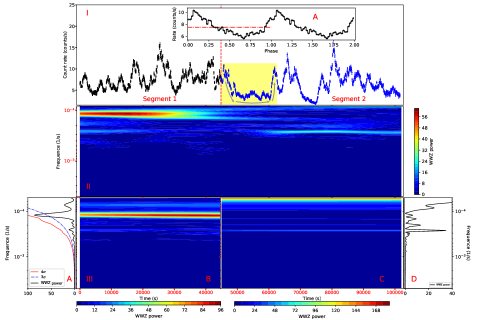
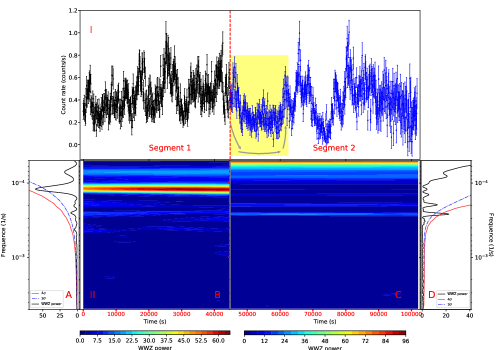
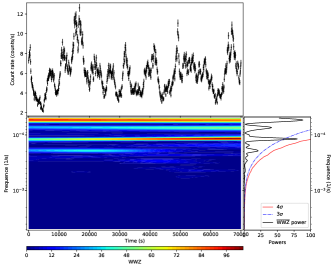
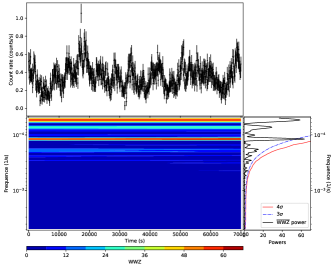
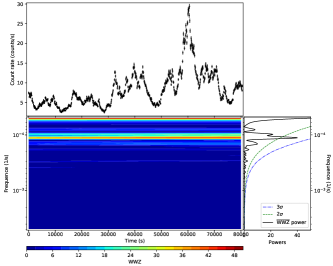
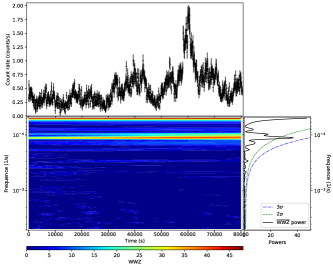
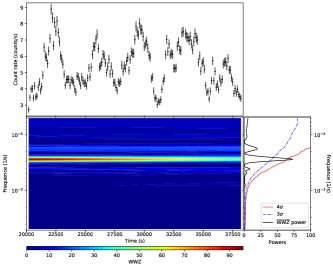
The X-ray Multi-Mirror Mission (XMM-Newton) was launched on December 10th 1999 by European Space Agency’s (ESA). XMM-Newton carries a set of three X-ray CCD cameras (EPIC), including two MOS (Turner et al., 2001) and one PN (Strüder et al., 2001), with an unprecedented large effective area. The NLS1 galaxy 1H 0707-495 had been monitored 15 times over 40 ks with the former three detectors between 2000 January and 2011 February in a full frame imaging mode. The data analysis is performed following the standard procedure in the Science Analysis Software (SAS) with version of 16.0.0 provided by the XMM-Newton science operations center 111https://www.cosmos.esa.int/web/xmm-newton/sas-threads. The events are extracted from a circle region of interest (ROI) of 40-arcsec radius centered on the position (R.A. = 107.173, dec. = -49.552) of the target in 0.2-10.0 keV with time-bin of 100 s. We exclude the events in periods with high background flaring rates exceeding 0.4 counts/s, and only the good events (the PATTERN 4 for PN and PATTERN 12 for MOS) are used in generating light curves. For background, the events are extracted from a source-free circle (without any other source) with the same diameter in the same chip. Then, the correction performed by tool epiclccorr has been accomplished, and the pile-up effect is negligible. We combine the three detectors (PN+MOS1+MOS2) background subtracted light curves (we denote it as EPIC light-curve), and show them in the top panels of Fig. 1 and Figs. 5-7. Apart from that, there are two identical Reflection Grating Spectrometers (2RGS) (den Herder et al., 2001) onboard on XMM-Newton. To confirm the former results, we also derive the light curves from 2RGS products with tool rgslccorr following the standard procedure and show the results in Figs. 4-7. And the following analysis is based on these light curves.
2.2. The analysis of periodic variability
The wavelet transform is a widely used method for searching the periodic signal in the time series by changing the parameters of wavelets to fit light curves in both time and frequency domains. This method is different from Fourier analysis, which pays attention to a limited time span of data. A key advantage it has over Fourier transforms is temporal resolution: it captures both frequency and location information (location in time). However, this method may yield untrustworthy results because of the local number density of the uneven data points. A modified version of weighted wavelet Z-transform with a Morlet mother function has been provided in Foster (1996), which handles efficiently this problem by rescaling the wavelet function. Therefore, we calculate WWZ power spectral for light curves. In the II and III panels of Fig.1, we present the color-scaled WWZ power spectrum for the whole light-curve; WWZ power spectral (WWZ power develops and evolves in frequency and amplitude over time, the detailed information provided by Foster 1996.) and time-averaged WWZ power spectral (the average WWZ power at a given frequency along time) for the first and second segment, respectively.
Pan et al. (2016) divided the light-curve into two segments (see Fig. 1 therein) and then calculated the power spectrum density (PSD) with Fourier analysis for the second segment. They detected a QPO with a strong peak at Hz (which corresponds to a period of 3800 s). We use the WWZ method to re-analyze the data and surprisingly find two signals, separated by a short intermediate state, at different frequencies (see the panel II of Fig.1). We thus calculate the power spectrum for both segments, respectively. The WWZ powers for the second segment reveal a clear peak (see the bottom C and D panels of Fig.1), in agreement with Pan et al. (2016). While, in the segment 1, another QPO also appears in the WWZ power and time-averaged WWZ at Hz (see the III A and III B panels of Fig.1).
The uncertainty is evaluated as the means of the full width at half maximum (FWHM) fit Gaussian function centered around the maximum time-averaged WWZ power. The maximum time-averaged WWZ power is times of the underlying continuum with the false-alarm probability (FAP; Vaughan, 2005) of for the combined EPIC lightcurve, and for the combined 2RGS light-curve, it is 10.5 times than the underlying continuum with the FAP of . In order to establish a robust significance, we generate the artificial light curves with a simulator (Timmer & Koenig, 1995; Emmanoulopoulos et al., 2013) for all light-curves reported in this paper, and the simulator is based on the power spectral density (PSD) and the probability density function of observed variation. Therefor, the artificial light curves have full properties of statistical and variability as the X-ray flux of the target. For determining the PSD best-fit, we fit the PSD with a bending power law plus constant function (null hypothesis) as employing maximum likelihood method. In the likelihood method, we use likelihood function of , where representing the power at frequency and representing the expectation value at basing on the null hypothesis (see Groth, 1975; Leahy et al., 1983; Barret & Vaughan, 2012, for the details). For the model, the free parameters , , and are the spectral index above the bend, the bend frequency, the constant (Poisson noise) and the normalization, respectively (Markowitz et al., 2003; McHardy et al., 2006; González-Martín & Vaughan, 2012; Kelly et al., 2014). The detailed information of the method for evaluating of significance level is provided in Gierliński et al. (2008); Emmanoulopoulos et al. (2013); Ackermann et al. (2015); Bhatta et al. (2016). In total, we generate artificial light curves (the same number for others). In the III A panel of Fig.1, the and confidence levels are shown with the red solid and blue dotted-dashed curves, respectively. The significance curves represent the distribution of heights of the most significant peaks across any of the sampled frequencies basing the null hypothesis. We compute the probability of obtaining the power peaks using EPIC and 2RGS light-curves. The probabilities for the signal are () and (), respectively. On 2010 September 17, the same signal is also detected, which is shown in the Fig. 5. The results of EPIC and 2RGS light-curves are shown in left and right images, respectively. For EPIC the confidence level of the signal at Hz is (99.95%), and for 2RGS it is (99.87%). The probability of chance fluctuation in the EPIC power spectra from two independent observations light-curves at Hz is (the corresponding significance is ). Considering 15 times monitoring over 40 ks, the total exposure time is 1.3 Ms meaning segments of similar length presented here. Including the results reported above, we detect QPO signals at Hz in two segments. While the number of trials of frequency bins is within FWHM of the power peak (from to Hz, in fact the maximum of power spectra is independent of frequency bins). Accounting the total number of trials of , the combined confidence level of the signal is (99.993%).
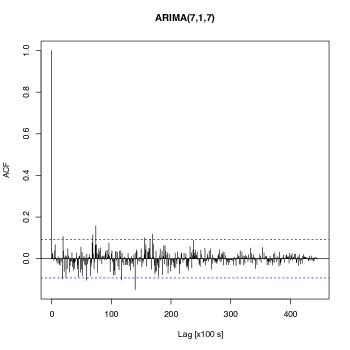
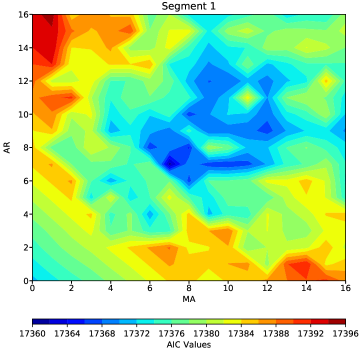
We also fit segment 1 and segment 2 light curves with autoregressive integrated moving average (ARIMA) models (Chatfield, 2003; Kelly et al., 2014; Goyle et al., 2017) to check the reliability of the quasi-periodic signals. Using the Akaike Information Criterion (AIC; Akaike, 1973), we select the best-fit ARIMA models for both light curve segments. And for segment 1 and segment 2, the best-fit models are ARIMA(7,1,7) and ARIMA(9,1,9), respectively. In the auto-correlation function (ACF) of the residuals of ARIMA(7,1,7) and ARIMA(9,1,9), the most distinct spikes, both exceeding the 95% confidence limit, are at a lag of 7400 s for segment 1 and at 3700 s for segment 2, respectively. The corresponding frequencies are Hz and Hz, well in agreement with those found with the WWZ method and indicating that the x-ray quasi-periodic variabilities in segment 1 and segment 2 may be intrinsic. For segment 1 light curve, the AIC results of 289 ARIMA models are shown in Fig. 3 with color-scaled AIC values, and the standard residuals and auto-correlation function (ACF) of the residuals of the best-fit model ARIMA(7,1,7) are shown in Fig. 2. Comparing with the LSP and WWZ methods, the ACF can not exactly determine the frequencies of quasi-periodic signal. Moreover, it is worth noting that the ACF is obtained by the residuals of the best-fit ARIMA model, rather than X-ray light-curve used in methods of LSP and WWZ. These two reasons may explain the slight difference between the frequency found in ACF and the other two methods. Furthermore, we know that higher order ARIMA models often produce periodicities in time series. Then the confidence level of ACF peak obtained by residuals between x-ray light-curves and ARIMA(7,1,7) model will be lower comparing with that of LSP and WWZ. Even so, the most distinct spike shown in left panel of Fig. 2 is well above the threshold of 95%.
For revealing the variability of X-ray flux, we fold the light-curve with a tool efold provided in HEASOFT Software using the period cycle of 8244.36 s with phase zero corresponding to 318550671.023 s. And the tool is provided in HEASOFT Software222https://heasarc.gsfc.nasa.gov/docs/software/lheasoft/download.html. The folded X-ray light-curve is fitted with a constant model, the reduced is 7875/49, it is shown in the I A panel (i.e., the insert) of Fig.1 with a red dashed-dotted line representing the mean count rate of 7.51 counts/s, which reveals a significant variability of folded light-curve varying with phase. Furthermore, this result represents the amplitude of X-ray flux varying with phase. And error bars in the fold light-curve are calculated from the standard deviation of the mean values of each phase bin. For clarity, we show two period cycles.
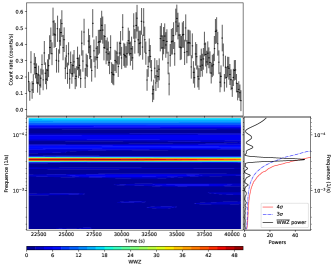
We have searched for possible signals in other observation data sets for this source. Interestingly in two observations there are tentative QPO signals, and the results are shown in Figs. 6 and 7. For the measurement on 2010 September 15, the confidence level for the signal in the EPIC and 2RGS light-curves at Hz is (see Fig. 6). While in the left (right) image of Fig. 7, the data is obtained from the measurement on 2007 May 14 for EPIC (for 2RGS), the confidence level with power peak at Hz is (). Furthermore, in the segment 2 of Fig. 4, we also detect the qusi-peroidic signal at Hz in the 2RGS data at confidence level of , which is consistent with the results reported in Pan et al. (2016). The above periodic cycles are well consistent with those displaying in the emission on 2008 February 4, strongly favoring the transient nature of the QPOs in X-rays of NLS1 galaxies suggested in Gierliński et al. (2008) and Pan et al. (2016).
3. SUMMARY AND DISCUSSION
In this work, we have re-analyzed the XMM-Newton observation data of NLS1 galaxy 1H 0707-495. By dividing the X-ray light-curve measured on 2008 February 4 into two segments, we construct the WWZ powers with the WWZ method, respectively. In the power spectrum of segment 2 of Fig. 1, there is a strong signal peaks at Hz, which confirms the previous detection of QPO at Hz in Pan et al. (2016). Surprisingly, we find a new QPO signal in the power spectrum of segment 1. Such a signal is at Hz with a combined significance (from two independent observations) of and the root-mean-square (rms) in segment 1 has a fractional variability of with a mean count rate of 7.5 counts/s. On 2008 February 4, the two QPO signals are separated by an intermediate state in light-curve and the frequency ratio is . And the signals detected in WWZ power spectra are confirmed with method of ARIMA. This is the first time to observe two QPO signals, separated by an intermediate state, in X-ray emission of AGNs. Our conclusion is further supported by the presence of these two signals, though at lower significance levels, in XMM-Newton measurements on 2007 May 14 and 2010 September 15, respectively.
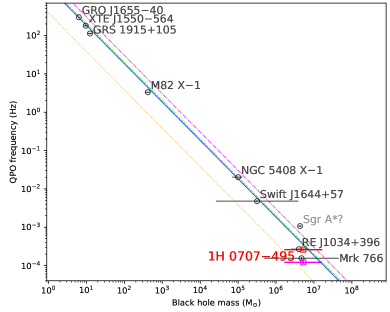
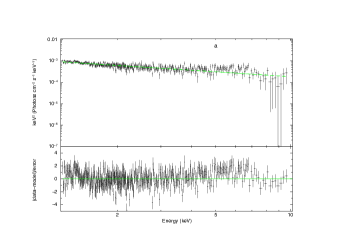
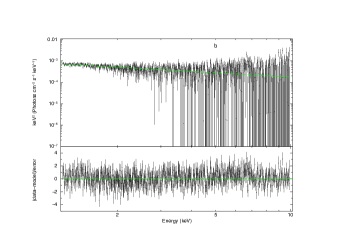
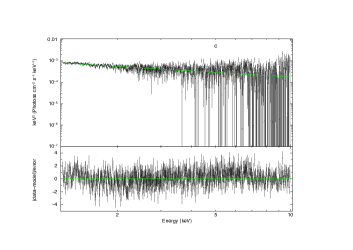
The physical origin of QPO signals in X-ray binaries as well as AGNs is still to be better understood (Li & Narayan, 2004; Remillard & McClintock, 2006). Nevertheless some models do suggest frequency ratios of and so on. For example, Lai & Tsang (2009) studied the global stability of non-axisymmetric p modes (also called inertial-acoustic modes) trapped in the innermost regions of accretion discs around black holes and showed that the lowest-order p modes, with frequencies can be overstable due to general relativistic effects, where is the azimuthal wavenumber and is the disc rotation frequency at the so-called innermost stable circular orbit (ISCO). They also suggested that overstable non-axisymmetric p modes driven by the corotational instability may account for the high-frequency QPOs observed from a number of BH X-ray binaries in the very high state while the absence of such signals in the soft (thermal) state may result from mode damping due to the radial infall at the ISCO. While in our scenario it is required that different appeared in different time intervals. Our new signal is consistent with the correlation between BH masses and QPO frequencies Kluzniak & Abramowicz (2002); Abramowicz et al. (2004); Török (2005); Remillard & McClintock (2006); Zhou et al. (2010, 2015); Pan et al. (2016), as shown in Fig. 8. We extracted the energy spectra of the segment 1, segment 2 and the whole X-ray light-curves on 2008 February 4 using XSPEC (v. 12.9n, Arnaud, 1996). The energy spectra are fitted with the model of zpowerlaw (power-law corrected by redshift of 1H 0707-495) and no significant change is found in our fitting (i.e., they have similar X-ray luminosity and spectral shape). The spectral-fitting results are shown in Fig. 9 and the best-fitting parameters are listed in Tab. 1. Therefore the physical origin of our phenomena is still a mystery. Finally we would like to caution that the identified QPOs are at relatively low significance and more robust signals are still needed to establish this kind of phenomena.
Acknowledgments
We would like to sincerely thank the anonymous referees for the useful and constructive comments. This work was supported in part by the National Basic Research Program of China (No. 2013CB837000) and the National Key Program for Research and Development (2016YFA0400200), the National Natural Science Foundation of China under grants of No. 11525313 (i.e., the Funds for Distinguished Young Scholars), 11433009, 11573071, 11673067, 11733009, U1738124, the Key Laboratory of Astroparticle Physics of Yunnan Province (No. 2016DG006), and China postdoctoral science Foundation (No. 2017M621859).
References
- Abdo et al. (2009) Abdo, A. A., Ackermann, M., Ajello, M., et al., 2009, ApJ, 699, 976
- Abramowicz et al. (2004) Abramowicz, M. A., Kluźniak, W., McClintock, J. E., & Remillard, R. A. 2004, ApJL, 609, 63
- Ackermann et al. (2012) Ackermann, M., Ajello, M., Ballet, J., et al., 2012, Science, 335, 189
- Ackermann et al. (2015) Ackermann, M., Ajello, M., Albert, A., et al., 2015, ApJL, 813, L41
- Akaike (1973) Akaike, H. 1973, Biometrika, 60, 255
- Arnaud (1996) Arnaud, K. A., 1996, ASPC, 101, 17
- Barret & Vaughan (2012) Barret, D., & Vaughan, S. 2012, ApJ, 746, 131
- Bhatta et al. (2016) Bhatta, G., Zola, S., Stawarz, Ł., et al., 2016, ApJ, 832, 47
- Bolton (1972) Bolton, C.T., 1972, Nature, 235, 271
- Chatfield (2003) Chatfield, C. 2003, The Analysis of Time Senes (6th ed.; New York: Chapman & Hall)
- Covino et al. (2017) Covino, S., Sandrinelli, A. & Treves, A., 2017, arXiv:1702.05335v1
- den Herder et al. (2001) den Herder, J. W., Brinkman, A. C., Kahn, S. M., et al., 2001, A&A, 365, L7
- Emmanoulopoulos et al. (2013) Emmanoulopoulos D., McHardy I. M., Papadakis I. E., 2013, MNRAS, 433, 907
- Foster (1996) Foster G., 1996, AJ, 112, 1709
- Gierliński et al. (2008) Gierliński, M., Middleton, M., Ward, M., & Done, C., 2008, Nature, 455, 369
- Goodrich (1989) Goodrich, R. W., 1989, ApJ, 342, 224
- González-Martín & Vaughan (2012) González-Martín, O., Vaughan, S., 2012, A&A, 544, A80
- Goyle et al. (2017) Goyle, A., Stawarz, Ł, Zola, S. et al., 2017, arXiv:1709.04457
- Groth (1975) Groth, E. J. 1975, ApJS, 29, 285
- Kelly et al. (2014) Kelly, B. C., Becker, A. C., Sobolewska, M., et al., 2014, ApJ, 788, 33
- Kidger et al. (1992) Kidger, M., Takalo, L., & Sillanpaa, A., 1992, A&A, 264, 32
- Kluzniak & Abramowicz (2002) Kluzniak, W., & Abramowicz, M. A. 2002, arXiv:astro-ph/0203314
- Komossa (2008) Komossa, S., Rev. Mex. 2008, Astron. Astrophys. Conf.erence Ser., 32, 86
- Lai & Tsang (2009) Lai, D., & Tsang, D., 2009, MNRAS, 393, 979
- Leahy et al. (1983) Leahy, D. A., Darbro, W., Elsner, R. F., et al. 1983, ApJ, 266, 160
- Li & Narayan (2004) Li, L.-X., & Narayan, R., 2004, ApJ, 601, 414
- Liao et al. (2015) Liao, N.-H., Liang, Y.-F., Weng, S.-S., Gu, M.-F., & Fan, Y.-Z., 2015, arXiv:1510.05584
- Markowitz et al. (2003) Markowitz, A., Edelson, R., Vaughan, S., et al., 2003, ApJ, 593, 96
- McHardy et al. (2006) McHardy, I. M., Koerding, E., Knigge, C., et al., 2006, Nature, 444, 730
- Osterbrock & Pogge (1985) Osterbrock, D. E. & Pogge, R. W., 1985, ApJ, 297, 166
- Pan et al. (2016) Pan, H.-W., Yuan, W.-M., Yao, S., et al., 2016, ApJL, 819, L19
- Pogge (2000) Pogge, R. W., 2000, New Astron. Rev., 44, 381
- Reis et al. (2012) Reis, R. C., Miller, J. M., Reynolds, M. T., et al., 2012, Science, 337, 949
- Remillard & McClintock (2006) Remillard, R. A., & McClintock, J. E., 2006, ARAA, 44, 49
- Strüder et al. (2001) Strüder, L., Briel, U., Dennerl, K., et al., 2001, A&A, 365, L18
- Timmer & Koenig (1995) Timmer, J., & Koenig, M., 1995, A&A, 300, 707
- Török (2005) Török, G., 2005, A&A, 440, 1
- Turner et al. (2001) Turner, M. J. L., Abbey, A., Arnaud, M., et al., 2001, A&A, 365, L27
- Valtonen et al. (2006) Valtonen, M. J., Lehto, H. J., Sillanpü, A., et al., 2006, ApJ, 646, 36
- Vaughan (2005) Vaughan, S. 2005, A&A, 431, 391
- Webster & Murdin (1972) Webster, B.L., & Murdin, P., 1972, Nature, 235, 37
- Zhang et al. (2017a) Zhang, P.-F., Yan, D.-H., Liao, N.-H., Wang, J.-C., 2017a, ApJ., 835, 260
- Zhang et al. (2017b) Zhang, P., Zhang, P.-F.,, Yan, J.-Z., Fan, Y.-Z., Liu, Q.-Z. 2017b, ApJ, 849, 9
- Zhou et al. (2010) Zhou, X.-L., Zhang, S.-N., Wang, D.-X., & Zhu, L., 2010, ApJ, 710, 16
- Zhou et al. (2015) Zhou, X.-L., Yuan, W., Pan, H.-W., & Liu, Z., 2015, ApJL, 798, L5

| Parameters | Segment 1 | Segment 2 | Average Spectrum | |
| s | s | s | ||
| zpowerlw | ||||
| Flux () | — | |||
| Reduced / | — | 1.29/418 | 1.10/686 | 1.21/822 |
Note: The results of X-ray spectral-fitting of segment 1, segment 2 and time-averaged spectra. The redshift in fitting is fixed at 0.04057 and is photon index of zpowerlw. (the normalization of zpowerlw) is in units of photons at 1 keV and the Flux is in units of .